2010 Complexity in Engineering
On Modeling and Measuring Inter-dependencies among Critical Infrastructures Vincenzo Fioriti Dpt. Calcolo & Modellistica ENEA Rome, Italy
[email protected]
Gregorio D'Agostino Dpt. Calcolo & Modellistica ENEA Rome, Italy
[email protected] II.
Sandro Bologna Dpt. Calcolo & Modellistica ENEA Rome, Italy
[email protected] IDENTIFICATION OF THE BOUNDARIES
The first step is devoted to identify the boundaries and the interrelations (at qualitative level) between the Information and Telecommunication Technology (ICT) network and the Power System (PS), thus discovering major contact points and linkages [4]. In Figure 1 the most prominent physical inter-dependencies are represented at what we call the “service level”, i.e. the higher level of contact between ICT and PS. These physical inter-dependencies help to identify as nodes and links the elements of the infrastructures.
Abstract— During the last years man efforts have been devoted to inspect the inter-dependence among Critical Infrastructures. Even assuming that the asset owners are supposed to handle their own possible misbehaviours properly, critical events maybe triggered by infrastructure's interactions. Therefore the need to handle and possibly measure inter-dependencies. Within this perspective, the EU funded MIA Project which basic aim is to assess some measures to quantify inter-dependencies among Critical Infrastructures (energy and ICT networks) for the topological and the service level. We report recent outcomes of that project based on topological information and especially on spectral analysis that can be related to dynamical properties of the electric and telecommunication systems. A topological concepts of “Relevance” is applied for the first time to the real electric network of Roma area. Keywords-critical infrastructure; interdependence; topological cal properties;
I.
INTRODUCTION
Current context of network inter-dependency analysis [17,36] for energy, transportation, communication, oil, gas, water and ICT networks [7,8], the so called Critical Infrastructures, has developed insights on the magnitude of the potential risk but has had great difficulty, given the innate complexity, in developing appropriate practical methodologies for measuring dependencies. The incapability to conduct appropriate networks interdependencies measurements undermines the possibility that the Critical Infrastructures (CI) protection programs can correctly assign resources and efforts for mitigation solutions targeted to the most important risks. The MIA (Methodology for Interdependencies Assessment) EU Project [1,2,3] aims to assess measures of interdependencies between the ICT and the electricity generation/transmission and test them on an Italian case study scalable to EU level. Here we report some of the results of the project. The MIA project approach consists of three steps: qualitative recognition of infrastructure interdependencies
978-0-7695-3974-4/10 $26.00 © 2010 IEEE DOI 10.1109/COMPENG.2010.14
Figure 1 Major inter-dependencies between ICT and PS. III.
THE SERVICE AND TOPOLOGICAL METRIC
Through the interactions depicted in Figure 1, the project develops a variety of descriptions of the inter-dependencies at the service level [6] based on the basic components of the infrastructures. By that means, it is possible to provide input/output relations between the different points (components) of the system. Among numerical descriptors of the mutual dependence it is worth noting the transfer matrix function between any pairs of node, regardless of their belonging to the Power System (PS) or the ICT part of the global system. This type of measure is based on the linear System Theory. Given Wij(s), the transfer matrix function between point i and j (defined in the Laplace domain) we may define:
|Wij(s)| = |Fij(s)| / |1 + Fij(s)| 85
(1)
as an interdependence measure (where F represents the direct transfer function). It is worth stressing that this elegant approach (and in turn the related measures of dependence) do apply at pertubative level only, as linearity is lost when drastic changes occur on the system. Nevertheless, even dealing with the most severe disturbance, in many cases, the onset of the event maybe treated by linear System Theory. One of the limits of the above approach is the vast amount of information it requires. The knowledge of details on components technical characteristics, their geographical position and functional working conditions represent a prerequisite for the analysis. Acquiring all such information is rarely possible for a lot of reasons: stakeholders tend to keep their data reserved; very often both the ICT and PS are operated by several companies; users needs may also vary thus changing the global asset of the system. Very often, the best one can get is the topological structure of the two infrastructure and their physical connection, or, in other words, the topological structure of the whole system.
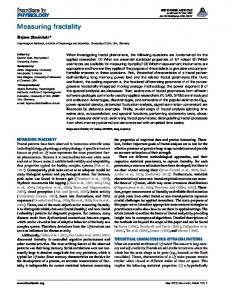
Figure 2 The graph of the Roma Area electrical infrastructure.
This net represents a critical infrastructure consisting of an actual generation/transmission medium and high voltage lines power grid, serving five millions people distributed around the capital of Italy. The dynamical importance of a node (or a link) i is defined as the normalized amount by which Ȝm decreases if a node (or link) is removed:
Actually, standard topological indicators such as degree, clustering and centrality are relevant quantities for assessing "a priori" information on the component inter-dependencies [5,11,12,13,35]. These parameters can be also employed to provide a first, non trivial, understanding of the network's inter-dependencies [5]. Among the topological analytical tools the spectral description of the networks [14,16,18,23,26] deserves a special treatment. By that means it is possible to infer insights on dynamical properties based on “static” parameters and thereafter estimating dependency. Following Restrepo, Ott and Hunt [27] we will focus on the largest eigenvalue Ȝm of the graph adjacency matrix; that parameter (under a set of commonly accepted hypotheses) is closely related to the epidemic spreading (of failures) [9,10,20,21,24,30,33], to the percolation properties and to the synchronization of dynamical systems [15,28,29]. A system is said to be synchronized when all the states, (or in a weak sense their phases) converge to the same (equilibrium) value. In other words, the different components of a system are synchronized when deviation from a “natural” trajectory tend to vanish in time. As a practical application of the concept of “dynamical importance” introduced in [27], we have considered the Roma Area Electric System that can be abstracted to the the unweighted network shown in Figure 2.
Ii = - ǻȜi / Ȝm .
(2)
This simple characterization would be very useful if we could effectively consider the dynamical importance as a dependency index. In fact, suppose you have a synchronized network of oscillator describing [11,15] a power grid (Figure 2), according to [28,29,31,32]: K c k 0 / Ȝm
(3)
where Kc is the coupling synchronization threshold of Kuramoto [13,19]; thus the maximum eigenvalue is directly related to dynamical properties such as synchronization [27]. Now note that synchronization can be seen as a strong inter-dependency [14] and that it is also possible to relax it to the so-called generalized synchronization, i.e. a weaker, nevertheless clear, form of inter-dependency [32]. Therefore, if we remove a node i, we can infer a measure of the “dynamical dependence” on it for all the other nodes by means of the variation of the “maximum eigenvector” (the eigenvector of the maximum eigenvalue): Iij= e'j(i)- ej
(4)
where ej represents the j-th component of “maximum eigenvector” and e'j(i) the “disturbed” value when the i-th node is removed. Thus, if we consider a node (link) i and its dynamical importance Ii , we can define a measure for the nodes (links) inter- dependency according to (2). In Figure 3 is shown the dynamical importance of the different nodes belonging to the net of Figure 2.
86
ACKNOWLEDGEMENTS
It is worth noting that there exist three nodes significantly separated from the rest of the system since they exhibit larger “relevance”. These nodes correspond to actually important components of the system: the main energy feeder node of a big city (Rome) and the two largest energy transportation nodes in the area; the latter two can be seen as pacemaker for the whole network.
Authors gratefully thank E. Ciapessoni, C. Brasca, M. Sforna, S. Buschi, R. Setola, G. Condorelli, C. Caruso, S. Caracò, B. Di Carlo, E. Casalicchio, G. Fiorenza, and all coworkers of the MIA Project. REFERENCES [1] The MIA Consortium is formed by ENEA (coordinator), ERSE, TERNA, TELECOM, ENEL, Booz&Co. With the support of the Prevention, Preparedness and Consequence Management of Terrorism and other Security-related Risks Program' European Commission Directorate-General Justice, Freedom and Security. [2] This project has been funded with support from the European Commission. This publication reflects the views only of the authors, and the Commission cannot be held responsible for any use which may be made of the information contained therein. [3] http://www.progettoreti.enea.it/mia/. [4] M. Sforna, B. Di Carlo, E. Ciapessoni, C. Brasca, MIA A1 Report, (2008) [5] V. Rosato, G. D’Agostino, MIA A2 Report, (2009) [6] E. Ciapessoni, C. Brasca, E. Casalicchio, MIA A3 Report, (2009) [7] D. J. Watts and S. H. Strogatz, Nature (London) 393, 440 (1998). [8] A. L. Barabasi and R. Albert, Science 286, 509 (1999). S. Jalan and J. Bandyopadhyay, Phys. Rev. E 76, 026109 (2007). [9] S. Jalan and J. Bandyopadhyay, arXiv:cond-mat/0611735v2 (2008). [10] I. Farkas et al, Phy. Rev. E 64, 026704 (2001). [11] F. Chung et al., PNAS 100, 6313 (2003). [12] M. Rosas-Casals, S. Valverde and R. Sole, Int. J. Bif. Chaos 17, 2465 (2007) [13] J. X. de Carvalho et al., Phy. Rev. E 79, 056222 (2009). [14] S. Boccaletti et al., Phy. Rev. E 74, 016102 (2006). [15] V. Fioriti, S. Ruzzante, E. Castorini, E. Marchei, and V. Rosato, CRITIS 08 Frascati , http://critis08.dia.uniroma3.it/program.php [16] A. Eldeman and N. Rao, Acta Numerica 14, (2005). [17] A. Diu, www.ad-consulting.eu/docs/ADC_IET.pdf [18] L. Laloux et al., Phy. Rev. Lett., 83, 1467 (1999). [19] L. Pecora and T. Carroll, Phy. Rev. Lett. 80, 2109 (1998). [20] F. Atay et al., IEEE Trans. Circuit and Systems 53, 92 (2006). [21] P. Mc Graw and M. Menzinger, Phy. Rev. Lett. 98, 248701 (2007). [22] A. Gasparri, G. Oliva and S. Panzieri, Proc. 7th IEEE Int. Conf. Ind. Info. 09; M. Porfiri, D. J. Stilwell, and E. M. Bollt, IEEE Trans. Circuit and Systems 55, (2008). [23] E. P. Wigner, Ann. Math, 67, 325 (1958). [24] X. Ye and W. Zhuo, Int. J. Hyb. Inf. Tech., 2, (2009). [25] D. Vukadinovic et al., ETH TIK-NR, 118, (2001). [26] A. Crisanti, G. Paladin, and A. Vulpiani, Spriger Series in Solid State, 104, (1993). [27] J. Restrepo, E. Ott and B. Hunt, Phy. Rev. Lett 97, 094102 (2006). [28] J. Restrepo, E. Ott and B. Hunt, Phy. Rev. E 71, 036151 (2005). [29] J. Restrepo, E. Ott and B. Hunt, Phy. Rev. Lett 96, 254103 (2006). [30] Y. Wang et al., Proc. SRDS, 25 (2003). [31] Y. Kuramoto, Chemical Oscillators, Springer Verlag, Berlin (1994). [32] A. Pikovsky et al., Synchronization, Cambridge Univ. Press, Cambridge, (2001). [33] F. Atay et al., Phisica D 224, 35(2006); A. Arenas et al. Pgy. Rep. 469, 93 (2008); M. Barahona and L. Pecora, Phy. Rev. Lett. 89, 054101 (2002). [34] J. Almendral and A. Diaz-Guilera, New J. Phy 9, 187 (2007). [35] S. Rinaldi et al., IEEE Cont. Sys. Mag., 12 (2001)
Figure 3 Node dynamical importance (histogram) of the electrical network of Figure 2. The three nodes of larger “relevance” are in abscissa 0.35, 0.70 and 0.75. Therefore the dynamical importance seems suited to recognize functionally prominent nodes. In order to directly calculate the dependency between node i and j we need the difference Ii – Ij or the link dynamical importance Iij. In this example we only consider the electric network (Figure 2). The extension to other interconnected networks as the ICT network can be made through the links among ICT nodes and electric nodes identified as physical links (see Figure 1) and considering the related consensus problem [22,34]. Another important feature of Ȝm (the largest eigenvalue of the adjacency matrix) is the inverse proportionality with the epidemic threshold tR (i.e. failure birth rate on repair rate), a value beyond which epidemics (in our case cascading failures) [23,24,25] ensue in a network: tR = 1/Ȝmax (here tR = 0.16) to be compared with the actual evaluated average threshold tR > 0.7 (year 2008). IV.
CONCLUSION
The MIA Project contributes to the European CIP as the initiator of the concept of CI inter-dependencies “metrics” (i.e. measures) by means of best practices and innovations. The module of the transfer function (e.g. frequency response) may represent a good metric if an almost complete description of systems is available and weak disturbance are accounted for. Otherwise it is possible to resort to a “spectral metric” derived from the maximum eigenvalue of the adjacency matrix of the overall network. Therefore these methodologies allow to gain insights of the behaviour of the infrastructures, paving the way to a deeper knowledge of the CI protection problem.
87