Guilherme Flach, Marcelo Johann, Lucas Nunes, Ricardo Reis. {gaflach, johann, lpnunes, reis}@inf.ufrgs.br. Universidade Federal do Rio Grande do Sul ...
SIM 2011 – 26th South Symposium on Microelectronics
119
On Placement Coloring Guilherme Flach, Marcelo Johann, Lucas Nunes, Ricardo Reis {gaflach, johann, lpnunes, reis}@inf.ufrgs.br Universidade Federal do Rio Grande do Sul (UFRGS)
Abstract We present a new technique for visually comparing placement results through component coloring using partitioning and the Fiedler eigenvector. By coloring a placement result, we can quickly get insights on how to improve a placement tool and understand what matters and what does not to the placement quality. As a side effect, our coloring scheme may generate beautiful images, making this paper about both artistic and scientific experiments.
1.
Introduction
Placement is the task responsible to place components evenly without overlap over the circuit area so that wirelength and other parameters are targeted. Put in those words, placement seems to be a simple task, however, due to the huge number of components that should be processed at same time, placement is challenging. Indeed placement is a NP-Complete problem [1] and hence practical techniques do not try to solve it optimality. The large number of components also imposes a difficulty when comparing placement results from different placement tools. Although other metrics as congestion and routability are being introduced, halfperimeter wirelength (HPWL) still being the one most used to compare placement results. However HPWL only can indicates that one placement result may be assembled with more or less wirelength, but does not answer an important question for research: why one placement result is better than other?
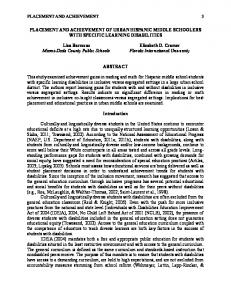
Fig. 1 – An example of placement coloring using Fiedler eigenvector. To try to answer that question we developed two schemes for component coloring using partitioning [2] and the Fiedler eigenvector [3]. Wisely coloring components allows to compare visually different placement results and get insight on why a placement results is better than other.
2.
Placement Coloring
It is known that placement and partitioning are in some extent correlated [2]. This correlation suggests that cells in a same partition tend to be placed in such a way they are clustered. This is the main idea and motivation behind our coloring schemes. With that in mind, we then have selected two algorithms to color components: (1) min-cut partitioning and (2) Fiedler eigenvector.
SIM 2011 – 26th South Symposium on Microelectronics
120
2.1.
Coloring using Min-Cut Partitioning
A min-cut partitioner attempts to minimize the number of hyperedges which nodes belong to different partitions keeping partitions balanced. A circuit netlist is directly mapped to a hypergraph and so any partitioner that supports hypergraphs can be used. In this work, we use hMetis [4]. Coloring a placement using a min-cut partitioning results is straightforward: to each partition a different color is set and all cells belonging to a partition are painted with the partition color. An example of min-cut partitioning coloring is presented in Table 1 where the netlist was partitioned in 8 balanced partitions. Tab.1 - Min-Cut coloring scheme. Images for ibm01 benchmark using 8 partitions. Capo
Dragon
FastPlace 3
mPL
HPWL: 1.90689e+06
HPWL: 1.87986e+06
HPWL: 1.72773e+06
HPWL: 1.6185e+06
2.1.1.
Experimental Results This coloring scheme was then used to colorize ISPD 2002 benchmarks set [10] using the placement results from four placers: Capo [6], Dragon [7], FastPlace 3 [8] and mPL [9]. Each benchmarks-result pair was colored using 2, 4, 8, 16, 32, 64 and 128 partitions. Table 1 presents the bechmark-result pair for ibm01 benchmark colored using 8 partitions. We can notice clearly that Capo and Dragon use partitioning based techniques in their placement flow as the clusters are well-shaped. Analytical placers do not have this pattern and tend to form amorphous clusters. This patterns of well-shaped and amorphous clusters remains through all experiments using these placers. Another tendency in the experiments indicates that amorphous clusters implies in better HPWL results. For this, we may conclude that, although placement and partitioning are related, imposing a shape to the partition cluster may harm the result quality. Both FastPlace and mPL do not use partitioning, but as the experiments indicate the partitioning is indirectly take into account. 2.1.2.
Case Study: Improving Our Placement Tool Quality using Partitioning When developing our placement tool, we were able to beat most of state-of-the-art placer runtimes, but were unable to match the same HPWL quality. Using the min-cut partitioning coloring scheme we realized that our placer failed to capture global information on how cluster must be placed. This problem can be noticed in Figure 2a where clusters formed by our prior placer are less concentrated than those formed by FastPlace 3 as shown in Figure 2b. To insert global view in our placement tool, we used partitioning itself. As we have noticed previously, imposing a hard shape for partition clusters could harm the result quality, so we use the partitioning of cells only to impose an initial position for each cell.
(a)
(b)
(c)
Fig. 2 – Placement coloring. (a) Our prior placer result; (b) FastPlace 3 result; (c) Our final placer result using partitioning for initial placement. The initial placement is done placing cell in the same partitioning in one of the four placement area quadrants instead of putting all cells in the middle of the circuit. This increased the total run-time of the
SIM 2011 – 26th South Symposium on Microelectronics
121
placement, but allowed our placer to provide state-of-the-art results. The result after partitioning is presented in Figure 2c.
2.2.
Coloring using Fiedler Eigenvector
The Fiedler eigenvector provides a ordering of nodes of a connected graph and can be used for partitioning [3]. The great advantage over min-cut partitioner is that Fiedler method provides a way to measure how close and how far in connectivity terms a cell is from other creating a continuous partitioning. The disadvantage is that Fiedler method only works on graphs so the netlist, a hypergraph, must be casted to become a graph. The Fiedler eigenvector is the eigenvector associated to the second smallest eigenvalue of the Laplacian matrix of a graph. The Laplacian matrix represents the connectivity of the graph, hence of the circuit. Each cell is associated to an element in the eigenvector. In this work, we use the method described in [5] for computing the Fiedler eigenvector.
(a)
(b)
Fig. 3 – Fiedler coloring scheme: (a) ibm01; (b) ibm18. To color the cells we first normalize the Fiedler eigenvector such that the smallest value in the eigenvector is mapped to zero and the largest value is mapped to one. After we simply paint the cell picking up the color in a color temperature pallet respective to the element value in the vector associated to that cell. This way, cell with values bellow 0.5 are mapped to cold colors and the remain ones to hot colors. 2.2.1.
Experimental Results Again, this coloring scheme confirmed the fact that placement and partitioning are correlated problems. All images generated from results provided by good placer show same-colored cells clustered together. Here another interesting effect is noticed hot colors and cold colors tend to appear clustered as can be seen in Figure 3. This relates with the fact that Fiedler eigenvector can be used as a approximation for min-cut bi-partitioning. Fiedler coloring brings another very useful property for analytical placer. These placers start with cells concentrated in the center of the placement area and iteratively spread cells until they are evenly spread over the circuit. In the spreading process, many placers create tentacles as the mass of cell is spread from the very concentrated initial state. This effect can be seen in Figure 1 where tentacles are formed by cluster of samecolored cells. Therefore Fiedler coloring scheme can predict cell clusters which are more easily expelled from the mass of cell. Such property is still in study and it was not used in our placer till now.
3.
Conclusions and Future Work
In this paper we developed and presented some experimental results that supported placement coloring as a technique to compare visually placement results as well as a tool to get insights on how to improve placement quality. Our coloring schemes are created using the min-cut partitioning and the Fiedler eigenvector. Both coloring schemes confirmed that placement and partitioning are indeed correlated problems, since same-colored components tend to be placed together. However it is shown that imposing a hard shape for cells of a partition may harm the placement quality. This indicates that partitioning can be used as a guide for placement, but not as a sole solution. Besides technical contributions presented by coloring schemes, as a side effect, beautiful images are generated. This make the coloring technique useful for both science and, in some extent, for arts. Undoubtedly, this is an underdevelopment work and many more experiments can be performed. A interesting experiment to be done is to study the relation of hierarchical partitioning and the min-cut partitioning. Also new coloring schemes can be explored.
SIM 2011 – 26th South Symposium on Microelectronics
122
4.
References
[1]
Donath, W. E. 1980. Complexity theory and design automation. In Proceedings of the 17th Design Automation Conference. pp. 412-419.
[2]
M. A. Brever,“Min-Cut Placement”, Journal of Design Automation and Fault Tolerant Computing, Oct., 1977, pp. 343-362.
[3]
A. J. Seary and W. D. Richards. Partitioning networks by eigenvectors. In Proceedings of the International Conference on Social Networks, volume 1, 1995.
[4]
G. Karypis and V. Kumar. “hMETIS 1.5: A hypergraph partitioning package”. Technical report, Department of Computer Science, University of Minnesota, 1998. Available on the Web at URL http://www.cs.umn.edu/~metis.
[5]
N. P. Kruyt. “A conjugate gradient method for the spectral partitioning of graphs”. Parallel Computing, 22(11):1493–1502, 1996.
[6]
J. A. Roy, D. A. Papa, S. N. Adya, H. H. Chan, A. N. Ng, J. F. Lu, and I. L. Markov. Capo: Robust and scalable open-source min-cut floorplacer. In ACM/SIGDA International Symposium on Physical Design (ISPD), pages 224–226, 2005.
[7]
T. Taghavi, X. Yang, and B.-K. Choi. “Dragon2005: Large-scale mixed-size placement tool.” In ACM/SIGDA International Symposium on Physical Design (ISPD), pages 245–247, 2005.
[8]
N. Viswanathan , Min Pan , C. Chu. “FastPlace 3.0: A Fast Multilevel Quadratic Placement Algorithm with Placement Congestion Control”. Proceedings of the 2007 Asia and South Pacific Design Automation Conference, p.135-140, January 23-26, 2007.
[9]
T. Chan, J. Cong, and K. Sze. Multilevel generalized force-directed method for circuit placement. In ACM/SIGDA International Symposium on Physical Design (ISPD), pages 185–192, 2005.
[10]
N. Viswanathan , C. C. Chu, “FastPlace: efficient analytical placement using cell shifting, iterative local refinement and a hybrid net model”, Proceedings of the 2004 international symposium on Physical design, April 18-21, 2004, Phoenix, Arizona, USA.