reduced. Therefore the system is able to support a larger number of peers in a streaming session with a fixed server capacity, and thus achieve better scalability.
On Scalability of Proximity-Aware Peer-to-Peer Streaming Liang Dai , Yi Cui and Yuan Xue Abstract—P2P (peer-to-peer) technology has proved itself an efficient and cost-effective solution to support large-scale multimedia streaming. Different from traditional P2P applications, the quality of P2P streaming is strictly determined by performance metrics such as streaming delay. To meet these requirements, previous studies resorted to intuitions and heuristics to construct peer selection solutions incorporating topology and proximity concerns. However, the impact of proximity-aware methodology and delay tolerance of peers on the scalability of P2P system remains an unanswered question. In this paper, we study this problem via an analytical approach. To address the challenge of incorporating Internet topology into P2P streaming analysis, we construct a H-sphere network model which maps the network topology from the space of discrete graph to the continuous geometric domain, meanwhile capturing the the power-law property of Internet. Based on this model, we analyze a series of peer selection methods by evaluating their performance via key scalability metrics. Our analytical observations are further verified via simulation on Internet topologies.
I. I NTRODUCTION Live multimedia streaming is gaining increasing popularity with the advent of commercial deployment from major content providers. Among the existing systems, P2P streaming has emerged to be a promising approach to large-scale multimedia distribution [3], [10], [2], [12], [6], [4], [16]. The basic idea is that each peer in the P2P streaming system will contribute their uploading capacities to the downloading demands of other peers. In this way, the media server load could be significantly reduced. Therefore the system is able to support a larger number of peers in a streaming session with a fixed server capacity, and thus achieve better scalability. While proven to provide a better scalability in terms of server load, the overall P2P streaming system performance in terms of delay and network bandwidth cost largely depends on the P2P topology. At the core of its construction is the problem of peer selection – how to select the parent peer(s) to download the stream. The goal is to construct a high quality topology that could minimize the server load and delay experienced by peers, and reduce the network bandwidth cost. To address this problem, the existing approaches have resorted to intuitions and heuristics. The proposed solutions include tree-based, mesh-based, directed-acyclic-graph-based, and randomized topology construction algorithms and protocols. Liang Dai, Yi Cui Yuan Xue are affiliated with the Department of Electrical Engineering and Computer Science, Vanderbilt University. Their email addresses are {liang.dai, yi.cui, yuan.xue}@vanderbilt.edu. This work was supported by NSF Career Award under contract number NSF CNS-0643488, Vanderbilt University Discovery Grant, and gift fund from Microsoft Research. Any opinions, findings, and conclusions are those of the authors and do not necessarily reflect the views of the above agencies.
One of the fundamental challenges that all these approaches face is the problem of topology mismatch between the overlay layer of P2P network and physical layer network. The peers which are one-hop away in the P2P topology could have certain distance (number of hops) between them in the underlying physical network. Such a distance governs its streaming quality such as delay. Without considering such distances between peers in the physical network, the random peer selection mechanism used in many commercial P2P streaming systems are shown to be inefficient [1], [7]. Proximity-aware peer selection strategies [3], [2], [8] could remedy such inefficiency. In the proximity-aware P2P streaming systems, the peers are aware of such distance and select peers that are closer as their parents for downloading. The benefit of such proximity-aware mechanism in P2P streaming include (1) Reduced delay which is important for live streaming applications; (2) Reduced load on network by removing long-haul unicast connections, which also achieves ISP friendliness. Towards the construction of high-quality P2P topologies, it is natural to ask the following questions for the proximityaware streaming systems: (1) how server load and network bandwidth cost scales with the number of peers in the system; (2) how server load and network bandwidth cost scales with the delay tolerance of peers. Unfortunately, although the existing research have devised protocols to construct good proximity-aware P2P topologies, they fail to offer a comprehensive and analytical study on the characteristics that govern the scalability and performance of P2P streaming. On the other hand, though there exist analytical models for the P2P file sharing [11], [9], [15] and on-demand P2P streaming [14], [13], none of them could be applied to proximity-aware P2P streaming systems where the underlying physical network topology needs to be incorporated into the model. In this paper, we seek analytical insights into the scalability of proximity-aware P2P streaming solutions. The challenge to incorporating topology concern into the P2P streaming analysis is evident from the complexity of Internet topology. To gain critical insights, we must construct an analytical model reasonably simple to derive closed-form results, meanwhile capturing the essential property of Internet topology. Towards this challenge, this paper proposes a novel H-sphere network model, which maps the network topology from the space of discrete graph to the continuous geometric domain. The original contributions of this paper are two-fold. First, the novel H-sphere model enables in-depth analysis on topology-aware peer selection methods of different flavors.
Second, we systematically investigate the proximity-aware P2P streaming strategies, by evaluating their performance via key scalability metrics. The remainder of this paper is organized as follows. We first present our H-sphere model for proximity-aware P2P streaming analysis in Sec. II. Then we proceed to analyze the server load and network load in Sec. III. Finally, we validate our analytical model via a simulationbased study over Internet topologies in Sec. IV and conclude the paper in Sec. V.
x
x C
S
C
S
Downloading Region
Downloading Region
r
R
Uploading Region
t
(a) Fixed-Range (t/2 ≤ r < t)
Selection
r
R
Uploading Region
t
(b) Fixed-Range (R − t ≤ r < R)
Selection
II. A NALYTICAL M ODEL A. H-Sphere Model To enable in-depth analysis on topology-aware peer selection methods, we first need to construct an analytical model reasonably simple to derive closed-form results, meanwhile capturing the essential property of Internet topology. We first characterize the distance between peers in the underlying physical network. Here the distance between nodes are measured by their hop count in the physical network, as it reveals many important performance metrics perceived by peers in the P2P system such as streaming delay. In our network model, each node represents the router that is attached by either the server or the peers within a P2P streaming system. In order to model the distances among these nodes, we measure the number of neighboring nodes within a certain distance. In the seminal study [5] on Internet topology, the following power-law relation about neighborhood size is revealed: α · rH (1) where r is the node distance measured by hop count, and H is the constant exponent. This model regards the neighborhood centered around any node in the network as a H-sphere with radius r, and α represents the average number of nodes in the unit sphere. Then Eq. (1) gives the expected number of neighbors within r hops. Based on this power-law relation, we perform our analysis in a network sphere model with maximum radius R. The server S is situated at the center, and a client host (peer) C is allowed to appear elsewhere in the sphere. Further, let ρ be the node density (number of nodes in an H-dimensional unit), then α = ρ · sHH , where sH represents the surface area of a unit Hsphere. In the two-dimension and three-dimension cases, we have s2 = 2π, s3 = 4π. Through this model, the hop count between two peers is transformed as their geometric distance in the H-dimensional space. To model the peer bandwidth, we assume that all peers are interested with the same media stream with identical streaming bit rate. For the purpose of simplicity, we normalize the peer bandwidth with the streaming bit rate. We further assume that each peer C has enough downloading bandwidth, i.e., it is greater than or equal to 1. We further denote the normalized uploading bandwidth as randomly distributed with mean p. Finally, we assume the server S has unlimited upload bandwidth.
C
S
C
S
Downloading Region
R
Uploading Region
r
(c) Variable-Range Selection Fig. 1.
Downloading Region
R
r
Uploading Region
(d) Random Selection
Analytical Scenarios
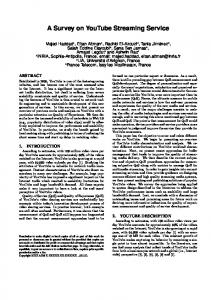
B. Peer Selection Methods In this work, we compare a series of proximity-aware peer selection methods with random peer selection strategies. In particular, we consider the following methods. • Random Selection: In this method, a peer C can seek bandwidth supply from all other peers regardless their distance to C. C can also seek help from server S, if enough bandwidth cannot be obtained from peers. • Variable-Range (VR) Selection: In this method, C has a search radius limited by r, its distance to the server S. In this way, C constrains the streaming delay from its peers to be no more than the one from the server. • Fixed-Range (FR) Selection: In this method, the search radius of peer C is limited by the constant t, which constrains the peer streaming delay to a predetermined bound. In order to establish a loop-free dependency among peers and better reflect the reality of peer selection protocols, we assume that each peer C can only download from peers whose distances to the server S are shorter than its own distance r. We illustrate these method for a 2-dimensional sphere (H = 2) in Fig. 1. Each method assigns a peer C (1) the downloading region (the vertically shaded area in Fig. 1), where all peers in this region are the supplier candidates of C; and (2) a uploading region (the horizontally shaded area in Fig. 1), where C is the supplier candidate to all peers in this region. The defined geographical dependency constraint ensures these two regions to exclude each other. Given the peer density ρ, by calculating the downloading region volume AD , one can know the number of peers in this region, denoted as ND . Similarly, by calculating the uploading region volume AU , we can acquire the number of peers in this region NU . Although illustrated for H = 2, we note that our analytical model is general to arbitrary value of H in the H-sphere.
However, the extreme complexity of calculating sphere intersection in the three-dimensional or hyper space forbids us from obtaining closed-form results to the above terms. Nevertheless, the analytical insight gained in the two-dimensional case proves to generalize into higher dimensions via simulation verification. C. Performance Metrics To measure the scalability of different peer selection methods, we introduce two metrics. • Server load L, defined as the amount of bandwidth provided by the server S to support all peers. • Network load M , defined as the summary of distances traveled by all data units within the network. The metric unit of M is the multiplication of bandwidth unit (such as Kbps) and distance, which is number of hops in topological networking terms, or geometric distance in the sphere model. The terms used in this paper are summarized in the following table. Notations S C R ρ r p t AD AU ND = ρAD NU = ρAU B r∗ L MB M
Definitions Server Peer (Client Host) Radius of the Disk Model Node Density of H-dimensional Unit Distance between the Server S and a Peer C Upload Bandwidth of the Peer Search Range in the Fixed Selection Method Volume of the Downloading Region Volume of the Uploading Region Number of Peers in the Downloading Region Number of Peers in the Uploading Region Amount of Bandwidth Received by a Peer from its Downloading Region Threshold Value Separating the Self-Sustained Region and Server-Support Region Server load Network Load per Peer Imposed by P2P Streaming Network Load TABLE I N OTATION D EFINITIONS
III. A NALYSIS To derive the server load L, we need to know how much of the streaming workload is offset by peers. We do so by studying the amount of bandwidth received by each peer C from its supplying peers included in downloading region (the vertically shaded areas in Fig. 1). A. Downloading and Uploading Regions We first look at how to calculate ND , the number of peers in the downloading region. The region consists of peers with different server-peer distance x. Such a distance min max is bounded within [rD , rD ], which is defined by different peer selection methods. From the shape of the downloading region we also know sD (x), the length of the arc, which is the collection of points distanced x away from the server S within this region. Now we have max Z rD ND = ρAD = ρ sD (x)dx (2) min rD
In the same fashion, we can calculate AU , the volume of the uploading region, and NU , the number of peers in this region. Z max NU = ρAU = ρ
rU
min rU
sU (x)dx
(3)
min max where sU (x) and [rU , rU ] serve the same purpose as their counterparts in the downloading region. As a reference, Tab. II lists the results of AD and AU as functions of r respectively.
Method Fixed (t ≤ r < R) Fixed (t/2 ≤ r < t) Fixed (0 < r < t/2) Variable Random Method
Downloading Region Area AD √ t t 2r2 sin−1 2r + t2 cos−1 2r − 2t 4r2 − t2 √ t t t −1 2 2 −1 2r sin + t cos − 2 4r2 − t2 2r 2r πr2 √ 2r2 ( π3 − 43 ) 2 πr Uploading Region Area AU p − 12 2(r2 t2 + t2 R2 + R2 r2 ) − r4 − R4 − t4
Fixed (R − t ≤ r < R) Fixed (t/2 ≤ r < R − t) Fixed (0 < r < t/2) Variable Random
2
2
2
2
2
+
√ r2 3 4
2
R +r −t +t2 cos−1 t +r2tr−R + R2 cos−1 √ 2Rr t t t −1 2 2 −1 −2r sin − t cos + 2 4r2 − t2 2r 2r t 2 − 2r 2 sin−1 t πt√ − t2 cos−1 2r + 2r t 2 − t2 4r 2 πt2 − πr2 √ r − R2 cos−1 2R 2 2 πR − πr
πr 2 3
−
r
4R2 −r 2 4
TABLE II C OMPUTATION OF D OWNLOADING AND U PLOADING R EGION A REA (H = 2)
B. Bandwidth Received per Peer With the knowledge of ND and NU , we are now able to derive B, the amount of bandwidth received per peer. For any peer whose server-peer distance is x, it supplies equal share of its uploading bandwidth p, then each peer in its uploading region gets bandwidth p/NU (x). Then B is given by max max Z rD Z rD p p B= ρsD (x) dx = sD (x) dx min min NU (x) AU (x) rD rD (4) C. Server Load After plotting Eq. (4), it confirms that B is a monotonically increasing function of distance r. This means there exists threshold value r∗ , at which B = 1. This value serves as the watershed point. As illustrated in Fig. 2, peers within this perimeter must rely on server support, which we call the server-support region, whose volume is sH r∗H /H. Peers outside this perimeter can receive enough bandwidth from peers in the inner circle, which we call the self-sustained region. The volume of this region is sH (RH − r∗H )/H, the difference of the entire sphere and the server-support region. With the knowledge of B as a function of distance r, and the r∗ , we can derive the server load L by accumulatively computing how much bandwidth the server contributes to all peers distanced r away, up to the point of r∗ . Z r∗ L = ρsH rH−1 (1 − B)dr (5) 0
200000 500
S
server load (L)
400 server-support region
160000 x
z a
300
C
S
200
r
R
Fig. 2. Load L
Analysis of Server
120000 100000 80000
40000 20000 0
0 r*
140000
60000 Downloading Region
100
R
random variable fixed, t=0.1 fixed, t=0.3 fixed, t=0.5
180000
random variable fixed, t=0.1 fixed, t=0.3 fixed, t=0.5
network load (M)
self-sustained region
0
2
Fig. 3.
4 6 outbound bandwidth (p)
8
10
Fig. 4. Analysis of Network Load MB of an Individual Peer
Server Load
From Eq. (5), we can see the percentage of the streaming workload offset by P2P streaming is constant regardless the number of peers in the network, and that the percentage of workload assigned to the server is solely determined by the average outbound bandwidth p. We plot the server load of all methods as p takes different values. Note that since B can not be derived for VR and FR selection methods, we must continue to seek for numerical solutions since L depends on B. Also as the density ρ offers rather trivial insight, showing only a special case will suffice. We choose to show the results when there are 500 nodes in the network. Shown in Fig. 3, the server load universally drops as p increases. Obviously, the abundant spare bandwidth from peers help increase the self-sustainability of all peers. The random and VR selection methods respectively achieve the highest and lowest server load. While in the middle, the FR selection method achieves higher server load when the search range is small (t = 0.1R). It achieves the lowest load when the ratio t/R is between 0.2 and 0.3. When we further increase its search range (t = 0.5R), the percentage bounces back. This performance order is consistent with the order of r∗ , i.e., the sequence according to which the curves of different methods cross with 1. Intuitively, the faster a peer selection method can reach the self-sustained region, the more server load it will be able to save. Also for the FR selection method, its search range t must be fine-tuned in order to achieve the minimum server load, which is shown to be between t = 0.2R ∼ 0.3R). While setting the downloading region too small does not help a peer to receive enough bandwidth, setting the region too large will rapidly decrease the bandwidth per share. Finally, we notice a clear diminishing return of server load saving as one linearly increases the outbound bandwidth p. D. Network Load Now we turn to derive the network load M . M is defined as the summary of distances traveled by all data units within the network. The metric unit of M is the multiplication of bandwidth unit (such as Kbps) and distance, which is number of hops in topological networking terms, or geometric distance in the sphere model. Note that since the streaming bit rate is normalized to 1 in our analysis, M can be also regarded as the average delay, i.e., summary of peer-to-peer distance weighted by the proportion of traffic carried by the pair of peers. We define MB as the peer bandwidth provision weighted by the distance from C to its supplying peers. Fig. 4 illustrates
Fig. 5.
2
4 6 outbound bandwidth (p)
8
Network Load
how MB is derived in the same spirit as B. Following the similar way, we can have max min x Z rD Z cos−1 2r −rD xp M B = sH (xH−1 da)dx (6) x AU (z) 0 −cos−1 2r √ where z = x2 + r2 − 2xr cos a is the distance between the server S and the supplying peer at the surface distanced x away from the peer C. At the inner integral of Eq. (6), we accumulate the bandwidth share C collects from peers on this surface, then multiply by the distance x. At the outer integral, we repeat the same operation for all surfaces by their distances max min − rD . to C from 0 to rD With the knowledge of MB , we now derive the total network load M as the summary of the load from the server-support region, and the load from the self-sustained region. Z r0 Z R H−1 M = ρsH [ r [MB + r(1 − B)]dr + rH−1 MB dr] 0
r0
(7) Evident from Eq. (7), ρ merely serves as the linear weight to M , Therefore, when plotting M , we choose to show the special case when there are 500 nodes in the network sphere. The network load imposed by different methods shown in Fig. 5 demonstrates an almost reverse performance order compared to the server load case ( Fig. 3). The random selection method introduces the highest network load at the cost of seeking bandwidth from peers distanced away. On the other hand, although VR selection method has the lowest server utilization, it imposes minimum load to the network since a significant portion of the bandwidth is directly retrieved from the server. The FR selection method manages to strike a balance between these two methods. Moreover, enlarging the search range t allows a peer to seek bandwidth from peers further distanced away, thus increases the network load. In summary, by evaluating the three peer selection methods in terms of the server load and network load, we claim there is no all-around winner that minimizes both metrics. Therefore, the choice of these methods in P2P streaming must be based on the application semantics and the availability of network and server resources. Finally, we stress that our analytical model is general to arbitrary value of H in the H-sphere. Referred in Tab. I, this is true to the definitions of AD in Eq. (2), AU in Eq. (3), B in Eq. (4), L in Eq. (5), MB in Eq. (6), and M in Eq. (7). In the next section, we will verify our analytical obsevations via simulation on network topologies.
10
2000
V. C ONCLUSION
server load (L)
1500
network load
server load (L)
random variable fixed, 3-hop fixed, 4-hop fixed, 5-hop
In this paper, we present our analytical study on the impact of proximity-aware methodology to the scalability of P2P 1000 1000 streaming. We propose a H-sphere model, which maps the network topology from the space of discrete graph to the 500 500 continuous geometric domain, meanwhile capturing the the power-law property of Internet. Based on this model, we 0 0 200 400 600 800 1000 1200 1400 1600 1800 2000 200 400 600 800 1000 1200 1400 1600 1800 2000 number of peers number of peers analyze a series of peer selection methods (random, variablerange, and fixed-range) by evaluating their performance via (a) p = 1 (b) p = 10 key scalability metrics, namely server load and network load. Fig. 6. Server Load under Different Outbound Bandwidth p Based on our analytical model, our major findings are as follows. First, of all peer selection methods studied, the server 10 10 random random and network loads are independent of the peer population, variable variable 8 fixed, 3-hop 8 fixed, 3-hop but solely determined by the average outbound bandwidth fixed, 4-hop fixed, 4-hop fixed, 5-hop fixed, 5-hop of peers. Second, although random selection method can 6 6 maximally save the server resource, it introduces the maximum 4 4 load to the network. A better tradeoff can be acquired through 2 2 the fixed-range selection method. However, we are unable to find an all-around winner able to minimize server and network 0 0 1 1.5 2 2.5 3 3.5 4 4.5 5 1 1.5 2 2.5 3 3.5 4 4.5 5 load simultaneously. Our analytical observations are further distance to server distance to server verified via simulation on the Internet topologies. (a) p = 1 (b) p = 10 1500
network load
2000 random variable fixed, 3-hop fixed, 4-hop fixed, 5-hop
Fig. 7. Accumulative Distribution of Network Load per Peer under Different Outbound Bandwidth p
IV. S IMULATION R ESULTS To validate our analytical observations obtained from the Hsphere model, we map them back to the real-world domain, and examine them via simulation over the topological network model, where the peer-to-peer distance is measured by the hop count of their shortest path. Using the popular BRITE Internet topology generator, we create a 6000-router topology, whose node degree distribution follows the power law with H = 4.6.We also redefine the search range in each peer selection method in accordance with the change of network model. Fig. 6 plots the growing curve of server load as the number of peers increase. Besides the fact that the performance order of all methods is consistent with our analytical finding in Fig. 3, the clear linear relationship between the server load and the peer population confirms our claim that the percentage cutoff of streaming workload between server and P2P streaming is solely determined by the outbound bandwidth p. It also confirms that the system self-sustainability in terms of streaming load share is independent of peer population. Finally, Fig. 7 shows the accumulative distribution of MB , the network load imposed by each peer in our simulation. In fact, this metric can be also regarded as the average delay experienced by each peer, i.e., summary of hop count weighted by the proportion of traffic carried by the pair of peers). From the figure, we observe that the network load of a peer is primarily determined by its distance to the server. The delay is further aggravated by the random selection method, and remedied by VR selection method. In addition, the outbound bandwidth p has little effect on the change of MB .
R EFERENCES [1] S. Ali, A. Mathur, and H. Zhang. Measurement of commercial peerto-peer live video streaming. In In Proc. of ICST Workshop on Recent Advances in Peer-to-Peer Streaming, Weaterloo, Canadda, 2006. [2] S. Banerjee, B. Bhattacharjee, and C. Kommareddy. Scalable application layer multicast. In Proc. of ACM SIGCOMM, August 2002. [3] Y. Chu, R. Rao, and H. Zhang. A case for end system multicast. In Proc. of ACM SIGMETRICS, 2000. [4] Y. Cui and K. Nahrstedt. Layered peer-to-peer streaming. In Proc. of ACM NOSSDAV, 2003. [5] M. Faloutsos, P. Faloutsos, and C. Faloutsos. On power-law relationships of the internet topology. In Proc. of ACM SIGCOMM, 1999. [6] M. Hefeeda, A. Habib, B. Botev, D. Xu, and B. Bhargava. Promise: peer-to-peer media streaming using collectcast. In MULTIMEDIA 2003. ACM Press, 2003. [7] X. Hei, C. Liang, J. Liang, Y. Liu, and K. Ross. Insights into pplive: A measurement study of a large-scale p2p iptv system. In In Proc. of IPTV Workshop, International World Wide Web Conference, 2006. [8] J. Jannotti, D. K. Gifford, K. L. Johnson, M. F. Kaashoek, and J. W. O’Toole. Overcast: Reliable multicasting with an overlay network. In Proceedings of OSDI, 2000. [9] L. Massoule and M. Vojnovic. Coupon replication systems. In Proceedings of the 2005 ACM SIGMETRICS. ACM Press, 2005. [10] V. N. Padmanabhan, H. J. Wang, P. A. Chou, and K. Sripanidkulchai. Distributing streaming media content using cooperative networking. In NOSSDAV 2002, pages 177–186. ACM Press, 2002. [11] D. Qiu and R. Srikant. Modeling and performance analysis of bittorrentlike peer-to-peer networks. In Proceedings of SIGCOMM 2004. ACM Press, 2004. [12] D. Tran, K. Hua, and S. Sheu. Zigzag: An efficient peer-to-peer scheme for media streaming. In Proc. of IEEE INFOCOM, 2003. [13] Y.-C. Tu, J. Sun, M. Hefeeda, and S. Prabhakar. An analytical study of peer-to-peer media streaming systems. ACM Trans. Multimedia Comput. Commun. Appl., 1(4):354–376, 2005. [14] D. Xu, H. Chai, C. Rosenberg, and S. Kulkarni. Analysis of a hybrid architecture for cost-effective streaming media distribution. In Proc. of SPIE/ACM Conf. on MMCN, 2003. [15] X. Yang and G. Veciana. Service capacity of peer to peer networks. In Proc. of INFOCOM, 2004. [16] X. Zhang, J. Liu, B. Li, and Y. S. P. Yum. Coolstreaming/donet: a datadriven overlay network for peer-to-peer live media streaming. In Proc. of IEEE INFOCOM, volume 3, pages 2102–2111 vol. 3, 2005.