Graphic design: Geomedia [7437], Faculty of Geosciences, Utrecht University ....
4.1: Average Spearman rank correlations between relatedness vectors .... design
of the modern car was established in 1923, when Dodge introduced the all-steel,
... IV of his magnum opus Principles of Economics entirely to the spatial ...
PRODUCTIVE PLACES
Dit proefschrift werd (mede) mogelijk gemaakt met financiële steun van de Nederlandse Organisatie voor Wetenschappelijk Onderzoek (NWO).
ISBN 978 90 6266 266 1
Graphic design: Geomedia [7437], Faculty of Geosciences, Utrecht University Copyright © Frank Neffke, Faculty of Geosciences, Utrecht University 2009. All rights reserved. No part of this publication may be reproduced, stored in a retrieval system, or transmitted, in any form or by any means, electronic, mechanical, photocopying, recording, or otherwise, without permission in writing from the publisher.
PRODUCTIVE PLACES THE INFLUENCE OF TECHNOLOGICAL CHANGE AND RELATEDNESS ON AGGLOMERATION EXTERNALITIES
Productieve Plaatsen De invloed van technologische dynamiek en gerelateerdheid op agglomeratievoordelen (met een samenvatting in het Nederlands)
Proefschrift
ter verkrijging van de graad van doctor aan de Universiteit Utrecht op gezag van de rector magnificus, prof.dr. J.C. Stoof, ingevolge het besluit van het college voor promoties in het openbaar te verdedigen op vrijdag 10 juli 2009 des middags te 12.45 uur
door Frank Marc Henri Neffke geboren op 27 november 1979 te Heerlen
Promotor: Prof.dr. R.A. Boschma Co-promotor: Dr. K. Frenken
ein Gedanke kommt, wenn er will, und nicht wenn ich will Friedrich Nietzsche Jenseits von Gut und Böse
Contents
List of figures
11
List of tables
12
Acknowledgments
13
Chapter 1 - Theories and concepts 1.1: Introduction 1.2: Agglomeration externalities 1.2.1: Agglomeration externalities and endogenous growth theory 1.2.2: Types of agglomeration externalities 1.2.3: The empirical state of the literature 1.3: Evolutionary economics 1.3.1: Choosing versus learning 1.3.2: Edith Penrose: economic development as a branching process 1.3.3: The Industry Life Cycle and the exploration-exploitation dichotomy 1.3.4: Jane Jacobs: the primacy of cities and adding new work to old 1.4: Technological change and agglomeration externalities 1.5: Outline of the thesis Appendix 1.A: Justification of data sources
15 15 19 19 22 28 30 30 34 35 38 40 43 47
Chapter 2 - The long-term dynamics of agglomeration externalities 2.1: Introduction 2.2: Approaches to estimating agglomeration externalities 2.3: Estimation framework 2.4: Data and industries 2.4.1: Occupation data 2.4.2: Data limitations 2.5: Empirical results 2.6: Conclusion Appendix 2.A: List of industries Appendix 2.B: Yearly estimates of agglomeration externalities
49 49 50 60 62 62 63 68 71 73 74
7
Chapter 3 - Agglomeration externalities and the industry life cycle 3.1: Introduction 3.2: Agglomeration externalities 3.3: Industry life cycles and agglomeration externalities 3.4: Data and industry life cycle stages 3.5: Estimation framework 3.6: Empirical results 3.7: Conclusion
77 77 78 81 84 88 91 98
Chapter 4 - Revealed relatedness, mapping industry space 4.1: Introduction 4.2: Relatedness as co-occurrence 4.3: The Revealed Relatedness method 4.4: An application: Calculating RR based on the product portfolios of plants 4.5: Conclusion Appendix 4.A: Derivation of the posterior distribution of RR Appendix 4.B: Removing the conditioning on C Appendix 4.C: Descriptive tables of RR matrices
101 101 102 105 114 124 126 127 131
Chapter 5 - The impact of plant age and technological relatedness on agglomeration externalities: a survival analysis 5.1: Introduction 5.2: Theoretical background 5.3: Estimation framework 5.4: Data 5.5: Empirical results 5.6: Comparing plant-level and local industry-level findings 5.7: Conclusion
135 135 137 141 144 147 161 162
Chapter 6 - Conclusions and a new research agenda 6.1: Introduction 6.2: Discussion of the main findings 6.2.1: Dynamics 6.2.2: Technological relatedness 6.3: Methodological contributions 6.4: Limitations 6.5: Future research 6.5.1: Comparative research 6.5.2: Revealed Relatedness 6.5.3: Relatedness and the capacity for change
165 165 166 166 168 170 172 174 174 176 178
8
Hoofdstuk 7 - Samenvatting 7.1: Inleiding 7.2: Agglomeratievoordelen 7.3: Veranderende agglomeratievoordelen door de tijd 7.4: Agglomeratievoordelen en de industrielevenscyclus 7.5: Revealed Relatedness 7.6: Technologische gerelateerdheid, agglomeratievoordelen en overlevingskansen van fabrieken 7.7: Conclusie, beperkingen en toekomstig onderzoek
179 179 180 181 182 185 188 190
References
193
Financial support and co-authorships
200
Curriculum vitae
201
9
LIST OF FIGURES
1.1: Overview of signs and significance of localisation and local diversity findings 2.1: Yearly point estimates of localisation externalities 2.2: Yearly point estimates of Jacobs externalities 2.3: Yearly point estimates of urbanisation externalities 3.1: Diversity and focus 4.1: Graphical representation of skill base overlap for products i and m, and products m and j 4.2: Industry Space in 1970 4.3: Industry Space in 2000 4.4: The ego-network for medicines in 1980 4.5: Closeness to regional portfolio and membership, expansion and contraction probabilities 5.1: Aalen graph of cumulative regression coefficient for ln(PLANTSIZE) 5.2: Aalen graph of cumulative regression coefficient for ln(LOC) 5.3: Aalen graph of cumulative regression coefficient for ln(RLOC) 5.4: Aalen graph of cumulative regression coefficient for ln(JAC) 5.5: Aalen graph of cumulative regression coefficient for ln(POPPOT)
29 74 74 75 79 111 116 117 120 123 153 153 154 154 155
11
LIST OF TABLES
2.1: 2.2: 2.3: 2.4: 2.5: 3.1: 3.2: 3.3: 3.4: 3.5: 3.6: 3.7: 3.8: 4.1: 4.2: 4.3: 4.4: 4.5: 4.6: 4.7: 4.8: 5.1: 5.2: 5.3: 5.4: 5.5: 5.6: 5.7: 12
Dependent variables and methods of estimation used in the literature Overview of regressors and outcomes in the literature Description of the data by industry National employment growth in broad sectors Gini coefficients by individual industry, 1841-1971 Agglomeration externalities and their origins Industry characteristics at different stages of the industry life cycle Agglomeration externalities and life cycle dynamics Definition life cycle stages Descriptive statistics Correlations between regressors Outcomes Outcomes regressions with alternative stage definitions Average Spearman rank correlations between relatedness vectors of different years for symmetric links Average Spearman rank correlations between relatedness vectors of different years for directed links Average Spearman rank correlations between RR vectors of different decades: second-step, symmetric links Average Spearman rank correlation between RR vectors of different decades: second-step, directed links Average Spearman rank correlations between RR vectors of different decades: first-step estimates, symmetric links Average Spearman rank correlations between RR vectors of different decades: first-step estimates, directed links Average Spearman rank correlations between RR vectors and relatedness according to the SNI69-system Average Spearman rank correlations between ingoing and outgoing links Descriptive statistics of covariates Cross-correlations between covariates Cox regressions of plant survival rates assuming age-invariant effects Test of the proportional hazards assumption in age-invariant model Cox regressions of plant survival rates with age-varying coefficients Robustness of results in Table 5.3 Robustness of results in Table 5.5
56 58 64 66 67 80 82 83 88 92 93 94 98 131 131 132 132 132 132 133 133 148 149 150 152 156 158 159
ACKNOWLEDGMENTS
What applies to innovation in general certainly holds for any advancement in this doctoral dissertation: novelty relies on the merger of preexisting ideas. If any part of the research presented in the following 201 pages could be considered novel, I am deeply indebted to the ideas of people whose texts I read or whom I was fortunate enough to meet in person. Moreover, writing this PhD thesis would have been much harder without the support of friends and colleagues. I would therefore like to take this opportunity to express my profound gratitude to my supervisors Ron Boschma and Koen Frenken who introduced me to the exciting field of evolutionary economics and continuously challenged me to face the difficulties of interdisciplinary research; Martin Svensson Henning, whom I not only regard highly as a close colleague, but also as a friend; my friend and colleague Rik Wenting, with whom I shared my office in Utrecht but also many memorable coffee breaks, lunches and drinks outside of the office; the KRLP for providing many nocturnal treasure hunts within the classics of economics; Roderik Ponds, Sandra Vinciguerra, Roald Suurs and Mathijs de Vaan for greatly enhancing my time as a PhD student; Frank van Oort, among many other things, for helping me through the difficult start in a new discipline;
13
the department of human and economic geography in Lund, and in particular KarlJohan Lundquist and Lars-Olof Olander for their warm hospitality during my visits to Sweden and for allowing me to enjoy the wonders of Swedish datasets; the instructors, organisers and fellow participants of the marvellous courses provided by the DIME network of excellence, DRUID, ERSA and the Max Planck institute; Inge Neffke, Marco Capasso, Martijn Burger and many others within and beyond my own department for their helpful comments on working papers and drafts of individual chapters. Last, but certainly not least of all, I would like to express my appreciation to my family for their patience, in particular to my father, who never tired of engaging in lengthy discussions about my statistical concoctions.
14
CHAPTER 1 THEORIES AND CONCEPTS
1.1: Introduction Throughout history, people have exhibited a strong desire to live closely together. Undoubtedly, in earlier days, villages and cities fulfilled an important task in providing safety and shelter from the perils of nature. However, in order to satisfy the needs of its citizens, a city had to source food – and many other commodities – from places ever farther away. At the same time, although inhabitants might have found protection against dangers from outside the city, the dangers from within, such as crime and disease, increased as cities grew larger. Still, the growth of cities seems not to have come to an end. Modern-day megacities exceed sizes of ten million inhabitants. To sustain such cities, ever more ingenious ways had to be invented for addressing problems that are due to the concentration of enormous masses of people in one place. As an illustration, take modern-day New York City. For consumption, the citizens of New York depend on an immensely complex trading system that spans across the entire globe. The police force lists 37,838 police officers1, 2,230 garbage trucks collect 25,000 tons of refuse each day2, and 53,700 rodent exterminations are carried out on a yearly basis to maintain public hygiene.3 These figures illustrate the obvious disadvantages of cities the size of New York. Still, the fact that we live in ever-growing cities suggests there are even stronger advantages to big city life. The advantages and disadvantages associated with a high concentration of people and economic activity in one place are called agglomeration externalities. They are the main topic of this thesis. The concentration of people and economic activity in cities can emerge in different ways. Some cities are big because there is one large industry in the city. Good examples are Detroit and its automobile industry or, in the Netherlands, Eindhoven, home to the electronics multinational Philips. Other cities are large because a wide range of 1 2 3
2007 figures (NYC 2008a) 2008 figures (NYC 2008b) 2006 figures (NYC 2008c)
15
different industries has settled there. In the Netherlands, this characterises a city like Amsterdam or Utrecht. Internationally, vibrant cities like Paris, New York and London are not only visited by all sorts of tourists, but they also attract a large variety of industries. Over the past couple of decades, a large number of scholars have tried to analyse which kind of city represents the best environment for local firms. An important question in this research has been whether cities should diversify or specialise in one specific type of economic activity. However, even after having expended great research effort, there is still no clear answer to this question. A recent survey of 31 scientific articles by De Groot et al. (2009) shows a stunning divergence among empirical findings. In some studies, statistical analyses show beyond a reasonable doubt that the degree and type of local concentration of economic activity affect the performance of the industries in a city, whereas other studies cannot exclude the possibility that the association of economic performance with the local concentration of industries and people arises from merely random fluctuations. What is worse, local environments that are conducive to economic growth in one study can turn out to harm local industries in the next. De Groot and his co-authors attribute the contradictions in these findings to a number of factors. For example, the country in which cities are located seems to matter. Moreover, the time period under study, the research methodology used and the chosen control variables all make a difference. Other authors find that the industries under investigation are important factors as well. This suggests that the same city may spur economic developments in some situations, but slow them down in other ones. The influence of agglomeration externalities is therefore likely to depend on the context. In order to understand under what circumstances a specific type of city is the right location for a given industry, we must have some idea of how local environments shape the fortunes of firms. A phenomenon that is often suspected to be one of the mechanisms behind agglomeration externalities is the fact that people who live in the same city, in one way or the other, learn from each other. At this point, it is important to realise that learning is usually not an entirely individual activity. Although in principle, we can learn on our own – for example, by reading books or conducting experiments – a large part of what we know has been learned by interacting with other people. In fact, this interactive, or social, learning works best if people meet face-to-face. Obviously, it is easier to meet with someone that lives nearby than with someone who lives far away. Consequently, it is easiest to exchange knowledge with people who live in the same city. Moreover, new ideas will diffuse faster within a city than beyond the city’s boundaries. There are many reasons for this. For example, most people’s friends and acquaintances live relatively nearby, and as a consequence, social networks are often relatively local. In addition, when people start working in a new firm, they often take the knowledge they acquired in their old job with them. As people change jobs more often than they change the city in which they live, knowledge that diffuses this way is also most likely to remain within the same city. 16
If the exchange of ideas between citizens and firms in a city is an important factor in the existence of agglomeration externalities, differences in agglomeration externalities may, in fact, be connected to these processes of social learning. Therefore, if we want to make sense of the contradictory evidence we find in this body of research, a good place to start is to develop a fuller understanding of the differences in learning processes that take place in each industry. In particular, one piece of the agglomeration externalities puzzle may be found in theories that explain how technological progress and innovation differ in different industries. One of the things that theories of innovation and technological change teach us is that the creation of new knowledge is often a result of the combination of existing pieces of knowledge. This is what Schumpeter (1912) called neue Kombinationen, or new combinations. As an example, take the automobile. This invention did not fall from the sky. Rather, it consisted of two major building blocks, a coach and an engine. Both building blocks were already well developed in the late nineteenth century, and as such, the first automobiles can be regarded as a successful merger of the two. In fact, mixing technologies that were developed in different industries may be very productive. Although the kind of technology that is used in the production processes of firms is often specific to a given industry, problems that are encountered in one industry frequently have close analogues in the production processes of other industries. In general, however, employees that run into problems in one industry tend not to be well aware of solutions that are applied in other industries. Therefore, knowledge exchanges between employees of different industries may lead to hitherto unseen solutions by exploring new combinations of (parts of) the production processes of different industries. If proximity facilitates social learning, it is likely that in a city with many different industries, the diffusion of ideas across industries is stronger. With citizens that engage in a wide variety of economic activities, diversified cities can thus be considered as repositories of ideas. These ideas can be used as component parts in many, potentially valuable, new combinations. Returning to a previous example, most innovations are not as radical and pathbreaking as the first automobile. Rather, they involve small changes on an existing design with the goal of improving its functionality step-by-step. For instance, the basic design of the modern car was established in 1923, when Dodge introduced the all-steel, closed-body automobile (Utterback and Suárez 1993). After that, gradual changes led to more powerful engines, better transmissions, and all sorts of accessories, but they did not change the basic structure of the car in any fundamental way. This purposeful tinkering with an existing design gives rise to quite a different form of innovation compared to the, often serendipitous, new combinations. To develop incremental improvements, having access to a large variety of ideas is less important than being able to find expert knowledge. This professional expertise is more likely to be found in cities with a strong specialisation in the specific industry than in diversified cities. In these cities, the large number of firms and the employment opportunities they provide attract the ablest people in the field. 17
Considering these insights from scholars who study the economic aspects of innovation and technological change, specialised cities and diversified cities may play different roles in the economy. Specialised cities would seem to be particularly good at promoting incremental innovations in existing technologies, whereas diversified cities are more likely to develop new combinations that lead to radical changes in production processes and products. As in the example of the automobile industry, in many industries, periods of new combinations are followed by periods of tinkering, and both processes play an important role in sustaining technological progress. As a consequence, what constitutes the ideal city for an industry may well change over time. On second thought, it seems improbable that each new combination of ideas that may arise in a diversified city is equally likely to generate a valuable innovation. Similarly, for employees in fully-specialised environments, there is preciously little to be learned from each other, as everyone has the same knowledge more or less. As a matter of fact, according to research on business strategy, valuable new combinations are most likely to be produced by bringing together people who have different ideas but still share enough common ground to be able to communicate them effectively (Nooteboom 2000). At their extremes, diversity and specialisation are therefore likely to be of little value. It would be better to combine the ideas of people who work in different yet related fields. Accordingly, the ideal city would be a city that has both a large concentration and diversity of industries that somehow form a coherent unity in the sense that its firms engage in related activities. In the remainder of this thesis, the informal reasoning sketched above will be developed in a more rigorous way. A contribution to the existing literature is made by drawing on theories on innovation and technological change that were developed in the field of evolutionary economics to build a framework that links changes in agglomeration externalities to the development stages of industries. These theories also provide the starting point for quantifying technological relatedness across industries, thereby allowing us to go beyond the extremes of specialisation and diversity in local economies. The research goal of this thesis can thus be stated as follows: Research goal: Our overall research goal is to recast the concept of agglomeration externalities in a context of technological change and technological relatedness. This goal consists of two concrete objectives: 1. Developing and testing a framework that links differences in agglomeration externalities to different stages of an industry’s technological evolution. 2. Constructing a measure of technological relatedness for each pair of industries in the manufacturing economy and use this to arrive at – and quantify the impact of – concepts of “local related diversity” and “local related concentration”. In the following sections of this chapter, the main concepts and sources of inspiration of this thesis are discussed. In section 1.2, we will explore the historical roots of the most recent wave of research on agglomeration externalities and then describe the 18
different kinds of agglomeration externalities that are distinguished in the literature. A special emphasis is placed on the role of local knowledge creation and social learning. Section 1.3, discusses theories in the field of evolutionary economics that help explain how knowledge generation takes place in general. Next, in section 1.4, it is shown how these theories may be used to think about agglomeration externalities, and especially about how they may change from one context to the other. The final section contains an outline of the thesis and a detailed description of each of its chapters. 1.2: Agglomeration externalities The study of agglomeration externalities has a long history. At the end of the nineteenth century, one of the icons of economics, Alfred Marshall, dedicated Book IV of his magnum opus Principles of Economics entirely to the spatial organisation of economic activity. In this book, he argues that if firms in a specific industry choose to locate close to each other, they will benefit from each other’s proximity. This is generally seen as the earliest comprehensive writings on agglomeration externalities. Since then, progress has been made in the field of urban economics and regional science, both in a theoretical and an empirical sense. However, the concept of agglomeration externalities has never regained the eminence in economics that it had in the work of Marshall. A striking illustration of this is that nowadays, reprints of Principles of Economics come with the very Book IV omitted. In the 1970s and 1980s, a number of scholars made some first efforts to rigorously quantify agglomeration effects. Prime examples of work during this era include Sveikauskas (1975), Segal (1976), Moomaw (1981), Nakamura (1985) and Henderson (1986). The impact of this initial work has been fairly limited.4 However, only two years after the most recent of these five publications, Lucas’s (1988) article on endogenous growth theory would cast the concept of agglomeration externalities at the centre of economic debate and set the stage for a bourgeoning body of new literature. 1.2.1: Agglomeration externalities and endogenous growth theory Endogenous growth theory evolved as a response to an interesting conundrum in economics. Economics, as a discipline, started out in search of the Nature and Causes of the Wealth of Nations with the writings of Adam Smith. By the 1950s, the best available model of economic growth, the Solow-Swan model, in essence claimed that the only way an economy can sustain growth in the long-run is through technological progress. This amounted to a situation in which after almost two centuries of economic research, economists had solved the riddle that lay at the birth of their discipline by placing the engine of growth beyond the scope of economics and, thereby, “exogenising” the answer. The discomfort with this outcome is captured well in the opening paragraph of Kenneth Arrow’s classical article on the economic implications of learning-by-doing: 4
To date, there are a total of 233 articles that cite one of these five key papers. About two thirds of these citing articles are published in geography and planning journals.
19
“… a view of economic growth that depends so heavily on an exogenous variable, let alone one so difficult to measure as the quantity of knowledge, is hardly intellectually satisfactory.” (Arrow 1962, p. 155) Arrow, instead, viewed technological progress as a result of economic processes themselves. Firms, he argued, use the savings in the economy to constantly invest in new machines. When these new machines are installed in factories, workers are challenged to improve their understanding of the production process. In this way, investments in machinery trigger learning-by-doing efforts. Hence, skills and technology improve as a result of the economic forces of saving and investing. In other words, instead of assuming that the new production processes just wash up on the shores of the economy, Arrow posited that technological progress is the outcome of a learning process that is set into motion by investments in new generations of capital goods. In a later paper, Romer (1986) went a step further. In his view, the neo-classical assumption of decreasing marginal productivity was simply inadequate when human capital, or knowledge, is added as a production factor. With a considerable dose of irony, he stated: “If the marginal product of knowledge were truly diminishing, this would imply that Newton, Darwin, and their contemporaries mined the richest veins of ideas and that scientists now must sift through tailings and extract ideas from lowgrade ore.” (Romer 1986, p. 1020) In other words, no matter how large humanity’s knowledge may grow, the benefits of learning will never become insubstantial. Finally, in 1988, Lucas made the theoretical connection that would link these two articles to agglomeration externalities.5 According to Lucas, both Romer and Arrow – whether assuming the absence of diminishing returns to human capital, or the existence of learning-by-doing mechanisms – implicitly assumed that the nature of human capital is fundamentally different from the nature of physical capital. That is: “…human capital accumulation is a social activity, involving groups of people in a way that has no counterpart in the accumulation of physical capital.” (Lucas 1988, p. 19). Still, these assumptions are not fundamentally different in nature as compared to the exogenous technology parameter in the Solow-Swan models. They are all ad hoc building blocks that ensure the possibility of long-term economic growth. Lucas realised that if sustained economic growth depends on the existence of external effects 5
20
Fittingly, Lucas prepared the article that would lead to the so-called Marshall-Arrow-Romer externalities (see the description of localisation externalities in the next subsection) for the Marshall lectures in Cambridge.
to human capital, empirical evidence for such effects was needed in order to lend credibility to endogenous growth models. In what reads like an afterthought to the theories outlined in his article, Lucas muses about where one might look for such evidence. He suggests that the force that allows the economy to keep growing is the same force that keeps people and industries in such high-cost locations as cities: externalities to human capital. But these had been investigated for many years in the literature on agglomeration externalities! Paying ample tribute to the works of Jane Jacobs, Lucas argues that the prime role of cities in economic growth also makes them the perfect place for economists to dig up information about human capital externalities. After all: “What can people be paying Manhattan or downtown Chicago rents for, if not for being near other people?” (Lucas 1988, p. 39). It took economic geographers four years to take up the challenge posed by Lucas. Although Lucas’s article was already very well known,6 up until 1992, it was not once cited in conjunction with any of the five agglomeration papers mentioned above. The only exception was a paper called Growth in Cities by Glaeser and his colleagues. Unlike the earlier agglomeration papers, Growth in Cities placed a strong emphasis on local knowledge spillovers. The authors claimed that: “If geographical proximity facilitates transmission of ideas, then we should expect knowledge spillovers to be particularly important in cities. After all, intellectual breakthroughs must cross hallways and streets more easily than oceans and continents.” Emphasising the link to endogenous growth theories, they went on to add: “This paper uses a new data set on American cities and industries to test the new growth theories [by, among others, Romer and Lucas].” (Glaeser et al. 1992, p. 1127) In stark contrast to the earlier failure to respond to Lucas’s suggestions, there was suddenly an explosion of agglomeration papers, with Growth in Cities quickly serving as the nexus between the works of Lucas and Romer, on the one hand, and studies on agglomeration externalities, on the other hand.7
6 7
In 1992, the article had been cited already 161 times. To date, over 100 articles have been written that cite both Glaeser et al. (1992) and Lucas (1988). With currently 434 citations, this pivotal position enabled Growth in Cities to become one of the best cited papers in agglomeration externalities research.
21
Glaeser and his colleagues, however, did more than just link economic geography to endogenous growth theory. In their article, the authors not only assess the quantitative size of human capital externalities, but they also add a qualitative aspect to the concept of knowledge creation. Following the urban theorist Jane Jacobs, they argue that cities play an important role in social learning processes not just by bringing many people together but also by bringing together a wide variety of ideas. As in the example of the automobile, it is often this mixing of radically different ideas that leads to technological breakthroughs. In fact, these authors were the first to our knowledge to investigate how a city’s industrial diversity – as opposed to its size and the size of its industries – can give rise to agglomeration externalities. This constitutes a major step forward. Implicitly, the authors conceptualise knowledge not as a homogeneous mass but rather as a collection of ideas that can be categorised in qualitatively different fields. They then argue in a distinctly Schumpeterian manner that knowledge develops by creating new combinations of existing ideas. If, as Lucas suggested, human capital externalities that arise as a consequence of social learning can be studied by looking at developments in cities, then cities may also be able to teach us more about the qualitative aspects of knowledge creation. For this potential to materialize, we must study the composition of knowledge at the level of cities and apply theories of how local actors combine existing knowledge to generate new knowledge. As different industries use different knowledge to produce their products, one way to learn more about the local composition of knowledge is to investigate the industrial mix of a city. Because the creation of new knowledge, or learning, depends on which existing pieces of knowledge are combined, different local combinations of industries may yield different opportunities for local learning processes. In sum, by investigating how industries benefit from the presence of other industries, we can learn more about social learning processes. In particular, differences in agglomeration externalities from one context to another may shed light on the differences in the social learning processes that take place in these contexts. For example, the context may change as industries and plants mature. Moreover, which firms mutually benefit one another may depend on the technological relatedness between the industries in which the firms are situated. We will return to this in section 1.4. 1.2.2: Types of agglomeration externalities Having discussed the background of the recent revival of agglomeration externalities, we now turn to a description of the different kinds of agglomeration externalities that are distinguished in the literature. Agglomeration externalities are advantages or disadvantages that local firms draw from a concentration of economic actors and activities in their close vicinity. To formally constitute externalities, costs or benefits
22
must be experienced by one firm but caused by another firm, without the former receiving compensation from or paying compensation to the latter.8 Traditionally, agglomeration externalities were often thought to cut costs. Therefore, they are sometimes called agglomeration economies. Hoover (1937) distinguishes between three types of economies: economies internal to the firm, economies that are external to the firm, yet internal to the local industry – so-called localisation economies – and economies that are external to both the firm and the local industry but not to the city, which Hoover termed urbanisation economies. The first category of cost-savings are simply internal economies of scale that cannot be regarded as agglomeration externalities.9 Nowadays, aspects of cost reductions in agglomerations externalities are supplemented by recognising non-pecuniary aspects, i.e., the knowledge dimension, of agglomeration benefits. Knowledge externalities are, however, usually associated with a rise in productivity. To cover both increased productivity and reduced costs, the more general term agglomeration externalities is used throughout this thesis. In addition to Hoover’s categories of localisation and urbanisation externalities, since Glaeser et al. (1992), we have to add two more types of agglomeration externalities to the list: Porter and Jacobs externalities. Localisation externalities Localisation externalities were first discussed by Marshall, who noted that: “When an industry has thus chosen a locality for itself, it is likely to stay there for long: so great are the advantages which people following the same skilled trade get from near neighbourhood to one another.” (Marshall 1920, IV.X.7) Apparently, the tendency of firms in a single industry to cluster is very old. In fact, the explanations for this tendency given by most contemporary scholars are still based on the same three advantages that Marshall put forward to explain why people in the same skilled trade tend to live close together. The first explanation is labour market pooling. Industries generally are in need of a sufficient supply of specialised and highly-qualified labour. A strong concentration of firms in a specific industry is a prerequisite to grow and sustain the required large and specialised local workforce. The reason is that specialised labour is attracted to employment that is generated by this concentration, and in turn, firms are attracted to the pool of labour. Furthermore, a large local industry can afford to support and/ 8
9
The difficulty in this definition is that whether an agglomeration cost or benefit is termed an externality, depends on whether or not compensation has taken place. However, in general, agglomeration effects can be internalised by local actors and thereby lose their status of externalities. As the degree to which agglomeration effects are internalised is hard to assess in practice, most empirical studies treat agglomeration effects and agglomeration externalities as synonyms. This thesis is no exception, and the terms agglomeration externalities and agglomeration effects are used interchangeably. That is not to say that internal economies of scale may not give rise to a concentration of economic activity in one place (see Krugman 1991a).
23
or lobby for educational institutes that offer training programmes tailored to the needs of its firms.10 The large labour market also facilitates matching between employers and employees. Finally, the presence of a large number of local firms allows workers to change jobs without having to relocate. These workers can quickly learn the tricks of the trade by moving from one firm to another in a city. The second source of localisation externalities is the advantage of being close to client and supplier firms. Such firms are attracted in large numbers by concentrated industry in much the same way as specialised labour is. Geographical proximity to these firms decreases transport costs. Nowadays, however, costs of transportation have declined sharply, and the advantage of having different parts of the value chain in one city is probably derived more from reductions in the transaction costs of collaborative research efforts than from savings in transportation.11 Indeed, a large part of the innovation in final products is carried out by local suppliers of component parts (e.g. Cooke and Morgan 1998). Geographical proximity facilitates the face-to-face communication that is an integral part of these processes of co-development. The third source of localisation economies are localised knowledge spillovers. Marshall famously stated that in manufacturing districts, “the mysteries of the trade become no mysteries; but are as it were in the air” (Marshall 1920, IV.X.7). In fact, in the industrial districts literature, it is often argued that spatial proximity allows for greater knowledge spillovers between firms in the same industry (e.g. Dei Ottati 1994a). Whereas codified knowledge can easily travel hundreds of kilometres without losing much of its content, the tacit knowledge that is described by Polanyi (1967) is much more difficult to transmit without face-to-face interaction. Moreover, accidental encounters of people who are active in the same industry, partnerships with other firms in the industry and even espionage and imitation are generally assumed to occur more frequently if firms are located in the same city or region. At first sight, local knowledge spillovers seem to be the least tangible and, perhaps, the most speculative of the three mechanisms through which localisation externalities operate. It is, however, important to note that knowledge transfer also plays an important role in local labour market pooling and local input-output linkages. One of the reasons why well-developed local labour markets are valuable is that workers learn from their peers and from their employers. Similarly, the most important advantage of having strong relations with clients and suppliers is that it makes communication along the value chain easier. As a large proportion of knowledge that is exchanged in such collaborative efforts is typically tacit in nature, such exchanges are greatly 10 Such institutional arrangements are well described in the literature on Regional Innovation Systems. For example, Cooke and Morgan (1998) provide vivid illustrations of the vocational education system in the Basque country and its strong links to the machine tools industry. 11 A vast literature exists on the topic of trust and spatial proximity. According to this literature, spatial proximity lowers transaction costs when complete contracts are cumbersome or even impossible. A local culture of trust and networks with strong ties between local firms are important substitutes for complete contracts (e.g. Dei Ottati 1994a, 1994b).
24
facilitated by geographical proximity. Therefore, many authors take local knowledge transfer to be by far the most important aspect of localisation externalities. Jacobs externalities Jacobs externalities refer to the benefits local firms derive from being located in cities with many different industries. Jacobs (1969) illustrates the advantages of local diversity by comparing the mid-nineteenth century cities of Birmingham and Manchester. In those days, Manchester was a city with a vibrant economy. It was home to immense, state-of-the-art textiles factories. Birmingham, in contrast, had a relatively large number of small firms that produced goods in all kinds of different industries. By its contemporaries, Manchester was seen as the city of the future, whereas Birmingham seemed hopelessly outdated. However, in the 1960s, Birmingham and London were the only English cities that had remained prosperous, whereas the growth of Manchester had stagnated long before (Jacobs 1969, pp. 86-94). The lesson that can be drawn from this example is that, for cities to keep reinventing themselves, their industrial structure must be sufficiently diversified. Indeed, if one industry is so successful that it comes to dominate the local economy, in the long run, this initial good fortune may turn into a threat to the city as a whole: “… a very successful growth industry poses a crisis for a city. Everything – all other development work, all other processes of city growth, the fertile and creative inefficiency of the growth industry’s suppliers, the opportunities of able workers to break away, the inefficient but creative use of capital – can be sacrificed to the exigencies of the growth industry, which turns the city into a company town.” (Jacobs 1969, pp. 124-125) In Glaeser et al. (1992), the authors build on Jacobs’s work and stress that diversity in a local economy creates opportunities for the cross-fertilisation of ideas between firms in different industries. As a consequence, the term Jacobs externalities has acquired a rather limited and technical definition, as it refers to the benefits of local industrial diversity. Often the most diversified cities are also the most populous ones. This has led some authors to regard Jacobs externalities as one particular aspect of the advantages of locating in big cities. As these advantages are commonly referred to as urbanisation externalities, sometimes Jacobs externalities are treated as a particular type of urbanisation externalities (e.g. Combes 2000, Henderson 2003). However, for the purposes of clarity, in this thesis, Jacobs externalities refer to the effects of local diversity, while the term urbanisation externalities is reserved to indicate effects of the size of a city. We will discuss urbanisation externalities in more detail in the next subsection. In reality, the inter-industry knowledge spillovers Jacobs envisaged are hindered by communication problems among firms in different industries. The reason is that 25
knowledge and jargon may vary across industries. As a consequence, employees in different industries generally do not share sufficient professional background to be able to easily exchange ideas. In more technical terms, the cognitive distance (see e.g. Nooteboom 2000) between the parties involved is simply too large. Therefore, it is not surprising that some researchers find no evidence for the existence of Jacobs externalities. More puzzling, however, is the fact that sometimes even negative effects of local diversity are found. Combes (2000), for example, finds that many traditional manufacturing industries experience negative Jacobs effects. In their overview article, De Groot et al. (2009) find a negative coefficient in about half of the papers they investigate. At first sight, this is an odd finding, and so far, it has been understandably treated as a statistical artefact. However, we argue that in her discussion of company towns, Jacobs provides a clue as to why diversity may affect the performance of a local industry in a negative way. According to Jacobs, economic efficiency, i.e. the production of goods at the lowest possible costs, and economic development – adding new goods and services to the local economy – are fundamentally at odds with each other (Jacobs 1969, p. 103). The wide range of local suppliers and small firms in other industries interfere with the efficient operation of an industry that produces on a very large scale. As a consequence, one may observe that an industry that comes to dominate a city may, consciously or as a by-product of its own unbridled development, deny other industries an existence in the city. For example, Eastman Kodak robbed its home town, Rochester, of its industrial diversity. However, at the same time, the city was turned into a perfectly efficient company town for Kodak’s own activities (Jacobs 1969, pp. 97-98). Although Jacobs primarily stresses the downside of this process, it is clear that for the industry or company that dominates the city, the reduced local diversity is, in fact, beneficial. Not having to compete with other industries for the economic domination of a city is most likely an important advantage for industries that have a tendency to become strongly embedded in their local environment. For these industries, local diversity represents a potentially dangerous lack of focus, and consequently, a real possibility that their interests will be neglected by the region’s policy makers and supplier industries. In this light, it is not surprising that we sometimes find negative Jacobs externalities. The fact that Combes finds them in the traditional manufacturing industries is perfectly in line with this reasoning; more mature industries typically have had more time to become embedded in a region and are sufficiently standardised to allow a region’s productive structure to become adapted to its needs. We will discuss this in more detail in chapter 3. Urbanisation externalities Urbanisation externalities are advantages and disadvantages that are associated with the size of a city. The most obvious economic advantage of big cities is that they offer a large local market. Industries with high transport costs or with products that must be consumed where they are produced – which is the case for many service industries – benefit from locating close to this market. That big cities are often also 26
hubs in interregional and international transportation networks reinforces this effect. Moreover, in big cities, one also finds a high concentration of wealthy people who are keen on – and can afford to – try out the latest gadgets on the market. These lead users make large cities a perfect testing ground for newly-developed products. Another benefit of large cities is the availability of business and other types of services. In a Christallerian sense, big cities are central places of high order for both private and public services. Cities like New York, Tokyo and London offer access to worldrenowned financial institutions and, at the same time, to world-class universities and research facilities. These, in turn, attract and educate a highly skilled workforce. On the down side, large cities tend to be very crowded. Traffic jams, pollution and the stressfulness of big city life constitute important negative externalities. Moreover, land in cities is scarce, which elevates the costs of production. In fact, not only are office and workplace rents high, but wages must also be higher to compensate workers for their higher rents and longer commute. Porter externalities For reasons of completeness, we also mention a fourth type of externalities, although it will not be used in the remainder of this thesis: so-called Porter externalities. These externalities arise as a consequence of competition between local firms. In line with Porter (1998), Glaeser and his co-authors (Glaeser et al. 1992) claim that fierce local competition produces strong incentives to innovate. This disciplining in the home market is supposed to strengthen the competitive position of firms. However, in a regional or urban sense, the concept of local competition has only limited validity. A vast number of industries produce for the national or even international market. In such cases, local competition is limited to competition for local resources, most prominently for highly-skilled employees. Although this may strengthen human resource management capabilities, it hardly leads to a better positioning in (inter) national markets.12 Static versus dynamic externalities A distinction is sometimes made between static and dynamic externalities. To our knowledge, the distinction was first made in Glaeser et al. (1992). The authors argue that in contrast to static externalities: “…these theories [of dynamic externalities] have implications for growth rates of industries in cities. In this respect they are different from the more standard 12 Moreover, the intensity of competition is difficult to quantify. To measure the level of competition in the market of a firm’s output, one may look at profit margins or other indications of rent-seeking behaviour. Unfortunately, the data needed to create such indicators are rarely available. The effect of local competition in the market for production factors is even more problematic, as it is hard to separate from other effects. For example, wage premiums may be a sign of local competition for labour. On the other hand, they may simply indicate higher local skill levels. As we have no adequate solution for this problem, we make no attempts to incorporate the effects of local competition in our analyses.
27
location and urbanization externality theories that address the formation and specialization of cities (Henderson 1986) but not city growth.” (Glaeser et al. 1992, p. 1128) Henderson et al. (1995) defend the distinction on similar grounds, arguing that static externalities account for the effect of “immediate information spillovers,” while dynamic externalities stress the importance of “prior information accumulation in the local area” that lead to “local trade secrets” (p. 1068). Also these authors stress that dynamic externalities are important in explaining growth patterns. Therefore, the main characteristics of dynamic externalities seems to be that they set into motion a cumulative process of productivity improvement, which leads to sustained growth. A by-product of the distinction between static and dynamic externalities is the introduction of Marshall-Arrow-Romer (MAR) externalities in Glaeser et al. (1992). Firms derive MAR externalities from the high concentration of their industry in a city and these externalities can be regarded as a dynamic variant of localisation externalities. As a matter of fact, Glaeser and his co-authors capture the connection between the agglomeration externalities literature and the endogenous growth literature we discussed in section 1.2.1 precisely through this concept. However, the difference between static and dynamic externalities is not so patent. After all, circumstances that lead to the birth of a city may later on reinforce its growth. In fact, all three Marshallian externality sources give rise to self-reinforcing growth processes, and the notion of dynamic externalities is thus at least as old as Marshall’s work. If “dynamic” refers to the cumulative, self-reinforcing nature of agglomeration externalities, dynamic externalities have always been the standard, and so their distinction with static externalities hardly signifies a watershed moment in the literature. Henderson (1997, 2003) treats the distinction between dynamic and static effects as a relative one. He investigates the lag structure of coefficients of agglomeration externality variables. The longer a local industry experiences the effects of a variable, the more dynamic is the corresponding agglomeration externality. This, however, takes a different angle on the matter: short-lived effects can still be cumulative, whereas long-lived effects may not be self-reinforcing. Regardless, investigating lag structures of agglomeration effects is beyond the scope of our research. 1.2.3: The empirical state of the literature In this thesis, we investigate three types of externalities: localisation externalities, Jacobs externalities and urbanisation externalities. The perception of many authors in the field seems to be that the empirical evidence on agglomeration externalities is still inconclusive. In an overview article, Glaeser states: “For the moment, the role of concentration [i.e. of localization] and diversity does not seem to have been resolved by the literature. Different time periods 28
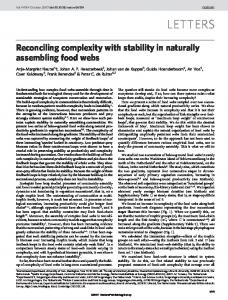
Localization
Diversity 0
10
20
30
Negative significant Negative insignificant
40
50
60
70
80
90
100%
Positive insignificant Positive significant
Figure 1.1: Overview of signs and significance of localisation and local diversity findings. Source: De Groot et al. (2009) and different samples give different results which suggests that there is no universal truth on this topic.” (Glaeser 2000, p. 92) Feldman (2000) discusses the agglomeration externalities literature as she reviews the evidence on the role of geographical proximity in innovation. She also concedes that clear-cut answers remain elusive. According to Feldman, findings on localisation and urbanisation externalities especially tend to vary. In a large-scale comparison, De Groot et al. (2009) review coefficients reported in 31 different studies. Figure 1.1 summarises the signs and statistical significance of all coefficients of localisation and local diversity effects the authors encountered. The divergence in empirical findings is striking. Both types of agglomeration externalities are positive about as often as they are negative. In a meta-analysis of the determinants of these signs and significance levels, the authors find that many different factors play a role. For example, the research strategy matters. The choice of the dependent variable, the controls that are added and the exact way agglomeration indices are constructed are all associated with significant differences in the signs and significance levels of parameter estimates. Moreover, sample issues are relevant: studies on Asian cities find different coefficients compared to studies on cities in the US, and the time period under investigation biases results as well. With so many factors influencing outcomes, definite conclusions can be expected to be hard to reach. Accordingly, Feldman concludes her review, stating that “we still have a limited understanding of the way in which knowledge spillovers occur and benefit innovative activity.” (Feldman 2000, p. 389) In fact, these research findings may be so puzzling because the intensity of knowledge spillovers and other mechanisms that cause agglomeration externalities may be context-dependent. A better understanding regarding when and which of these mechanisms operate most strongly – to which this thesis aims to contribute – is therefore crucial in coming to grips with the divergent empirical findings in the agglomeration externalities literature.
29
1.3: Evolutionary economics In order to understand why agglomeration externalities differ, we need to theorise about the underlying processes. We have already argued that we think that innovation and knowledge creation are important aspects of these processes. However, in the theoretical urban economics literature, a number of alternative explanations have been put forward in the framework of rational choice. Before we move on to theories of innovation and technological change, we first discuss the relative merits of this approach. 1.3.1: Choosing versus learning Externality-generating mechanisms are exhaustively discussed from a rational choice perspective by Duranton and Puga (2004). The authors’ goal is to provide microfoundations for urban agglomeration externalities. In other words, they attempt to develop models in which the concentration of economic activity arises out of strategic choices of firms and workers. The authors distinguish between three types of mechanisms that seem to play an important role in urban economics: sharing, matching and learning. Sharing refers to the fact that some assets that can only be produced by pooling a sufficiently large number of people in one city can be shared among all inhabitants of that city. These assets can take very different shapes. Amenities are one example. For instance, constructing a library involves high fixed costs, but once built, it can be shared by a large number of people. However, also more abstract assets – like variety, risk, and the fruits of specialisation – can be shared. For instance, the fact that all inhabitants of a city benefit from the availability of a large diversity in locally produced goods, as formalised in Dixit-Stiglitz utility functions (Dixit and Stiglitz 1977), serves as a micro-foundation for externalities in consumption. Analogously, it is possible to show that if monopolistically competitive supplier markets are combined with DixitStiglitz-type production functions, large diversity in locally available intermediates gives rise to agglomeration externalities for the final goods producers in a city (e.g. Fujita 1988). Matching mechanisms build on the assumption that there is some kind of heterogeneity in the employees and firms of a city. If workers are not all the same and if different firms have different labour requirements, then establishing employment relations involves search costs and, occasionally, expensive mismatches. The same argument holds for finding adequate suppliers. Matching provides a micro-foundation for agglomeration externalities insofar as associated costs decrease with the number of economic actors that undertake matching efforts. The final agglomeration mechanism Duranton and Puga distinguish is learning. The existence of local learning processes was already noted by Marshall (1920). People who live close to each other exchange ideas and, in the process, create new knowledge. However, the authors concede that little progress has been made in terms of learning micro-foundations. In fact, only two types of models have been developed, neither of which is satisfactory. The first type simply assumes that learning opportunities 30
are more numerous in cities and then shows that firms and people will flock to cities to take advantage of these opportunities. The nursery cities model we build on in chapter 5 is a good example of this type. The second type of learning models is not concerned so much with creating new knowledge but rather with the strategic choices in the diffusion of information. For instance, herding models – in which firms try to elicit information of other firms by observing their choices – can explain some of the benefits of local concentration. However, according to Duranton and Puga, as yet no models exist that micro-found the externalities in knowledge creation. A reason why it is so difficult to find micro-foundations for learning dynamics may be that micro-foundations in economics are always choice-based. Micro-foundations seek to explain how certain macro-structures, such as agglomeration externalities for example, arise as the outcome of choices made at the micro level. However, although we may consciously choose to interact in order to learn from each other, the knowledge we acquire from this interaction is not determined by this choice. Rather, it depends on, for instance, the distribution of prior knowledge across the involved actors, the way in which these actors interact and interpret what others try to communicate, and the constraints given by the space of technological opportunity.13 Bluntly put, although we may be able to learn how, say, nuclear fusion works, more is needed than us simply choosing to learn it.14 The question of how knowledge is generated is often considered to lie outside the scope of economics as a discipline. To be sure, the economic mainstream has celebrated many successes with regards to the incorporation of aspects of knowledge into its theories. As in the urban economics literature, however, this progress has been 13 Teece et al. (1997) discuss some interesting aspects of learning that make it not amenable to individual choice frameworks. Most importantly, the authors point out the social dimension of learning “Learning processes are intrinsically social and collective and occur not only through the imitation and emulation of individuals, as with teacher-student or master-apprentice, but also because of joint contributions to the understanding of complex problems.” (p. 520) And, earlier on in the article, they discuss organisational aspects of promoting learning:
“Indeed, the essence of internal organization is that it is the domain of unleveraged or low-powered incentives. By unleveraged, we mean that rewards are determined at the group or organization level, not primarily at the individual level, in an effort to encourage team behavior, not individual behavior.” (p. 517)
Such social aspects are difficult to incorporate in the micro-foundations agenda, which takes actions and goals to be individual and in which other actors only enter the equation in terms of strategic opponents. 14 An important aspect of knowledge is that it is actually not a shapeless mass of interchangeable ideas, as often implicitly assumed in economic models. Rather, ideas are connected to each other and make up fields of knowledge. It is this basic conviction that underlies the work on technological relatedness in chapter 4. One part of learning may in fact be the rewiring of these connections, as in Schumpeter’s new combinations.
31
limited almost exclusively to the strategic choices that surround knowledge. On the one hand, we have seen the extension of game theory to cover situations involving incomplete and asymmetric information. Yet, information and knowledge are different concepts, certainly in the context of learning. Information can be easily transmitted, whereas knowledge can usually only be passed on imperfectly and through repeated contacts in an interpretative framework. On the other hand, progress in endogenous growth theory has been made by modelling the investment decisions in private sector Research and Development (R&D). In this literature, R&D investments enter a stochastic production process that generates “knowledge” as an output. Again, these models only tell us something about how choices are made regarding knowledge, not about how knowledge is actually created. The focus on (rational) choice is, in fact, paradigmatic in economics. According to Nobel prize laureate Douglas North, “economics is a theory of choice” (North 2005, p. 11). This view is shared by many in the discipline. The preference for a strategic choice framework to explain agglomeration externalities – and human capital externalities in general – indeed seems to be rooted in the unyieldingness of learning to a rational choice framework. For example, in his groundbreaking work on increasing returns in economic geography, Krugman (1991b) explains that one of the merits of his model is that it does not involve any speculations about knowledge creation: “What is particularly nice about this result [the fact that a process of circular causation can lead to concentration of economic activity in one place] is that it requires no appeal to elusive concepts such as pure technological externalities: the externalities are pecuniary, arising from the desirability of selling to and buying from a region in which other producers are concentrated.” In other words, it is to be preferred to reason about agglomeration tendencies as arising from the choices made by consumers and producers compared to explanations in which social learning gives rise to technological progress. The unwillingness to rely on knowledge spillovers as a main mechanism for agglomeration externalities is also expressed by other authors. A particularly apt example can be found in Acemoglu (1996): “Although part of the human capital externalities is undoubtedly technological, assuming that this is the only form of interaction is unsatisfactory.” (Acemoglu 1996, pp. 781-782) One of the main arguments the author gives for why models should avoid placing too much emphasis on learning externalities – that is, “the black box interpretation of these [i.e. human capital] externalities” (p. 782) – echoes Krugman’s uneasiness with technological externalities. However, neither Krugman’s nor Acemoglu’s motives to downplay technological externalities are based on evidence that technology and knowledge dynamics are empirically irrelevant. In fact, the empirical basis of the 32
micro-foundations Acemoglu puts forward himself is questionable at best.15 This lack of an empirical underpinning contrasts starkly with the ample proof that has been found for the existence of knowledge spillovers (e.g. Jaffe et al. 1993; Audretsch and Feldman 1996a; Breschi and Lissoni 2003). More fundamentally, the economic profession has embraced the idea that sustained economic growth is only possible due to technological progress. This was one of the major insights of endogenous growth theory,16 which formalises the idea as human capital externalities. Yet, the notion that localised human capital as a source of local economic growth is predominantly technological in nature is still vigorously resisted. As exemplified above, the reason authors most frequently put forward to shun knowledge-based externality explanations is that the underlying concepts are considered to be “elusive” and to constitute a “black box.” We do not deny that this is indeed problematic; this thesis will likewise not pretend to provide any micro-foundations, whether choice- or learningbased, for knowledge creation. Nevertheless, in our opinion, the solution cannot simply be to ignore the empirical reality of knowledge spillovers in agglomerations. Rather, new tools should be developed to investigate this phenomenon in detail. Only then can a greater understanding be reached about the micro-interactions that give rise to social learning processes. A branch of economics that may offer such tools is evolutionary economics. Although it consists of a broad variety of approaches ranging from historical descriptions of institutional change to studies that strictly adhere to the Darwinian framework of mutation, inheritance and selection, evolutionary economics hosts a large number of scholars that engage more broadly in the study of innovation and technological change. Many of the key concepts have been outlined in the book by Nelson and Winter (1982) that has acquired an almost canonical status in the field. However, the most important sources for this thesis are writings of Jane Jacobs and the business scholar Edith Penrose and the work of a large group of scholars on the industry life cycle concept. Although these contributions are not always classified as evolutionary economics per se, they fit comfortably with the broader beliefs in this field. In fact, Jacobs and Penrose can be considered to be progenitors of the evolutionary paradigm, whereas research on industry life cycles draws substantially on evolutionary economic concepts.
15 The model critically depends on the notion that how much workers invest in their human capital depends on their expectations regarding how much firms invest in physical capital and vice versa. However, clearly, important human capital investments of workers take place at an early age, long before ideas about a professional career crystallise. It is therefore doubtful that such investments reflect any expectations of investments by future employers. 16 See section 1.2.1.
33
1.3.2: Edith Penrose: economic development as a branching process Penrose (1959) depicts the firm first and foremost as an entity with a capacity for growth. This is at odds with the standard view of the firm as the embodiment of a production function. In the production function view of the firm, growth is always elicited by events that are external to the firm. According to this perspective, an exogenous positive demand shock, the failure of a competitor, or the fall of production costs may all lead the firm to adopt a higher level of output. Internal adaptation to these new production levels is frictionless. The new output merely reflects the outcome of a rational choice of the firm to maximise its profits under the new situation that has arisen. In the work by Penrose, however, the firm is not depicted as a production function, but rather as a bundle of resources that are employed by a single organisational entity. She makes a crucial distinction between resources, such as capital and labour, and the services these resources provide. For example, a power generator is a resource that sets large conveyer belts into motion as a service. An engineer is a resource offering the maintenance of machinery as a service. The most important differences between a resource and the service it offers are that (1) a resource typically can be used to generate a number of alternative services, and (2) the longer a firm uses a resource, the more services accrue from it. An engineer for example, can work in maintenance, in product design, or help out in the warehouse moving supplies. In general, the more he works on a specific task, the better he knows how to perform it. Physical capital may also have more than one use. A computer can perform complex calculations to assess the aerodynamic properties of a car, or it can just be used for word processing. As is the case for human capital, the services of physical capital also increase with use as ever more details about its characteristics and qualities come to light. We already encountered this learning-by-doing mechanism in the work by Arrow (1962) in section 1.2.1. As a firm learns more about its resources, it may come across uses that do not interfere with existing production processes. In this way, ever more productive services are freed up. In addition, because the resource has already been paid for, these services are also free in a pecuniary sense. Production of two different products by one firm is in this case cheaper than the separate production of the products in different firms. The cost savings that arise when products are produced in combination are commonly referred to as economies of scope. Firms will constantly search for ways to put free productive services to use. In many cases, these services are more valuable in the production of products that are not yet produced by the firm. Therefore, Penrose argues, the free productive services are a fundamental, internally generated incentive for firms to diversify their production.17
17 Teece (1982) rightly points out that a firm may also choose to sell or lease out the free productive service. However, in practice, markets for these services are very thin or non-existent.
34
Accordingly, firms grow by expanding into fields in which their free productive services yield the highest returns.18 If we think through this reasoning, the economy can be pictured as a collection of firms that grow by branching out to products that can absorb their free productive resources. At any point in time, firms will typically produce a portfolio of products that are related in the sense that the resources they require for productive services overlap.19 Accordingly, there is a relatedness structure inherent in the set of productive services that resources provide, and this structure manifests itself in the portfolios of firms.20 1.3.3: The Industry Life Cycle and the exploration-exploitation dichotomy The Product Life Cycle (PLC) or Industry Life Cycle (ILC)21 concept has been developed by scholars working in a great variety of fields, most prominently including the fields of marketing (e.g. Cox 1967), industrial organisation (e.g. Jovanovic and MacDonald 1994; Klepper 1996), innovation and technological change (Abernathy and Utterback 1978; Klepper 1997) and international trade (e.g. Vernon 1966; Hirsch 1967). Industrial development is described as an evolution across stylised stages and most accounts of the ILC have the same basic structure in common. Right after the birth of an industry, there are stages with strong entry into the new industry. These are followed by a period of net outflow of firms known as the shake-out, which ultimately leads to an oligopoly. Exactly what causes the shake-out is subject to some debate. In Klepper (1996), it is attributed to economies of scale that arise as a consequence of fixed R&D costs. Jovanovic and MacDonald (1994) relate the shake-out to exogenous inventions that are developed outside an industry. Firms that adopt such inventions in order to refine the production process can upscale their production. Firms that lag behind in the adoption of the new production technology are pushed out of the market. With regards to this thesis, however, Utterback and Suárez’s (1993) account is most interesting. According to these authors, after extensive experimentation with different approaches, a number of successful elements are combined in a dominant design (Abernathy and Utterback 1978), which becomes the de facto standard for the industry. This dominant design substantially reduces the uncertainties in a given industry. Producers start 18 Such a growth process cannot be easily expressed in terms of production functions as it involves an endogenous merger of two production processes. In principle, production functions can be multidimensional. However, the growth process described here would still not be modelled. 19 Obviously, firms make mistakes or expand into relatively unrelated products for other reasons. The difficulties involved in keeping abreast of competition in a multitude of fields, however, increase the more different these fields are. Therefore, firms will try to keep their portfolio structured around some broad field of expertise (both in technology, and in sales) that is shared by all or most products. 20 This idea is used in chapter 4. 21 The part of this section that is concerned with the ILC draws heavily on Utterback and Suárez (1993) and Klepper (1997). Both studies offer a good overview of the ILC literature. The aim here is to familiarise the reader with the most important logics behind the ILC. For a more thorough description, we refer to the texts mentioned above.
35
building on well-defined components that can be ordered from suppliers according to some standard specifications. Consumers know what to expect from the product and products complementary to it adjust to the common standards. As a result, both the supply and the demand side of the market reach a point at which mass production is possible. The ILC literature uses detailed datasets that cover the entire industrial history of a number of well-defined products (e.g. Gort and Klepper 1982, Utterback and Suárez 1993, Agarwal and Gort 1996, Klepper 1996). Statistical agencies often collect data for the entire economy but on a more aggregated level. In these datasets, industries produce a bundle of products. Each product in this bundle may go through an ILC of its own. At the same time, even single products can experience phases of rejuvenation when unexpected radical innovations shake up the industry. As a result deviations from the ILC have been observed for a number of products.22 Moreover, standard datasets cover only a part of most industries’ development. The structured collection of data only began after many industries were already born. Moreover, new industries usually only enter official statistics after they have grown sufficiently large to obtain a classification code of their own. As a consequence, it is hard to study the successive developments proposed in the ILC literature using such datasets. However, the ILC literature is not limited to the description of the sequential evolution of the market structure of an industry. Each development stage is also linked to a number of industry characteristics. Most of these characteristics change when an industry adopts a dominant design. As we do not collect our own data in this thesis but use secondary datasets with their above-mentioned shortcomings, we especially draw on this portion of the ILC literature. The most important aspects in which changes occur involve (1) the nature and intensity of innovation processes that characterise an industry, (2) the nature of the competitive game among firms, (3) the production process within the industry’s plants, (4) the development of the market and (5) the barriers to entry. Along all these dimensions, changes occur when an industry produces a dominant design and subsequently goes through a shake-out period. In the formative stages of an industry before the introduction of a dominant design, producers experiment with a number of different product designs and much is still unknown about the production process. Given the novelty of the technology, opportunities for successful innovations are numerous, and innovation intensity is high. Many innovations are radical in nature. Research carried out by firms focuses more on quality improvement than on cost reduction. Firms use the qualitative differences between their products to set themselves apart from the rest of the industry. They compete for customers on the basis of the claim that theirs is the superior product. Within plants, the production process is flexible so as to swiftly accommodate design changes. Highly qualified personnel produces small batches of 22 For example, the laser industry did not experience any shake-outs. In this industry, a large number of firms remain active, each catering the needs of its own particular sub-market (Buenstorf 2007).
36
products. This small-scale production and uncertainty about the ultimate standards on the market give new firms ample opportunity to enter the market, which, at this stage, consists mostly of early adopters that can afford highly innovative, expensive products. After the introduction of a dominant design, the production processes and the ways in which the product is used by consumers are better understood. Production processes, and the machinery and skills involved, are standardised. The intensity of innovation drops and settles on a technological trajectory, as described in Dosi (1982). Incremental process innovations that require little rearrangement in terms of firm operations predominate. Standardisation allows firms to reap the benefits of scale economies. These lead to a drop in prices that enlarges the customer base dramatically. The higher is the number of established firms that upscale their production, the more rapidly the window of opportunity to enter the industry closes. Firms engage in a price war over the market of the, to a large extent, homogeneous product. This results in an oligopoly structure dominated by a few large firms. In sum, the dominant design gives rise to a shake-out that marks the end of an episode of (1) intense, radical product innovation, (2) monopolistic competition by small firms on qualitative aspects of their products, (3) small-scale production for (4) a market of early adopters with (5) low barriers to entry. After the introduction of a dominant design, innovation intensity drops, price competition predominates, and large-scale production for mass markets leaves room for only a few main players. An issue related to the ILC literature is the exploration-exploitation dichotomy in business strategy studies. According to March: “Exploration includes things captured by terms such as search, variation, risk taking, experimentation, play, flexibility, discovery, innovation. Exploitation includes such things as refinement, choice, production, efficiency, selection, implementation, execution.” (March 1991, p. 71) The reader will notice that the concept of exploration fits best with our description of the volatile young stages of an industry, whereas exploitation activities will predominate in more mature industries. As discussed by Nooteboom (2000), exploration and exploitation are hard to combine within one and the same organisational structure. The flexibility and room for error that are needed to successfully explore new opportunities demand a certain level of organisational slack that can obstruct a fully efficient exploitation of existing technologies and routines. Relatedly, Jacobs (1969) argues that efficiency is fundamentally at odds with economic development, that is, with the exploration of new technologies and products. In a similar vein, Grabher’s (1993) narrative about the German Ruhr area shows how the tension between adaptability and adaptation may lead old industrial regions to become stuck in declining industries due to various types of lock-in. 37
A way to overcome the problem of combining exploration and exploitation in one firm is presented in the cycle of discovery (Nooteboom 2000). The solution relies on repeatedly isolating and integrating exploratory activities in the main, exploitation activities of the firm. The organisational and institutional environment that is needed for successful exploration cannot be provided by the routinised setting required for efficient production. Therefore, at first, generally new firms or business units take care of the exploration of new technologies and products. Later on, when the technology has matured enough to be standardised, these activities are reincorporated or merged into incumbent firms.23 The main difference between the ILC account and the exploration-exploitation dichotomy is the level of analysis. The ILC describes the evolution of an industry, whereas exploration and exploitation are primarily related to the innovation processes at the firm level. However, the distinction between exploration and exploitation closely mirrors the distinction between radical and incremental innovation processes. As such, it can be seen as one particular aspect of the shifts that occur as industries mature. 1.3.4: Jane Jacobs: the primacy of cities and adding new work to old In the two subsections above, geography played no role of importance. That is, diversification and industrial development take place in “the economy” without reference to a specific location. We now turn to the final source of innovation and technological change on which this thesis draws. Here, location is the protagonist. In Jacobs’s The Economy of Cities (1969), the city is the locus of economic development. An important advantage of living in a city is that the concentration of people in one place allows inhabitants to organise their activities with a high degree division of labour. Division of labour is traditionally believed to increase efficiency because it enables people and firms to specialise in specific tasks at which they then can become especially skilled. However, Jacobs argues that greater specialisation is not the most important advantage of division of labour. Rather, the greatest contribution of division of labour to the economy is that it gives rise to opportunities for innovation. “It [division of labour] prepares the way, it provides the special footholds, for adding new goods and services into economic life. […] Seen as the source of new work, division of labour becomes something infinitely more useful than Adam Smith suggested when he limited its function to the efficient rationalization of work.” (Jacobs 1969, pp. 83-84)
23 Occasionally, these efforts to transplant new technologies into the existing production and marketing structure of a firm in fact give rise to new discoveries that open up opportunities for exploration. This is the cyclical aspect of the cycle of discovery.
38
By rearranging existing modules in the division of labour and adding something new, new products and services emerge.24 The deeper the division of labour a city can generate, the more opportunities there are to innovate by “adding new work to old” (Jacobs 1969, pp. 59-63). Jacobs gives many examples of industries that originated in cities in which entrepreneurs drew on the existing divisions of labour and then added a new ingredient. One of her most famous examples is the birth of the brassiere industry. The first brassiere was made in New York by a local custom seamstress who was dissatisfied with the way her dresses fit on her customers. Her new product turned out to meet a strong demand, and she rapidly expanded production. Local suppliers and local services played a major part in her success. Intermediates, sales, transportation, and administration services could all be sourced locally. Only because she had access to the myriad divisions of labour that existed in New York could she easily add her new activity to the existing activities in the city. Interestingly, brassieres were not invented by a lingerie producer, but rather they were developed to solve problems encountered in dress-making. Many other industries tell a similar story. 3M emerged as a chemicals giant from a mining company that intended to make sand paper but ended up with adhesive tape instead. Equipment-leasing originated in San Francisco when a food processor could not finance the equipment he needed for expansion.25 Jacobs offers a complementary vision of the branching process of diversification to the one we already encountered in Penrose. Both stress the relatedness of new activities to existing activities. However, there are some differences. Penrose is concerned with diversification at the level of the firm, whereas Jacobs discusses diversification at the level of the city, or even at the level of the economy. However, firms are located in cities, and therefore, diversification processes at the firm level are reflected in analogous processes in cities (Frenken and Boschma 2007). Also, in Penrose, the direction of diversification is suggested by free productive services in already acquired resources. In Jacobs’s account, in contrast, problems encountered in one industry suggest solutions that develop into entire industries. Nevertheless, both accounts stress the fact that new activities are rooted in old activities and that growth must be understood as branching out from existing products to (technologically) nearby new products. Another interesting insight in Jacobs’s analysis is the importance of diversity. According to Jacobs, a city’s size and diversity are its prime sources for the creation of novelty: “The greater the sheer numbers and varieties of divisions of labor already achieved in an economy, the greater the economy’s inherent capacity for
24 This is just another version of the Schumpeterian notion that innovations are new combinations of existing ideas. 25 For a full description of these and other examples, see Jacobs (1969, pp. 51-63).
39
adding still more kinds of goods and services. Also the possibilities increase for combining the existing divisions of labor in new ways…” (Jacobs 1969, p. 59). The “raw materials” for new combinations are more numerous in cities with a diversified economic structure than in specialised cities. It is this aspect of Jacobs’s work that Glaeser et al. (1992) picked up in their analysis of agglomeration externalities. 1.4: Technological change and agglomeration externalities Having concluded our discussion of agglomeration externalities and theories of technological change, we now clarify how we will combine features of both branches of literature in the remainder of this thesis. We first focus on the implications of technological change for the strength of agglomeration externalities. Next, we discuss how the concept of cognitive distance encourages us to think about the externalities that are generated by firms in related industries. We argue that Penrose’s branching logic of firm diversification paths can be used to assess technological relatedness between industries. As discussed before, in the empirical literature on agglomeration externalities, various authors have acknowledged that agglomeration externalities may vary across industries. A common theme is the distinction between young and old, or hightech and low-tech industries. For example, Henderson et al. (1995) find that Jacobs externalities are important to attract new, high-tech industries to a city, whereas localisation externalities particularly help to retain them. This finding anticipates the link we are about to make between the ILC and agglomeration externalities. According to the ILC view of industry evolution, young industries and mature industries differ substantially from one another with respect to the type of innovations they bring forth as well as with regards to the type of competition in which firms engage. Young industries are based on infant technologies that are surrounded by uncertainty. Production batches are small, and radical innovations are of utmost importance. Under these conditions, firms are – and must be – flexible. They must be receptive to new ideas originating from a variety of sources, typically from outside the firm’s industry, and be able to incorporate them quickly into their organisations. This suggests that industries are most open to the inter-industry knowledge spillovers associated with Jacobs externalities when they are still young. In terms of competition, the qualitative aspects of products are more important than the price. Production batches are small, while design is still experimental. Much remains to be learned about what customers look for in the product, and finding lead users is an important aspect of the development process. These lead users are often wealthy early adopters, typically found in large, expensive cities. Young industries should therefore thrive in the highcost environments associated with high levels of urbanisation. Mature industries are in many respects quite the opposite of young industries. Their production technologies are refined and highly standardised. Improvements must be 40
of a cumulative, non-disruptive nature; otherwise, they cannot be incorporated into the fine-tuned production processes. Knowledge spillovers should therefore have a highly specialised nature, as in the case of intra-industry localisation externalities. Furthermore, mature industries have long settled down on a dominant design. Products are far more homogenous than in young industries, and firms compete on the basis of price. In general, expensive locations thus make firms in mature industries uncompetitive. However, mature industries also need large markets as an outlet for their mass-produced products. Therefore, big cities also offer some advantages both because of the size of their local market and because of their access to national and international infrastructure grids. Finally, because of their maturity, industries that approach the end of their life-cycle may have developed strong network relations with local suppliers and business services as well as with the local government. Therefore, to firms in mature industries that have difficulties becoming embedded in their region because they constantly have to compete for the attention of other local actors with firms in other industries, local diversity can become a liability. In sum, both young and mature industries are in principle attracted to big cities, but whereas high-cost locations deter mature industries, these same locations may attract firms in young industries. Moreover, the impact of other agglomeration externalities besides urbanisation externalities should also shift as an industry matures. In particular, moving from young to mature industries, Jacobs externalities should drop, and localisation externalities should rise. We develop and test these conjectures in more detail in chapter 3. This link between the ILC and agglomeration externalities has to our knowledge never been tested as explicitly as suggested above. The article that comes closest is a study by Audretsch and Feldman (1996b) that invokes the ILC in an analysis of local knowledge spillovers. The authors first group all industries in the United States according to their stage in the ILC. Next, they investigate how a number of characteristics of each industry – national R&D expenditures, the amount of related research conducted at universities, and the share of skilled employees in the workforce – affect the tendency of innovation activities in the industry to cluster geographically. It turns out that all three variables above show different effects for industries in different life cycle stages. In general terms, this paper shares our intuition that the ILC affects the innovation processes and knowledge spillovers that take place at the local level. However, our theoretical frameworks and the empirical implementations are quite different. Most importantly, we distinguish between different types of agglomeration externalities and measure their impacts on the performance of a local industry. Audretsch and Feldman, in contrast, look at different knowledge inputs and their effect on the overall spatial clustering of innovation in an industry. The ILC is a useful concept when thinking about local industries. If we move from the industry level to the plant level, however, the exploration-exploitation framework is more suitable. This framework relates to the notion of maturity as well. However, in 41
contrast to the industry perspective of the ILC, it helps us to think about the nature of innovation in firms and plants of different levels of maturity. In a model developed by Duranton and Puga (2001), new firms first must search for a suitable technology to produce their products. As such, young firms are typically involved in exploration activities. In the model, firms can imitate the production processes used in any of the local industries in their city. Exploration is therefore best conducted in diversified cities. Because the available production processes in diversified cities are more numerous, firms are even willing to bear the congestion costs that the many other industries in these cities impose on them. However, as soon as they are satisfied with their production process, firms can start exploiting the technology by up-scaling their production. Yet, without the advantages in terms of search processes, there are now only disadvantages to sharing a city with other industries. In contrast, localisation externalities make locating close to other firms in the same city an attractive option. At this point, firms would therefore be better off in specialised cities. This reasoning is put to test in chapter 5. Until now, we have assumed that any kind of local diversity will spur radical innovations. Similarly, we have suggested that firms are most likely to produce incremental innovations by learning from firms in their own industry. However, in the description of Jacobs externalities in section 1.2.2, we noted that if the cognitive distance between people becomes too large, communication breaks down, and no learning is to be expected. Therefore, local diversity per se will not always lead to successful new combinations, as people with very different professional backgrounds may have a hard time engaging in fruitful discussions about the technological challenges in their respective industries. People working in related industries, in contrast, might find it easier to find inspiration in each other’s technological approaches. Although the innovations that come out of such interactions may not be as path-breaking as those that result from interactions between people in unrelated industries, they are more likely to arise from the outset. The intra-industry knowledge spillovers of localisation externalities are plagued by the opposite problem. People working in the same industry may simply think too much alike, so little can be learned from exchanging views. By contrast, engaging in a discussion with people from firms in related industries should add a spark of novelty. A concentration of related industries might therefore be more important to a local firm than the localisation effects generated by firms in one’s own industry. In sum, the concentration and diversity of related industries may generate important agglomeration externalities. In fact, related industry concentration and diversity might strike a better balance between novelty and cognitive proximity than pure diversity or pure localisation. To investigate this further, we must assess the extent to which industries are related to each other. At this point, Penrose’s insight that firms diversify in order to put free productive services of existing resources to use proves to be very helpful. At the plant level, the reasons for diversification most likely have a technological nature. 42
Free productive resources in plants probably derive from manpower and machines that either are idle or can be employed more productively. To be able to use these free resources to produce products in another industry, the production processes of both industries must have something in common. Consequently, if a plant produces products that belong to different industries, the main reason for such production is likely that the skills and the technology (as embodied in machinery) that are used in these industries are similar. Product portfolios of plants, therefore, provide a unique window on technological relatedness between industries. In chapter 4, we develop statistical tools to convert the information in a large sample of product portfolios of Swedish plants into a manufacturing-wide relatedness matrix. Subsequently, in chapter 5, we use this matrix to measure the local concentration and diversity of related industries for a sample of manufacturing plants in Sweden in order to test their impacts on the survival performance of these plants. 1.5: Outline of the thesis The remainder of this thesis consists of five chapters. In the first four chapters, we further develop and test the arguments in the previous section. All four chapters are based on working papers. Three of these have been collaborative efforts, whereas one working paper is single authored. The final chapter summarises the findings and discusses the directions for future research that have emerged. Chapter 2 This chapter begins with an extensive discussion of the use of employment-based regression analyses to investigate agglomeration externalities as well as reflects on the results of some of the most prominent papers in this tradition. A possible shortcoming in all these papers is that they implicitly assume that agglomeration effects are stable over sometimes very long periods of time. It is this assumption that is challenged at the end of the chapter. To explain the existence and growth of cities, agglomeration externalities must have existed throughout the history of mankind. However, that is not to say that the effects of agglomeration externalities have not changed in any way. In particular, over the past two centuries, major changes in transportation and communication technologies have occurred that may have altered the effects of the local environment on industrial performance. In the second half of the chapter, we therefore pose the following research question: Research question chapter 2: Are agglomeration externalities constant across time periods? To answer this question, we investigate historical census data on counties in the United Kingdom between 1841 and 1971.26 We focus on seven industries for which we can follow the development of employment throughout the entire sample period. 26 Additional information about the choice of data and a description thereof can be found in Appendix 1.A.
43
For these industries, we estimate localisation, Jacobs and urbanisation externalities. The main contribution lies in the fact that we allow the estimated parameters to vary over time. Regression analyses are carried out using the Arellano-Bond dynamic panel data procedure. We show that the effects of localisation and urbanisation externalities are indeed changing. In broad terms, localisation externalities seem to have dropped continuously, whereas the negative aspects of urbanisation have been largely overcome over the same time period. Chapter 3 In chapter 2, we only establish that agglomeration externalities change over time. However, we do not investigate what causes such changes. As argued in section 1.4, profound changes occur as industries move from one industry life cycle stage to the other. A relationship is thus expected between the maturity of an industry and the agglomeration externalities it experiences. The research question in this chapter concerns these relationships: Research question chapter 3: How do agglomeration externalities vary across stages of the industry life cycle? The dataset we use covers all manufacturing industries in Sweden between 1974 and 2004 and provides us with a wealth of information about the manufacturing industries in the central cities of the 70 labour market regions of Sweden.27 We are able to estimate the life cycle stage of twelve major industries on a yearly basis. Using insights from the ILC literature, we arrive at hypotheses about the strength of different agglomeration externalities in each life cycle stage. Next, we test these hypotheses by allowing agglomeration effects to vary with these stages. We find that the industry life cycle framework greatly improves our understanding of why we may observe variations in agglomeration externalities. In line with our theoretical framework, Jacobs externalities turn out to be especially strong in periods during which the industry is young or strongly renewing, whereas localisation externalities are strongest for industries in mature stages. Diseconomies of urbanisation due to high land rents are experienced most strongly by industries in mature and intermediate stages of development. Chapter 4 Both Penrose and Jacobs point out that relatedness in economic development is important. Firms (according to Penrose) and cities (according to Jacobs) grow by diversifying into related industries. Yet, in the study of agglomeration externalities, measuring relatedness is rarely considered an important part of the analysis, even though related industries may play a key role in explaining the success of a local industry, as discussed in section 1.4. Boschma and Wenting (2007), for instance, show 27 Idem.
44
that the presence of related industries helps explain the emergence of the British automobile industry in a small number of counties. Frenken et al. (2007) argue that, more than local diversity per se, local diversity in related industries is conducive to growth. This chapter is dedicated to the investigation of the relatedness structure of the economy. Our research effort is devoted to answering a number of questions: Research questions chapter 4: What is the structure of the technological relatedness among the manufacturing industries in the economy? Does this structure change over time? Does the mix of industries in a region change in a way that is to a large extent predetermined by technological relatedness? For this project, we investigate data on the yearly product portfolios of about 10,000 manufacturing plants in Sweden.28 We develop a tailor-made statistical technique to tease out the technological relatedness implicit in the product portfolios of a large sample of Swedish plants. As indicated in section 1.4, the methodology is predicated on the Penrosian notion of related diversification. In other words, we assume that the reason why firms produce a number of products that belong to different industries in a single plant is that the industries are related to one another in a technological sense. We call the resulting measure the Revealed Relatedness index. By plotting the network structure implicit in the technological distances between manufacturing industries, we arrive at a graphical representation of industry space. We submit this concept of industry space to a large number of tests. We compare it to relatedness suggested by the industrial classification system hierarchy. Then, we demonstrate how it can be used to construct asymmetric measures of technological distance, where complexity of products determines the direction of relatedness. We also show that technological relatedness is an inherently dynamic concept and that industry space itself changes over time. Finally, we take this measure and use it to predict the expansion and contraction of local economies in Swedish regions. Industry space turns out to be a good predictor of the development of the industrial mix of a regional economy. In particular, if a region has many industries that are closely related to an industry that has not yet gained a foothold in the region, the region has a high probability of attracting this industry within the next five years. Similarly, if an industry is isolated in a region, i.e., if there are very few local industries that are related to the industry, it has a high probability of leaving the region. Chapter 5 The final empirical chapter returns to the issue of agglomeration externalities. In chapter 3, we find that the industry life cycle has a profound impact on the strength of agglomeration externalities. However, not only industries evolve over time, but plants within industries also mature as they grow older. Following the paper by Duranton and Puga (2001) we mentioned in section 1.4, we argue that Jacobs’ externalities 28 Idem.
45
and localisation externalities benefit a plant’s performance at different stages of its development. A second aspect we explore is the importance of technological relatedness in the local environment. In chapter 4, we show that the presence of related industries in close physical proximity has a profound impact on the entry and exit of local industries in a region. An open question is how the externalities stemming from related industries influence a plant’s performance. Analogous to localisation and Jacobs externalities, we may expect an influence of the diversity and concentration of related industries in a city. Armed with the new tools developed in chapter 4, we aim to answer the following research questions: Research questions chapter 5: How do agglomeration externalities change with the age of a plant? What is the impact of local concentration and local variety in related industries on plants? The dataset used to explore these questions is the same as in chapter 3, but we had to invest some effort in order to be able to follow plants over the course of their entire history so as to use the data at their original, disaggregated plant level.29 Using survival analysis, we determine the influence of agglomeration externalities on the hazard rates of plants. An important aspect of our research questions is the suspicion that this influence may depend on the age of a plant. We use graphical support tools developed in medical statistics to determine the specification of age-dependence in a proportional hazards model. This allows us to study the changes in agglomeration effects plants undergo using a regular Cox model. The outcomes indicate that Jacobs externalities only aid a plant in the early years of its existence. Localisation externalities, in contrast, never contribute significantly to higher survival rates. As to the effect of a local concentration of related industries, we find strong positive effects on the survival rates of plants. Yet, there is little evidence that local diversity in related industries significantly extends the longevity of a plant. Chapter 6 In this final chapter, we discuss the main findings of the thesis. We point out some issues that have remained unresolved and suggest ways to improve the investigations. Next, we sketch the outlines of an agenda for future research that builds on the concepts that are developed in this thesis. We conclude our work by taking some time to speculate about the outcomes of such an agenda.
29 Idem.
46
Appendix 1.A: Justification of data sources The empirical investigations in this thesis make use of data on the United Kingdom and Sweden. In this appendix, we highlight some of the characteristics of these data that make them well suited for our purposes. In all empirical work, however, some practical problems are bound to arise. This thesis is no exception. We therefore also take some time to discuss these problems and explain how we have addressed them. In chapter 2, we investigate agglomeration externalities in counties in the United Kingdom. The main distinctive quality of the UK county data is that they extend over a particularly long time span from 1841 to 1971. As such, they provide a unique outlook on agglomeration externalities during a period of massive urbanisation in the United Kingdom. At the beginning of the sample period, the United Kingdom was one of the leading economic and military empires in the world, and its significance in the world economy during this period can hardly be overestimated. Moreover, its cities were the first to be transformed by the industrial revolution. At the same time, acknowledging the difficulties involved in historical data collection, the dataset shows a remarkable level of industrial and regional detail. In this sense, it is particularly well suited for the investigations of long-term changes in the interdependencies between local industries of this thesis. Most of the empirical burden in the thesis lies, however, with the data on the Swedish economy. Although Sweden has a small population, its manufacturing sector is strongly diversified. Also, unlike many other small countries, there are a number of sizable cities that are spread out across a large area. A further advantage of the Swedish case is that cross-border effects generated in agglomerations in neighbouring countries are limited, since the country is surrounded by mountains in the west, the Baltic Sea in the east, the Öresund in the south,30 and the Arctic Circle in the north. In research on agglomeration externalities, the absence of cross-border effects is of considerable value. Much time and effort have been invested in preparing these data for our empirical investigations. First, we purged out all obvious data-entry errors, both by hand and using algorithms we specifically wrote for this task. Next, we imputed translation schemes to handle changes in industrial classification systems and municipality definitions.31 In this way, we arrived at the local industry time-series that are used in chapter 3. For the analyses in chapter 5, we constructed reliable plant identifiers for the entire sample period.32 The resulting dataset has a high quality and is very rich 30 The bridge across the Öresund was only completed in 2000. 31 Mostly, we relied on plants that we observed in different classification systems in order to arrive at suitable translations. However, we also consulted information supplied by the Swedish statistical office. 32 The major challenge we faced was that Statistics Sweden changed its plant identification system in 1984. Fortunately, for many plants, years with overlapping information existed so as to match identifiers from both systems. For most plants, it was therefore possible to rely on matching algorithms and use computer programming to solve the problem. However, there was a considerable number of cases left that required the manual comparison of thousands of records. For example, when algorithms produced no matches, we used the municipality, industry and parent-firm identifiers together with employment data to identify suitable
47
in detail. We can distinguish between about 200 industries and 277 municipalities for a total of 36 years. Moreover, the dataset includes all variables that are needed to investigate the development of labour productivity in a local industry and a number of important control variables, such as wages and local housing prices.33 The most remarkable dataset we use in this thesis is probably the product portfolios data for Swedish plants.34 A particularly attractive aspect of this dataset is that product portfolios are available at the plant level instead of at the firm level. For this reason, we are able to base the Revealed Relatedness index we will develop in chapter 4 on plantlevel economies of scope. As we explain in that chapter, plant-level economies of scope are far more likely to be related to the production process than economies of scope at the firm level. That is why we think it is safe to argue that our Revealed Relatedness index is likely to reflect technological relatedness.
matching candidates. In the end, we were able to create a unique identifier for almost every single plant. At the same time, it proved possible to extend the time-series range of the data by five more years. 33 Local housing prices are extracted from a separate database. From 1981 and onwards, these are reported at the municipality level. From 1975 to 1981, we have data at the province level. Before 1975, no regional data are available. 34 The plants that are covered in this database overlap to a large degree with the plants in the database described in the paragraph above. This allowed us to impute a translation scheme between product codes and industry codes.
48
CHAPTER 2 THE LONG-TERM DYNAMICS OF AGGLOMERATION EXTERNALITIES
2.1: Introduction In the past two decades, there has been a rapid increase in research on agglomeration externalities, beginning with two widely cited papers in the field, namely, Glaeser et al. (1992), which was already discussed extensively in chapter 1, and Henderson et al. (1995). Similar analyses have been conducted using a large number of databases covering a wide variety of regions, industries and time-spans. The basic question driving these analyses, however, has remained more or less the same: do firms benefit more from local specialisation in their own industry (i.e., localisation externalities) or from a large variety of local industries (i.e., Jacobs externalities)? The methodology used in this literature has evolved since the groundbreaking work by Glaeser and his colleagues. As a result, over time, papers that study the same topic of agglomeration externalities use quite different methodological approaches. In the first part of this chapter, we discuss eight well known papers in this literature. Our main goal in this section is to show how the underlying logics behind the various models relate to one another. New approaches are added every year, but we will try to give a flavour of the variety and similarities across approaches. A full review of the literature, however, is beyond the scope of this chapter. Apart from a methodological discussion, we provide an overview of the empirical findings of these papers. Even in such a small subset of papers, this summary clearly shows the divergence in findings that characterises the literature as a whole. The remainder of this chapter is concerned with whether the temporal dimension may have contributed to this uncertainty within the literature. To the author’s knowledge, all empirical studies in the tradition of Glaeser et al. (1992) to date have taken agglomeration externalities to be constant over time. However, many factors that theoretically influence the strength of externalities have changed. For example, the costs of travelling and communication have sharply declined over the decades. Also, the way in which production is distributed between clients and suppliers in modern economies differs from how this was done in the past. For these reasons, the influence of agglomeration externalities may very well have changed 49
over the course of the past century or two. In the second part of the chapter, we study whether this is indeed the case. For our empirical analysis, we use a dataset on employment in 24 broad industries in 48 (standardised) counties in the United Kingdom. The sample begins in 1841 and observations are added every decade up to 1971, excluding the war year of 1941. To obtain precise estimates, data are pooled across all periods. Using dynamic panel data methods, we estimate the influence of past local specialisation and past local diversity on current local industry employment. Compared to the existing literature, the primary innovation in this chapter is that agglomeration parameters are allowed to vary over time. The outcomes on localisation externalities turn out to be surprisingly robust across the industries under investigation. All industries start out with local specialisation having a strong and positive influence. However, this positive effect diminishes significantly as time progresses. Urbanisation, in contrast, exhibits negative congestion externalities in the early decades of the sample. These congestion effects, however, diminish over time. The effect of local diversity is less clear. Estimates are barely significant and, depending on the industry, range from strongly negative to strongly positive. In section 2.2, we discuss the selected papers on agglomeration externalities we mentioned above. Special attention is devoted to the justification of specific empirical estimation schemes and how the variety of economic models used in the different articles relate to one another. In section 2.3, we develop the estimation methodology for the assessment of temporal variations in agglomeration externalities. Section 2.4 covers a description of the data on UK counties. Section 2.5 addresses the findings. Section 2.6 summarises the chapter and indicates directions for further research. 2.2: Approaches to estimating agglomeration externalities Agglomeration economies or agglomeration externalities are benefits a firm derives from the spatial concentration of economic activities in its vicinity. This section reviews the literature that assesses the strength of agglomeration externalities stemming from local diversity or local specialisation. The literature on this topic has been quite prolific, using a large variety of datasets and estimation techniques. As announced in the introduction to this chapter, an exhaustive overview is beyond the scope of this chapter. Instead, some well known papers are reviewed. The large variation in the methods and data found is representative of the literature in this line of research. Rather, the goal of this section is to show how the different empirical strategies relate to one another. As a starting point, agglomeration externalities are thought to influence the profitability of plants. This can be expressed in the following plant-level profit function: (2.1) pi = A(Ei)f(xi,q(Ei))-c(xi,p(Ei))
50
Where pi is the profit of plant i, A(Ei) represents the level of technology, which depends on the local environment, Ei . f(xi,q(Ei)) is the production function using inputs xi valued at output prices q(Ei). c(xi,p(Ei)) are the production costs as a function of inputs and input prices, p(Ei). Theoretically, agglomeration externalities can arise both from higher productivity and from cost-savings. The latter is reflected in the fact that prices depend on the local environment. However, in empirical work, this is usually neglected, and agglomeration externalities are modelled to operate solely through the productivity term, A(Ei): (2.2) pi = A(Ei)f(xi)-c(xi) If input prices are allowed to vary across locations, they sometimes enter the model explicitly, though not as a function of characteristics of the local environment: (2.3) pi = A(Ei)f(xi)-c(xi,pi) Equation (2.3) can be implemented in a regression analysis in several ways. The choice for a specific implementation depends largely on the data available and on the assumptions authors are willing to make. For a start, it is informative to have a look at the paper by Henderson (2003). Henderson rewrites (2.3) as: (2.4) pi+c(xi,pi)= A(Ei)f(xi) The LHS of this equation measures output, and the RHS describes how this output is generated. f(xi) is commonly assumed to be either Cobb-Douglas or translog, without any constraints on the parameters.35 To estimate such an equation, input and output data at the plant level must be available. Taking logs, the regression equation is linear in inputs and technology. Agglomeration externalities enter the equation through the technology term, A(Ei). The only assumption made is on the functional form of the production function. Given the level of inputs, the technology term measures how efficiently these inputs are used in a plant. Parameter estimates for variables describing the local environment, therefore, show how different types and levels of agglomeration influence the efficiency of local plants. The advantage of this method is that it imposes very little structure on the data. However, if firms are optimising the use of their inputs, they should choose production levels that equate the marginal factor productivity (MFP) of each input to its price. Modelling firms as price-takers, this suggests a second set of equations, with one equation for each input. Accordingly, Feser (2002) adds a set of MFP equations to the production function equation. This approach generally leads to more efficient
35 Henderson (2003) justifies these choices respectively as the first-order (log of Cobb-Douglas) and secondorder (translog) Taylor approximation of a log-transformed production function of a general shape.
51
estimates, but it comes at the cost of the extra assumption of optimal firm behaviour. Moreover, such estimates are only feasible if local factor prices are available. Often, capital data are not available. Using output data and data on labour inputs, it is still possible to estimate the effect of externalities. However, if capital inputs and agglomeration indicators are correlated (e.g., if due to the high costs of labour in big cities, production is more capital-intensive), it is hard to determine which part of the variation in labour productivity is due to variations in capital and which part is due to varying agglomeration effects. A large part of the literature, however, not only suffers from a lack of data on capital, but it also lacks data on output. In these cases, authors usually only know the level of employment in an industry at a certain location. Moreover, data are often not available for individual plants but rather are aggregated at the regional or city level. The production functions are therefore interpreted at the level of local industries instead of at the level of plants, thereby shifting the unit of analysis from the plant to the regional industry. In the formulas below, this is reflected in the subscript r (i.e., regional industry) or c (i.e., city-industry) instead of i (that is, plant). A variety of strategies exists to use such data in the framework of equation (2.1), all of which are based on an analysis of changes in employment over time. An example is Glaeser et al. (1992). These authors abstract from capital inputs in order to arrive at the following profit function: (2.5) pc = Ac f(Lc)-Lcw As the market for labour is assumed to be national, wages are taken to be equal across all spatial units. Furthermore, assuming that the level of labour input is chosen optimally, the marginal product of labour (MPL) must equal this national wage level. Now, if the equation MPL = wage is expressed in terms of growth factors, after rearranging terms and taking logs we can generate the following function: (2.6)
log(f ’(Lc ,t ))
=
log(Ac ,t )
−
log(wt )
log(f ’(Lc ,t −1 )) log(Ac ,t −1 ) log(wt −1 )
where f ’(Lc,t) is the MPL, that is, the first-order derivative of the production function with respect to labour inputs. Given that wages are fixed nationally, wage dynamics are assumed to be the same for all observations, and their effects are therefore subsumed in the constant of a regression equation. If the production function is monotonously increasing in labour, this equation states that – keeping other inputs constant – in a city-industry, growth in labour inputs will mimic growth of productivity. The final step is now to let log of growth in productivity depend on variables that describe the local
52
environment at the beginning of the period, i.e., log(Ac,t /Ac,t-1)= g(Ec,t-1). In this way, growth in employment is linked to start-of-period agglomeration measures.36 A similar approach is found in Henderson et al. (1995). However, Henderson and his colleagues do not specify their model in growth rates, but rather they assume that Ac,t+1= g(Ec,t). In other words, productivity at t=1 depends on the local economic environment at t=0. Again, assuming equilibrium in the labour market, the MPL = wage equation leads to the conclusion that above-average agglomeration externalities at t=0 result in higher-than-average employment at t=1. A second strategy to measure agglomeration externalities when only employment data are available is to reason from the point of view of firm-entry dynamics. Henderson (1997) uses a reduced form equation that is derived in Henderson (1994). In this model, a new actor is introduced, namely, the entrepreneur. The main idea is that entrepreneurs only enter an industry in a city if they can earn profits above a certain minimum level. This minimum level rises with the number of entrepreneurs already in the market, reflecting the increasing difficulty of attracting entrepreneurs out of existing activities. Actual profits in the industry are as in equation (2.2). Entry takes place as long as actual profits exceed the minimal profit demanded by entrepreneurs. As actual profits increase with better technology, the number of entrepreneurs in the market positively depends on agglomeration effects. Furthermore, all new entrepreneurs choose the same profit-maximising employment as existing entrepreneurs. As the number of active firms grows if technology improves, and labour input per plant remains the same or increases as well, regional employment in the industry will rise. Another paper based on firm-entry dynamics is the paper by Rosenthal and Strange (2003). These authors state that entry will occur if profit is positive. They then assume that entrepreneurs are heterogeneous and face the following profit function: (2.7) pi = A(Ei)f(xi)(1+εi)-c(xi) where εi is a random draw from a distribution with zero mean that reflects the quality of the entrepreneur. Assuming that inputs are chosen optimally, for each A(Ei) , there is a different minimum ε at which an entrepreneur would enter a local industry. As in Henderson (1997), as the number of entrants rises with A(Ei), so will local new establishment 36 It is interesting to note that this critically depends on the assumption that wages do not vary with labour demand in a region. If labour markets are not national, this assumption is hard to sustain. In this case, wages would increase in cities confronted with a rise in demand for labour, thereby weakening the link between employment growth and productivity growth. Another problem may arise from insufficient demand. Under perfect competition, any productivity gains will be reflected in lower prices, leading to increasing demand. However, if increases in productivity augment output faster than lower prices boost demand (i.e., if the price elasticity of demand is smaller than 1), the demand for labour should decrease. Both issues are discussed at length in Combes et al. (2004).
53
employment. Therefore, the total entry employment in a region is positively correlated with the number of entrants. Rosenthal and Strange, unlike Henderson, explicitly use data on the entry of firms to test their model. They argue that a higher probability of entry must be reflected in higher entry per square km. The advantage of this approach is that no optimality assumptions regarding firm behaviour are needed. Even if entrepreneurs are only satisficing instead of optimising, entry per square km should be higher if agglomeration externalities are higher. As new entrants must set up an establishment, all costs can be considered variable and all inputs can be chosen optimally, including capital investment. Unconstrained by existing productive assets, the chosen amount of labour (and the corresponding, though unobserved, amount of capital) will more accurately reflect current agglomeration effects than would employment for existing producers. A final noteworthy paper that adds the number of firms into the model, is Combes et al. (2004). The authors build a model of Cournot competition, where each firm maximises profit given a certain demand elasticity. Here, in contrast to the previous studies, demand is not considered inelastic. Because of this, prices, and therefore profits, will vary with the number of firms in a local market. Using this relation, Combes and his colleagues show how average plant scale (measured in terms of labour input) depends on the price elasticity of demand and the supply elasticity of labour. Moreover, the assumption that entry will occur until profits are equal to zero results in an equation that can be used to identify the number of active firms in a region. Through the profit function, this number of active firms depends on agglomeration externalities. The authors then estimate a system of equations, with number of firms and average employment per firm as dependent variables. Although all models seek to locate agglomeration externalities in the technology term of the production function, data availability and varied willingness to make certain assumptions have lead to a wide range of models. However, it is interesting to note that most papers that only use employment data arrive at the same basic regression equation. The fact that most authors estimate a model with own industry employment as the dependent variable and the lag of own industry employment as a regressor indicates that their models can be rearranged into growth models by subtracting the lag of own industry employment from both sides of the equation. From an estimation point of view, therefore, the models presented by Glaeser et al. (1992), Henderson et al. (1995) and Henderson (1997), the new establishment employment equation in Rosenthal and Strange (2003) and the average employment equation in Combes et al. (2004) are the same or very similar. That is, they can all be rewritten in the following general form:37 37 There are small differences in the last two cases: Rosenthal and Strange take employment per square km, and Combes and his co-authors take average employment per plant but control for the number of plants, thereby complicating the rearrangement of terms.
54
(2.9) ln(Lr,t )= ln (A(Er,t-1)) where ln(A(Er,t-1 )) can be decomposed into a summation of various terms, one of which is the log of lagged own industry employment, ln(Lr,t-1 ). It is therefore not surprising that Combes (2000), the final paper in our review, only provides us with a reduced-form equation that fits the general shape of equation (2.9). Where the models do differ, is in the specification of the agglomeration circumstances and the estimation techniques. Most articles at least take the following three different aspects of the local economic environment into consideration: specialisation, diversity and the size of the local economy. As discussed in section 1.2.2, externalities arising from specialisation are often called localisation externalities. A high degree of specialisation in an industry can benefit the industry through advantages related to labour-market pooling, local inputoutput linkages and intra-industry knowledge spillovers. Most authors focus on the knowledge spillover aspect of localisation externalities and try to construct an index that captures these effects.38 In the papers discussed above, this has been implemented by calculating (a) the share of own industry employment in total employment,39 (b) the level of own industry employment at the beginning of the period, or (c) the number of plants in the own industry. Glaeser et al. (1992), Henderson et al. (1995) and Henderson (1997) all take both, employment shares and levels, as regressors: loc sa, r ,t =
Ls , r ,t −1 Ls ,t −1
loc = ln (Ls,r,t-1) b s,r,t
where Ls,r,t is the employment in industry s in region r at time t, and Lr,t is the total employment in region r at time t. These two indicators are clearly functionally related. If controls for local market size are added that are highly correlated with total regional employment, Lr,t , identification critically depends on using a log transformation in the calculation of loc bs,r,t and no log transformation when calculating loc as,r,t.40 Combes (2000) and Combes et al. (2004) therefore choose to make use of only one of these indicators at a time. Furthermore, neither indicator can distinguish between the internal scale, or firm size, and the external scale, or regional size, of an industry. Therefore, if data are available, it is preferable to use the number of own industry plants in a region as a measure of the scale of an industry, as in Henderson (2003). 38 A notable distinction is Feser (2002), who tries to proxy all different sources of externalities with specific indicators. 39 Sometimes this is corrected for national shares, leading to location quotients. This, however, should only matter if observations are pooled across industries. Otherwise, the correction term is covered by either a constant term (cross-section) or time dummies (panel data). 40 Indeed, as argued in Combes et al. (2004), if local size is proxied by ln(Lr,t) and the loc a indicator is also logtransformed, identification is not possible due to perfect collinearity.
55
Table 2.1: Dependent variables and methods of estimation used in the literature Study
Region
Units
Time period
Dependent variable*
Method
Glaeser et al. (1992) US
City-industries
1956-1987
ln(Ls,c,1987 / L ) s,c,1956
Cross-section
Henderson et al. (1995)
US
City-industries
1970-1987
ln(Ls,c,1987)
Cross-section and logit (high tech)
Henderson (1997)
US
Countyindustries
1977-1990
ln(Ls,r,t)
Panel data
Combes (2000)
France
Regionindustries
1984-1993
L L ln( s,r,1993 / s,1993) ln Ls,r,1984 Ls,1984
Cross-section (tobit)
Feser (2002)
US
Plants
1992
ln(outputs,i,1992)
Cross-section (price = MFP system)
Henderson (2003)
US
Plants
1977-1992
ln(outputs,i,t)
Panel data
Rosenthal and Strange (2003)
US
Zip-code areas
1996-1997
/km2 Lentry s,r,1997
Cross-section
Combes et al. (2004) France
*
#entriess,r,1997 /km2 Regionindustries
1984-1993
ln(Ls,c,t /#plantss,c,t)
Panel data
ln(#plantss,c,t)
The first index (s) indicates the industry; the last index indicates the time period. The middle index represents city (c), region (r) and plant (i). If an index is omitted, values are summed over its domain (sometimes excluding the own-cell contributions).
This indicator can only reflect the external scale of the local industry. In plant-level studies, however, information on the size of each plant is available, and internal scale effects can be controlled for. In this case, none of the above indicators should be problematic.41 The externalities derived from local diversity are called Jacobs externalities. Jacobs externalities occur because of a love-of-variety effect, as present in Dixit-Stiglitz (1977) production functions, lower demand volatility and inter-industry knowledge spillovers. Again, authors often focus on knowledge externalities. Most authors use a Herfindahl index of local employment diversity.42 A similar index that is used in this chapter is the entropy index. The scale of local activity is measured by variables such as total employment or total population in a region, often expressed as density per square km. Externalities 41 The same holds for the work of Rosenthal and Strange. As these authors use plant entry and new establishment employment, lagged data measure the scale of the industry before entrance, and capture therefore only external economies of scale. 42 Only Glaeser et al. (1992) use a different measure, based on the share of the five largest industries in the local economy, excluding the own industry.
56
associated with local scale are called urbanisation externalities. They derive from the availability of producer services, a good infrastructure, access to all kinds of amenities etc.. Apart from these three core regressors, researchers often include controls. Most common among these are local competition variables43 and information on local wages. Another dimension along which studies differ is the chosen estimation method. Some authors use cross-section methods, whereas other authors use panel data methods. (Fixed effect) panel data models have the distinct advantage that any omitted variables that remain fixed during the period of study, such as climate, the availability of raw materials, infrastructure and culture, do not bias results. As a result, all inference is based on variation within individual cities over time, whereas results in cross-sectional studies build on the variation between cities at one point in time. Other differences in estimation techniques include controls for endogeneity, the estimation of systems of equations, and models that do not focus on the size of an industry in a region but rather on whether the industry is present in a region at all. The latter studies typically use logit estimations. Both approaches can be combined using tobit regressions. Articles also differ in the time period studied, the geographical coverage and the industry under examination. To allow for easy comparison, we only discuss articles that study one of two geographical areas, namely, the United States and France. However, similar studies have been carried out for the Netherlands (Van Oort 2004), Korea (Lee et al. 2004), Japan (Dekle 2002) and many other areas in the world. It is not self-evident that agglomeration externalities should play the same role across different regions. As the industry-specific estimates in the studies that cover multiple industries clearly show, agglomeration effects also differ across industries. Tables 2.1 and 2.2 summarise the articles in this review with respect to their sample, estimation method and outcomes. Our study focuses on the temporal dimension. Previous studies have neglected the possibility that agglomeration effects change over time. However, agglomeration externalities can be expected to vary over time. In the short-run, for example, it is not obvious that agglomeration will protect an industry in economic downswings as much as it will spur its growth in upswings. Moreover, taking a long-term perspective, the way in which we travel and do business has substantially changed. Over the course of the twentieth century, innovations in transportation and communication technology have made physical distance less of an obstacle. This may have resulted in lower agglomeration externalities. However, the standardised mass production systems of the first half of the century have been replaced by a wide range of different organisational forms, such as lean production (Piore and Sabel 1984) and the use of 43 It is interesting to note that Combes (2000) uses the average plant size as an indicator for internal economies to scale, whereas most other authors use the inverse of this variable to measure the degree of local competition.
57
58 + +
+ +
ln(#plantss,c,t-1)
Ls,c,’96
Ls,c,’96
Henderson (2003)
Rosenthal and Strange (2003)
+
Supplier access Client access Labour pool
+
Ls,r,t,...,t-7 / Ls,r,t,...,t-7
Feser (2002)
-
ln(Ls,r,t,...,t-7)
L L ln( s,r,’84 / s,’84 ) ln Lr,’84 L’84
+
Ls,c,’70 / Lc,’70
Combes (2000)
Henderson (1997)
+
ln(Ls,c,’70)
-
-
ln(Ls,c,’56 / Lc,’56)
Henderson et al. (1995)
-
Ls,c,’56
Glaeser et al. (1992)
H
ns
ns +
+
-
+
+
L
outcomes
Localisation
Study
-
S
HHI
HHI
HHI
Patents
HHI
HHI
HHI
Size 5 largest city-ind
Jacobs
Table 2.2: Overview of regressors and outcomes in the literature
ns
ns
+
+
H
+
+
+
+
ns
+
ns
ns
L
outcomes
-
S
ns ns ns
(Lr,t-1 -Ls,r,t-1) (Lr,t-1 -Ls,r,t-1)
+ +
ln(Lc,t-1)
University R&D Population density
+
+
(Lr,t-1 -Ls,r,t-1)
L ln( r,t-1 ) ln arear
+
-
H
ns
ns -
+
+
-
L
outcomes
Distance national business centre ln(Lc,t-1)
Urbanisation
+
S
Competition MSA FE
Competition MSA FE
MSA FE ind-time FE
Education Competition
Competition Plant size
Wages County FE
Region dummies Wage education
Region FE Wages, competition
Controls
59
Ls,c,t-1 ) (#plantss,c,t-1)
Ls,c,t ) (#plantss,c,t)
ln(#plantss,c,t)
ln(
ln(#plantss,c,t)
ln(
Localisation H
+
-
+
+
L
outcomes
+
-
+
+
S
# ind.
HHI
# ind.
HHI
Jacobs H
-
+
-
+
L
outcomes
-
+
-
+
S
ln(Ls,t-1)
ln(Lr,t-1)
Urbanisation
+
+
H
L
outcomes
+
+
S
Competition Monopoly Ind-reg. FE MA(1)
Competition Monopoly Ind-reg. FE MA(1)
Controls
Remarks: +: significant and positive; -: significant and negative; ns: not significant. FE: fixed effects. MSA: Metropolitan Standard Area. H: high tech manufacturing; L: low tech manufacturing; S: Services. If cells are merged, regressions have been carried out across all manufacturing. For Jacobs externalities, many authors use a Hirschman Herfindahl Index (HHI), which measures the lack of diversity. Sometimes this measure is transformed into a diversity indicator, e.g., by taking its inverse. In the Jacobs externality column, the entry HHI indicates a (possibly transformed) HHI-based measure. However, in the “+”/“-” coding used in the table, “+” signifies a positive effect of diversity on the dependent variable. For studies that use levels of employment as a dependent variable, it should be noted that estimates between 0 and 1 for lagged employment levels would correspond to estimates between -1 and 0 for growth regressions. In fact, such estimates indicate a reversion to the mean. In this overview, these are interpreted as positive localisation externalities because they indicate that a lead in period t is associated with a – smaller, but still a – lead in period t +1. As Glaeser et al. (1992) do not take logs of lagged own industry employment, comparisons with the articles that use employment levels rather than employment growth are difficult. Several authors use separate regressions for individual industries (Henderson et al. 1995; Henderson 1997; Combes 2000; Feser 2002; Rosenthal and Strange 2003). When authors report pooled estimates, we use these outcomes. If there are no estimates across all high-tech and low-tech manufacturing, we use industry names to categorise outcomes. Henderson et al. (1995) report positive diversity effects only in the logit model estimating the probability that a high-tech industry enters a city between 1970 and 1987. Henderson (1997) investigates agglomeration effects using a lag structure of length 7. There are therefore seven estimates for each indicator. We have tried to reflect the general overall impression that arises from these seven estimates in this table. Combes (2000) uses besides an HHI-measure a count of active industries in a region to proxy diversity.
Combes et al. (2004)
Study
out-sourcing to focus on core competences. In these new manufacturing processes, a premium is placed on frequent interaction and knowledge transfer. As knowledge transfers still require significant face-to-face interaction, the importance of the local environment may have increased. To estimate the impact of each of these developments, we would require information on the timing of each of them. Moreover, the amount of changes that have occurred over the past century and a half is enormous. Therefore, the goal of the second part of this chapter is not to explain changes in externalities over time but rather to identify general structures in these changes and propose some stylised facts. If it appears that agglomeration externalities change over time, neglecting this temporal dimension has severe consequences for the validity of parameter estimates. 2.3: Estimation framework As compared to the existing literature, the novelty of the estimations presented in this chapter is the use of time-varying parameters. In order to generate some insights into the robustness of the results, the analysis is repeated for seven different industries. As the prime interest lies in parameter changes, the conclusions will hopefully be less sensitive to the exact estimation procedure. Moreover, using the same econometric procedure across all industries ensures the comparability of outcomes. Let us start from the reduced-form equation in equation (2.9) that can be justified in any of the ways described in the literature review. ln (Ls,r,t)= ln (A(Es,r,t-1)) This equation first must be adapted to a panel data context. In order to capture timeindustry effects such as national business cycles, we add time dummies. Regionspecific effects are controlled for by county dummies: →
(2.10) ln (Ls,r,t)= ln (A( bt ,Es,r,t-1))+ ηs,r+ ts,t+ εs,r,t ηs,r , the county-specific effects, and ts,t , the time-specific effects, are allowed to correlate with the regressors. εs,r,t is taken to be white noise.44 The time-varying aspect → of the coefficients is reflected in the time-subscript of the parameter vector bt . Now, let us turn to the elements that are included in the technology term. Following the literature, three indicators are used to capture localisation, Jacobs and urbanisation externalities. Localisation externalities are measured as the log of lagged own industry employment: ln (Ls,r,t-1)
44 The fact that εs,r,t is not correlated over time can be justified by the ten-year sampling rate. Any correlation in idiosyncratic shocks should have vanished over such a long time period.
60
This measure captures the size of the local industry in the past. An estimate higher than 1 indicates that if a region has a higher share of an industry than any other region, this region would move into an explosive growth path and in the long run take over all of the country’s employment in this industry. Estimates between 0 and 1 can be interpreted as reversion to the mean: keeping other variables constant, regions with higher than average employment in an industry will keep a lead in terms of employment over regions with lower than average employment in the industry, but this gap will shrink over time. Jacobs externalities are measured by the entropy of all other manufacturing employment in the region. Employment entropy is defined as follows: ent s , r ,t
Lv , r ,t Lv , r ,t log 2 = ∑ − Lu , r , t v∈S {s } ∑ Lu , r ,t u∈∑ S {s } u∈S {s }
where S|{s} is the total set of industries, with industry s omitted.45 The advantage of the entropy index over the HHI, into which each industry’s contribution enters the equation quadratically, is that it is not as dominated by the shares of a few large industries. Moreover, entropy rises with an increase in diversity,46 whereas high HHI values correspond to low levels of diversity. The entropy index can therefore be interpreted as a diversity measure without any inverse transformations. Urbanisation externalities are measured by population density: dens r ,t =
pop r ,t area r
The overall estimation equation is thus: (2.11) ln(Ls ,r ,t ) = β sloc,t ln(Ls ,r ,t −1 ) + β sJac,t ln(ents ,r ,t −1 ) + β surb ,t ln(dens s , r ,t −1 ) + η s , r + τ s ,t + ε s , r ,t To remove fixed effects, we first-difference (2.11): (2.12) ∆ ln(Ls ,r ,t )= ∆β sloc,t ln(Ls ,r ,t −1 ) + ∆β sJac,t ln(ent s ,r ,t −1 ) + ∆β surb ,t ln(dens s , r ,t −1 ) + ∆τ s ,t + ∆ε s , r ,t
45 As a reference set, we use all other manufacturing industries, except Food, Drink and Tobacco, which, in the nineteenth century, would dominate the index completely due to its size, and Other Manufacturing Industries, which is not a proper industry. 46 With complete specialisation in one industry, the entropy is equal to zero (setting 0 ⋅ log(0) equal to 0). Complete diversity (that is, every share equals l/n, with n the total number of industries) leads to a value of n ⋅ (l/n) ⋅ log(n)= log(n).
61
As Dεs,r,t=εs,r,t-εs,r,t-1 and, by construction, εs,r,t-1 is correlated with ln (Ls,r,t-1), the errors are correlated with the localisation term. We therefore must use instruments. If the errors can be assumed to be white noise, we can use all lags (t – j) with j > 1 of the dependent variable as instruments. This procedure yields the Arellano-Bond estimator (Arrellano and Bond 1991). The problem of equation (2.12) is that it requires the estimation of (T-2)*3 parameters. We can economize on the number of parameters by assuming that parameters vary smoothly over time. By expressing each parameter as a polynomial of time, we can reduce the burden on the econometrics: (2.13) β sext,t = β s0 ,ext + β s1,ext t + β s2 ,ext t 2 + β s3,ext t 3 + ... where ext∈{loc, Jac, urb}, and t represents the time period. Furthermore, as national industries are expected to grow exponentially, we add t as a regressor to capture national growth trends. Taking first differences, this amounts to adding an intercept to (2.12). Adding the intercept and filling in a polynomial of degree two specification for (2.13) in (2.12) yields: (2.14) ∆ ln(L s , r ,t ) = α s + β s0 ,loc ∆ ln(Ls ,r ,t −1 ) + β s1,loc ∆(t ln(Ls ,r ,t −1 )) + β s2 ,loc ∆(t 2 ln(Ls ,r ,t −1 )) + β s0 , Jac ∆ ln(ent s , r ,t −1 ) + β s1, Jac ∆(t ln(ent s , r ,t −1 )) + β s2 , Jac ∆(t 2 ln(ent s , r ,t −1 )) + βs0 , urb ∆ ln(dens r , t −1 ) + βs1, urb ∆(t ln(dens r , t −1 )) + βs2 , urb ∆(t 2 ln(dens r , t −1 )) + ∆τ s , t + ∆ε s , r , t
which corresponds to the following equation in levels: (2.15) ln(L s , r ,t ) = α s t + ( β s0 ,loc + β s1,loc t + β s2 ,loc t 2 ) ln(Ls ,r ,t −1 ) +
(β (β
) ) ln(dens ) + τ
0 , Jac s
+ β s1, Jac t + β s2 , Jac t 2 ln(ent s , r ,t −1 ) +
0 , urb s
+ β s1,urb t + β s2 ,urb t 2
r , t−1
s ,t
+ ε s , r ,t
2.4: Data and industries 2.4.1: Occupation data The data were assembled by Lee (1979) and acquired from Southall et al. (2004).47 They consist of decennial observations during the period 1841-1971, excluding the war year
47 The electronic data have been checked against the data in Lee (1979). This has led to some 15 revisions. Data on area have been added from the website A Vision of Britain through Time (GBHGIS, 2006).
62
of 1941.48 The data cover the combined area of England, Scotland and Wales and are drawn from British occupation censuses. Lee (1979) groups occupation categories into 27 different industries. To achieve a higher level of consistency, we recoded the data into 24 industries. A possible objection to the use of these data is that they are not exactly industrial employment data. In contrast to what is customary in an industry census, people were not asked to state the industry in which they were active but only their occupation.49 However, the use of these data is justifiable and, in some ways, even preferable to industrial census data. Knowledge spills over between employees who have a specific occupation, not between firms, which belong to an industry, since employees sharing an occupation participate in the same cognitive field, while firms generally employ employees with varying occupations. Localisation externalities presumably help firms develop incremental innovations using highly specialised industry-specific knowledge, whereas Jacobs externalities are assumed to spur radical innovations that are imported from fields of knowledge outside the own industry (Henderson et al. 1995; Frenken et al. 2007). Therefore, in order to distinguish between localisation externalities and Jacobs externalities, the field of knowledge from which spillovers originate, rather than the industry itself, matters. In this respect, occupation data are more appropriate to measure localisation and Jacobs spillovers than industry data, as the former correspond more closely to skills and fields of knowledge than the latter. Although occupation data have some advantages over industry data when regressors are drawn from them, they are harder to interpret when used to construct dependent variables. In general, we are not concerned with how fast employment in a specific occupation grows but rather with how fast industries expand. However, the original census data show an extraordinary number of occupation classes allowing a reasonable translation into 24 industry classes.50 Groupings by occupation, therefore, can be regarded as an approximate industry classification. 2.4.2: Data limitations Due to some changes in definitions, the comparability of time series over the entire sample is limited. Specifically, there was a structural break in data collection in 1901. However, the two series partially overlap, with the first running from 1841 to 1911 and the second from 1901 to 1971. Using the overlapping years to assess the stability of the classification system, seven industries are chosen that are only minimally affected by the structural break.51 These include the compound industries Metal manufacture & metal goods not elsewhere classified and Textiles & clothing and footwear and the 48 To avoid missing data problems, we leave the year 1951 out of the estimations. 49 This was the case particularly before 1901. In later censuses, also the industry in which the occupation was held was registered. For a description of the census procedures, see Lee (1979). 50 In 1841, for example, 877 different occupation groups were distinguished (Lee, 1979). 51 See Lee (1979) for details.
63
64
*
Source: GBHGIS (2006)
General Population (000) Area (000 acres)* Population density (levels per acre) Employment in (000) Metal manufacture & Metal goods n.e.c. Mechanical engineering Instrument engineering Shipbuilding Vehicles Textiles & Clothing and Footwear Construction
Table 2.3: Description of the data by industry
53,977 56,453
1,137 1,125 145 180 789 1,062 1,669
18,489 56,374
246 32 16 27 39 1,411 370
5.12 0.67 0.33 0.57 0.81 29.40 7.71
385 1,174 0.375
1841
1841
1971
mean
total
23.68 23.43 3.03 3.76 16.43 22.12 34.77
1,125 1,176 1.172
1971
6.88 1.24 0.84 0.99 1.27 52.69 9.85
449 1,180 0.266
1841
std. dev.
37.60 31.77 6.81 6.39 28.11 40.34 49.53
1,597 1,184 1.119
1971
66.2% 74.9% 73.7% 73.3% 57.0% 69.4% 55.4%
52% 51%
1841
top 20%
75.3% 62.7% 69.6% 80.7% 70.3% 74.3% 58.3%
60% 51%
1971
2.9% 2.0% 3.5% 0.3% 2.9% 3.2% 5.4%
6% 7%
1841
0.8% 1.7% 0.4% 0.2% 0.3% 1.4% 3.8%
3% 7%
1971
bottom 20%
industries Mechanical engineering, Instrument engineering, Shipbuilding and marine engineering, Vehicles and Construction. A complete list of industries can be found in Appendix 2.A. A second issue is the distinction between internal and external economies of scale. Localisation externalities assume that a firm benefits from an agglomeration of its own industry activity in its region. In other words, there should be economies of scale that cross the boundaries of firms. To distinguish this effect from firm internal economies of scale, it is necessary to take into account the size of individual firms. Unfortunately, data on firm size are not available. Another problem is the lack of control variables. Wages and the quality of human capital are not neutral factors in agglomeration processes, as discussed in the literature review. High wages attract people with high human capital, and high average human capital levels may justify higher wages. Moreover, higher wages in large cities represent high factor costs which may offset some of the productivity advantages derived from agglomeration externalities. Ideally, we would control for wage levels, but again, data limitations prohibit this. Finally, the boundaries of some counties underwent many changes over the period under study. Therefore, the counties of London, Middlesex, Kent and Surrey have been merged into one county of Greater London. The counties of East Riding and West Riding have been merged as well. Although these issues are not trivial, the long-term time-series dimension compensates in part for the shortcomings above. Over longer periods, migration can take place to restore – or at least move towards – equality in real wages across regions. Moreover, taking decennial observations should resolve local business cycle concerns. The fact that data points are ten years apart makes it unlikely that random shocks to the economy leave temporal correlation traces in the error term. Counties in the UK In the estimation we use data from 48 counties. These counties vary to a great extent in surface area, as the upper part of Table 2.3 summarises. The least densely populated area in the sample is the Scottish Highlands in both 1841 and 1971. In fact, the population density in this region even decreased from 0.043 to 0.033 persons per acre. The most densely populated area is Greater London. Ranging between 1.552 (1841) and 5.932 (1971) persons per acre, this area has between 36 and 180 times the population density of the Highlands. Development of industries in the UK, 1841-1971 Despite difficulties common to most historical data, the data we use are extraordinarily rich. They cover a large part of the history of industrialisation in the United Kingdom, which was the first country to develop this new mode of production. We now present some facts about this part of British economic history as far as it is covered by the data. The population in England, Scotland and Wales all but tripled from a mere 18.5 million inhabitants to 54.0 million. This explosion in population was accompanied by huge 65
Table 2.4: National employment growth in broad sectors LEVEL 1841
GROWTH 1971
unadjusted
population indexed
Agriculture and fishery
1,524,249
634,750
-58%
-86%
Manufacturing + mining
2,920,842
10,196,380
+249%
+20%
Services
1,717,364
10,238,690
+496%
+104%
87,577
1,571,670
+1695%
+515%
Government
employment shifts over the 130 years of economic development. In 1841, agriculture and fishery, for example, made up almost a quarter of British employment, while in 1971 this share had shrunk to 2.7%. Also, the rise and fall of the British textiles industry are clearly visible; in its golden years from the 1860s until WWI, the industry employed over 1.4 million workers, representing 21% of total British employment. In the 1970s, this number had tumbled to a mere 4% of the British workforce, representing at that time one million employees. Another significant event in the time period under study is the rise of the services economy. Until 1931, manufacturing offered higher employment than services, but from that moment on, the service industries overtook manufacturing as the largest source of employment in the UK. In 1971, financial services and professional services alone provided employment for 16% of the workforce. Given that in 1841 this sector started with a combined employment of 2% of the national workforce, this increase is remarkable. Table 2.4 shows how much growth rates in manufacturing lagged behind. For the seven industries in this study, the bottom part of Table 2.3 shows several statistics about each industry in both 1841 and 1971. A log transformation of the employment data results in relatively symmetric, bell-shaped distributions. Standard deviations are typically between one and two times the mean, reflecting the skewedness of the untransformed data. This is confirmed when looking at the 4th and 5th column. These show the percentage of total employment in the top 20% and bottom 20% of all counties. Generally, the distributions shift in favour of the largest counties, with five out of seven industries in the top 20% counties showing an increase in total national employment. In all industries, the bottom 20% experience a decrease in employment share. It is therefore interesting to see if and when industries started to agglomerate. In Table 2.5, the Gini coefficients have been calculated for all industries in each year. Overall, the concentration of industries increased until the 1930s, but after that, industries became less concentrated. The bottom part of the table displays changes in the Gini coefficients and shows this pattern more clearly. Only mechanical engineering and instrument engineering have a declining Gini coefficient early in the sample. However, the decline becomes more pronounced after 1931. The picture that arises suggests that in the beginning of the period, there were some advantages of being co-located with other firms in the industry. However, this advantage decreased 66
67
Coding: --: < -.025; -: < 0; +: >0; ++: >.025
Metal manufacture & metal goods n.e.c. Mechanical engineering Instrument engineering Shipbuilding and marine engineering Vehicles Textiles & clothing and footwear Construction
Summary of changes
Metal manufacture & metal goods n.e.c. Mechanical engineering Instrument engineering Shipbuilding and marine engineering Vehicles Textiles & clothing and footwear Construction
Evolution of Gini coefficients
1841
0.60 0.70 0.69 0.71 0.54 0.64 0.49
1841
+ + + + -+ +
1851
0.64 0.73 0.71 0.73 0.52 0.64 0.50
1851
+ + + + + +
1861
0.67 0.72 0.73 0.74 0.56 0.64 0.51
1861
Table 2.5: Gini coefficients by individual industry, 1841-1971
+ + + + +
1871
0.68 0.72 0.72 0.78 0.56 0.66 0.54
1871
+ + + + +
1881
0.69 0.71 0.70 0.78 0.58 0.67 0.56
1881
+ + + + + +
1891
0.69 0.73 0.70 0.80 0.60 0.69 0.56
1891
+ + + + + +
1901
0.70 0.72 0.70 0.83 0.63 0.70 0.57
1901
+ + + + + +
1911
0.70 0.71 0.71 0.84 0.67 0.71 0.57
1911
+ + + + + +
1921
0.77 0.73 0.88 0.82 0.70 0.77 0.59
1921
-+ +
1931
0.76 0.72 0.78 0.84 0.68 0.77 0.60
1931
-+ -+ --
1951
0.75 0.68 0.79 0.80 0.70 0.76 0.57
1951
-+ + --
1961
0.74 0.66 0.81 0.79 0.71 0.74 0.56
1961
-------
1971
0.70 0.59 0.68 0.75 0.69 0.69 0.53
1971
ERRATA
The tables below should be added to chapter 2 after page 67.
Table 2.6: Metal manufacturing & metal goods n.e.c. (1) βs0,loc
2.05 *** (0.26)
βs1,loc
(2)
(3)
1.42 *** (0.14)
1.07 *** (0.16)
1.38 *** (0.14)
-0.14 *** (0.03)
-0.06 (0.08)
-0.13 *** (0.03)
0.92 (0.61)
-0.17 (0.90)
-0.14 (0.08)
0.20 (0.26)
-1.57 *** (0.29)
-0.32 (0.37)
-1.39 *** (0.27)
-0.22 (0.14)
0.11 * (0.06)
-0.01 (0.00)
βs2,loc βs0,Jac
1.26 *** (0.49)
βs1,Jac
β
-0.13 (0.37)
-0.02 (0.02)
βs2,Jac βs0,urb
(4)
-2.79 *** (0.42)
0.14 ** (0.07)
1,urb s
0.03 *** (0.01)
βs2,urb F-statistic
73.12 (12)
234.94 (15)
242.10 (18)
234.07 (14)
Sargan-statistic
25.37 (26)
13.21 (52)
12.16 (78)
14.02 (52)
p-value AR(1)
0.00
0.08
0.40
0.10
p-value AR(2)
0.72
0.20
0.19
0.18
Dependent variable: log employment. Significance levels: ***: p=0.025; **: p=0.050; *: p=0.100. Chi-square 5% critical value: 12: 21.03; 14: 23.69; 15: 25.00; 18: 28.78; 26: 38.89; 52: 69.83; 78: 99.62. Instrument lists for terms involving dependent variables: Δ(ln(Ls,r,t-1)): ln(Ls,r,t-2), ln(Ls,r,t-3); Δ(t·ln(Ls,r,t-1)): (t-2)·ln(Ls,r,t-2), (t-3)·ln(Ls,r,t-3), (t-4)·ln(Ls,r,t-4); Δ(t2·ln(Ls,r,t-1)): (t-2)2·ln(Ls,r,t-2), (t-3)2·ln(Ls,r,t-3), (t-4)2·ln(Ls,r,t-4).
1
Table 2.7: Mechanical Engineering (1) βs
0,loc
1.96 *** (0.24)
βs1,loc
(2)
(3)
1.72 *** (0.24)
1.06 *** (0.31)
1.68 *** (0.24)
-0.13 *** (0.05)
0.09 (0.09)
-0.12 *** (0.05)
-0.02 *** (0.01)
βs2,loc βs0,Jac
-0.51 (0.72)
βs1,Jac
-1.89 (1.17)
-3.59 * (1.89)
0.13 (0.13)
0.76 (0.53)
-2.12 *** (0.52)
-0.25 (0.69)
-0.83 (0.54)
-2.15 *** (0.52)
0.09 (0.10)
-0.53 *** (0.21)
0.08 (0.10)
-0.04 (0.03)
βs2,Jac βs0,urb
(4)
-3.47 *** (0.48)
βs1,urb
0.04 *** (0.01)
βs2,urb F-statistic
67.72 (12)
156.71 (15)
164.35 (18)
156.02 (14)
Sargan-statistic
18.57 (26)
15.50 (52)
14.55 (78)
14.55 (52)
p-value AR(1)
0.00
0.00
0.00
0.00
p-value AR(2)
0.95
0.89
0.91
0.93
(2)
(3)
(4)
1.78 *** (0.19)
0.79 *** (0.30)
1.38 *** (0.17)
-0.20 *** (0.03)
0.15 (0.12)
-0.13 *** (0.03)
Idem table 2.6.
Table 2.8: Instrument engineering (1) βs0,loc
0.92 *** (0.12)
βs1,loc
-0.02 *** (0.01)
βs2,loc βs0,Jac
1.14 (0.69)
βs1,Jac
1.07 (1.20)
-1.23 (1.81)
-0.14 (0.14)
0.68 (0.52) -0.06 * (0.03)
βs2,Jac βs0,urb
0.23 (0.59)
-1.32 *** (0.28)
βs
1,urb
-1.75 *** (0.42)
0.93 (0.62)
-0.04 (0.47)
0.16 *** (0.06)
-0.77 *** (0.22)
-0.29 *** (0.12)
0.06 *** (0.02)
0.02 *** (0.01)
βs2,urb F-statistic
74.70 (12)
181.29 (15)
174.51 (18)
175.79 (15)
Sargan-statistic
72.42 (26)
36.21 (52)
37.67 (78)
46.86 (52)
p-value AR(1)
0.00
0.00
0.00
0.00
p-value AR(2)
0.13
0.26
0.27
0.16
Idem table 2.6.
2
Table 2.9: Shipbuilding and marine engineering (1) βs
0,loc
1.39 *** (0.14)
βs1,loc
(2)
(3)
1.01 *** (0.10)
0.75 *** (0.13)
1.05 *** (0.09)
-0.17 *** (0.03)
-0.07 (0.05)
-0.16 *** (0.03)
-0.01 *** (0.00)
βs2,loc βs0,Jac
0.36 (0.79)
βs1,Jac
1.61 (1.17)
0.65 (1.80)
-0.31 ** (0.15)
0.07 (0.52)
-0.69 (0.57)
-0.03 (0.04)
βs2,Jac βs0,urb
(4)
-2.24 *** (0.38)
βs1,urb
-0.96 *** (0.33)
-0.44 (0.49)
-0.71 *** (0.31)
0.22 *** (0.09)
0.01 (0.16)
0.16 ** (0.08)
0.02 * (0.01)
βs2,urb F-statistic
109.01 (12)
276.83 (15)
268.72 (18)
278.66 (14)
Sargan-statistic
33.32 (26)
35.23 (52)
26.68 (78)
38.19 (52)
p-value AR(1)
0.00
0.87
0.95
0.61
p-value AR(2)
0.39
0.39
0.33
0.36
(1)
(2)
(3)
(4)
1.64 *** (0.26)
0.97 *** (0.39)
1.66 *** (0.25)
-0.18 *** (0.05)
0.05 (0.13)
-0.18 *** (0.05)
Idem table 2.6.
Table 2.10: Vehicles βs0,loc
1.58 *** (0.21)
βs1,loc
-0.02 (0.01)
βs2,loc βs0,Jac
-1.46 *** (0.60)
βs1,Jac
-0.84 (0.93)
-1.07 (1.47)
-0.03 (0.11)
0.07 (0.45)
-1.53 *** (0.50)
-0.11 (0.70)
-1.54 *** (0.50)
0.14 (0.09)
-0.33 (0.24)
0.14 (0.09)
-0.01 (0.03)
βs2,Jac βs0,urb
-1.05 *** (0.44)
-1.87 *** (0.33)
βs
1,urb
0.03 (0.02)
βs2,urb F-statistic
67.25 (12)
205.47 (15)
197.56 (18)
204.87 (14)
Sargan-statistic
64.51 (26)
47.38 (52)
47.22 (78)
47.18 (52)
p-value AR(1)
0.00
0.01
0.04
0.00
p-value AR(2)
0.81
0.64
0.65
0.63
Idem table 2.6.
3
Table 2.11: Textiles & clothing and footwear (1) βs
0,loc
2.07 *** (0.25)
βs1,loc
(2)
(3)
1.68 *** (0.16)
0.75 *** (0.21)
1.34 *** (0.18)
-0.17 *** (0.05)
0.13 ** (0.07)
-0.08 *** (0.03)
-0.02 *** (0.00)
βs2,loc βs0,Jac
6.15 *** (0.99)
βs1,Jac
4.67 *** (0.91)
-1.03 (1.24)
-0.46 *** (0.17)
1.38 *** (0.34)
2.07 * (1.09)
-0.13 *** (0.02)
βs2,Jac βs0,urb
(4)
-2.43 *** (0.36)
βs1,urb
-1.52 *** (0.30)
0.27 (0.37)
-0.83 *** (0.27)
0.13 * (0.07)
-0.46 *** (0.11)
-0.01 (0.04)
0.04 *** (0.01)
βs2,urb F-statistic
90.85 (12)
259.08 (15)
269.18 (18)
241.93 (14)
Sargan-statistic
28.22 (26)
36.12 (52)
27.10 (78)
39.64 (52)
p-value AR(1)
0.00
0.17
0.34
0.04
p-value AR(2)
0.86
0.90
0.93
0.92
(1)
(2)
(3)
(4)
1.79 *** (0.19)
1.02 *** (0.23)
1.78 *** (0.19)
-0.15 *** (0.06)
0.12 (0.09)
-0.14 *** (0.06)
Idem table 2.6.
Table 2.12: Construction βs0,loc
2.12 *** (0.24)
βs1,loc
-0.02 *** (0.01)
βs2,loc βs0,Jac
1.30 *** (0.41)
βs1,Jac
0.91 * (0.54)
-0.27 (0.85)
-0.06 (0.07)
0.34 (0.24) -0.03 * (0.02)
βs2,Jac βs0,urb
0.48 (0.35)
-2.38 *** (0.31)
βs
1,urb
-1.45 *** (0.27)
-0.19 (0.33)
-1.38 *** (0.26)
0.08 (0.07)
-0.36 *** (0.11)
0.05 (0.07)
0.04 *** (0.01)
βs2,urb F-statistic
87.60 (12)
228.40 (15)
229.43 (18)
220.42 (14)
Sargan-statistic
27.41 (26)
34.81 (52)
31.80 (78)
34.55 (52)
p-value AR(1)
0.00
0.03
0.16
0.02
p-value AR(2)
0.56
0.95
0.75
0.97
Idem table 2.6.
4
over time. In the next section, this conjecture will be confirmed through an analysis of the localisation parameter. 2.5: Empirical results To get an impression of how agglomeration externalities develop over time, we first ran regressions with parameters that were allowed to vary for each time period. Given the fact that the first two observations must be used to construct lags and instruments, estimates are available from 1861 to 1971, excluding 1941. Figures 2.1 to 2.3 in Appendix 2.B show graphs of the yearly point estimates for each industry. These estimates should only be seen as indicative. Due to the high number of coefficients, precise estimation is impossible. Moreover, time dummies have been omitted to avoid multicollinearity. The data have been de-trended, however, by incorporating a constant into the equation in differences.52 Keeping in mind these reservations, the graphs are suggestive of specific long-term patterns. Localisation externalities seem to be decreasing linearly over time, whereas urbanisation externalities in at least half of the industries are clearly increasing, although in a more parabolic than linear way. Jacobs externalities do not reveal any stable pattern across industries. To generate more precise estimates, we must restrict the number of coefficients. In Tables 2.6 through 2.12, estimates for four different models are presented. The first column shows the estimates with no time-variation in the coefficients. The second column introduces a linear specification of all parameters, whereas the third takes a quadratic functional form with respect to time for equation (2.13). For the final column, a mixture of parameterisations is chosen. That is, we have chosen a functional form that is as parsimonious as possible, without loss of important data features. For example, if the estimate on the quadratic term of an externality is not significant, it is reduced to a linear shape. For Jacobs externalities, neither linear nor quadratic representations seemed necessary in most estimations, so in column (4), Jacobs externalities are assumed to be constant over time. Looking at column (1) in which externalities are assumed to be constant, localisation externalities are present in all industries. Six out of seven estimates are larger than 1, indicating explosive growth processes. Regions with a lead have been able to maintain their lead and even expand it. Urbanisation externalities are significant but negative, suggesting congestion effects. Evidence on Jacobs externalities is mixed; Metal manufacturing & metal goods not elsewhere classified (henceforth: n.e.c.), Textiles & clothing and footwear and Construction exhibit positive Jacobs externalities. Vehicles, on the contrary, have negative Jacobs externalities. The other industries do not show any significant influence of local diversity. However, in most of the estimates in column (1), Sargan statistics are rather high at typically around 35, which is significant 52 These estimates use Roodman’s (2005) xtabond2 procedure in STATA for difference equations. All other estimates are calculated using the regular built-in xtabond procedure.
68
at the 5% level. This raises some doubts about the adequacy of the model specification. This problem does not arise in models (2) – (4), indicating that time-varying models do pass miss-specification tests. In most industries, Jacobs externalities can be modelled as constant over time. The exceptions are Shipbuilding and marine engineering and Textiles & clothing and footwear. With regards to Shipbuilding and marine engineering, the evidence in column (2) suggests that diversity had a strong and positive influence in the first year, 1861, but this positive effect then declines rapidly. For Textiles & clothing and footwear, the most adequate estimates may be found in column (3), where all externalities are assumed to change parabolically over time. Jacobs externalities increase from a positive value in 1861 until sometime between 1881 and 1891, at which point they reach a maximum before they start declining. Overall, Jacobs externalities seem insignificant in most industries. In the Vehicles industries, Jacobs externalities are even significantly negative. The mixed results regarding the effect of Jacobs externalities perhaps is not too surprising. As discussed in section 1.4, Jacobs externalities are often considered beneficial for young or renewing industries (e.g. Henderson et al. 1995). Yet, over the course of a century, industries will go through several periods of renewal. Without detailed knowledge of the industries’ technological trajectories, pinning down the exact periods of renewal is difficult. This is even more complicated when the industries are rather broad sectors as in this study. Considering localisation and urbanisation externalities, a linear specification proves to be most adequate. In column (3), either the parameter estimates for the quadratic term are insignificant, or the implied minimum or maximum lies outside the sample period. In the latter case, the parabolic specification does not change the qualitative nature of the evolution of externalities; as in the linear specification, the values for in-sample years either rise or decline monotonically. As the first two years of the sample are lost in the generation of instruments and lags, the in-sample values of t range from 3 to 14. On this interval, for most industries, the quadratic function implies about the same yearly estimates of localisation and urbanisation externalities as does the linear function. The only real differences are generated at the edges, where the quadratic function generates rather extreme values. Only in the case of with regards to Instrument engineering does estimating a parabola for urbanisation externalities makes a real difference. At first, the trend is declining, until the lowest point in 1901, after which urbanisation externalities start increasing again increasing. Concentrating on column (2), the impact of localisation externalities is surprisingly similar across all industries. Implied point estimates in 1861 are above or around 1.53 This means that all industries start out with explosive growth paths: regions with a lead expand their lead, while lagging regions are left further behind. However, localisation externalities decline, as indicated by a negative estimate on βs1,loc. Given the confidence intervals, it is difficult to plot an exact trajectory, but by and large, the benefits of local 53 The only exception is Shipbuilding and marine engineering, for which the implied point estimate in 1861 is 0.5.
69
specialisation decline. This gives some support for the contention that advances in transport and communication technology have eroded the advantages of local, countylevel, specialisation. Inputs can be sourced from farther away given the tremendous decline in transportation costs that took place over this period. In the decades between 1841 and 1971, the existing modes of transportation were supplemented by a number of newer technologies. For instance, a frenzy of investments in the 1840s led to a formidable expansion in railroads in Britain (e.g. Mitchell 1964), just ten years after the first modern style railway between Liverpool and Manchester opened in 1830. With the introduction of the lorry some 70 years later, road haulage revolutionised transportation again (e.g. Scott 2002). At the same time, innovations in shipbuilding steadily lowered freight rates for transport over water (see Harley 1988 on ocean freight rates). Moreover, the spread of inventions like the telephone facilitated long-distance supplier relationships, while the availability of mass media may also have contributed to the spread of knowledge across long distances, thereby increasing the spatial reach of knowledge spillovers. However, as argued before, our analysis can only be speculative with regards to the exact causes of the decline in localisation externalities. For urbanisation externalities, time trajectories are opposite to those of localisation externalities. Large population density has a negative effect in the nineteenth century: βs0,urb in column (2) is negative across all industries. Halfway through the sample period in 1911, the average estimate for the linear specification across all industries is -0.46. This indicates that decreasing the log of population density with one standard deviation yields a 42% increase in employment. However, due to relatively large standard errors, the estimate is not very precise. Such diseconomies in the nineteenth century and beginning of the twentieth century may reflect difficulties in managing congestion. Without modern public transportation systems, production in densely populated cities incurred high costs. Similarly, a lack of proper sanitation systems in the nineteenth century increased the risk of diseases. However, the negative effects of urbanisation become smaller over time as βs1urb is found to be positive. The cost penalty associated with producing in cities declines. This could again be explained by innovations in transportation technologies. Especially for the mostly rather heavy industries considered in this chapter, congestion gives rise to high costs in inner-city transportation. With new technologies to cope with these costs, such as railway infrastructure and lorries, the benefits of being located in urban areas may have started counterbalance the disadvantages. Similarly, other problems related to cities, such as fires and diseases, were increasingly adequately addressed over the decades. This must have reduced congestion diseconomies as well. However, this analysis again only allows for speculation with regards to the causes of the observed dynamics. Robustness The estimations incorporate both time and county dummies. Any time-invariant county variables that are omitted, such as climate, the availability of raw materials or culture, should therefore not bias the outcomes. The same holds for all variables that 70
are specific to the industry in a certain year: time dummies should correct for national business cycles and inflation. Using a GMM procedure, parameter estimates are derived from minimising the sum of moment restrictions. Sets of compatible moments give rise to small minima. A large Sargan statistic, therefore, indicates that some of the instruments contradict each other. However, the models in columns (2), (3), and (4) have Sargan statistics that are not significantly different from zero, even at the 5% level. Therefore, the Sargan statistic does not raise doubts about the validity of the models in those columns. Furthermore, according to the reported F-statistics, the variables in all models do have significant explanatory power; that is, we can reject that the outcomes are the result of random variation. A third test concerns the autoregressive structure of disturbances. The first-differencing involved in the GMM procedure should result in significant firstorder autocorrelation in disturbances. However, second-order autocorrelation should be absent. In 19 out of 28 estimations, first-order autocorrelation is significant at the 5% level. Second-order autocorrelation is not significant in any of the estimations. This is taken as additional evidence for the adequacy of the econometric models. A further robustness check is carried out by leaving out the first year of the sample. The measurements in 1841 are reported to be of a lower quality than the rest of the data (Lee 1979). The general patterns already observed remain.54 A possible problem lies in the number of lags of the dependent variable used as instruments. Experimenting with this, we found that for lags larger than 3, the Sargan statistic for over-identifying moment restrictions turns significant, indicating that these instruments are invalid. Adding more instruments would also lead to an imbalance in the ratio of the number of moment equations to the number of observations.55 We therefore only use lags 2 and 3 as instruments. Results are not changed when lag 3 is left out and only lag 2 is used to construct instruments. Finally, we also ran regressions in which we measured variety levels in terms of the HHI of other manufacturing employment. The HHI is a lack-of-diversity measure, whereas the entropy index is a genuine diversity indicator, and so the sign of the coefficients on the Jacobs externalities changes between specifications. However, all other parameter estimates remain unaffected. 2.6: Conclusion The literature on agglomeration externalities has investigated the influence of the local environment on the economic performance of regional industries in a large number of studies. However, in previous studies, externalities were assumed to be stable across the entire sample period. As the time period sometimes covers several decades, this assumption can be questioned. In the case of Britain, this study shows that externalities have changed tremendously between 1861 and 1971. Using a parsimonious time-varying representation of externality parameters, results indicate that localisation 54 Results available on request. 55 See the discussion in Arrellano (2003, pp. 169-170)
71
externalities decline over time, whereas urbanisation externalities increase. This finding is remarkably stable across industries. In six out of seven industries, localisation externalities at first give rise to explosive regional growth dynamics. If localisation externalities stayed at these levels, an industry would concentrate in one county and leave all other counties. However, in all industries, localisation externalities decrease over time, slowing down and even at times overturning tendencies towards complete concentration. This picture is confirmed by the evolution of Gini coefficients. In the first part of the sample, the Gini coefficients rise as regional inequalities grow. Later on, however, Gini coefficients go down, which is consistent with a de-concentration of the industry. Urbanisation externalities are at first negative in all seven industries. However, over time, urbanisation externalities become increasingly less negative. This outcome is confirmed for all industries investigated. The fact that localisation externalities decrease over time may be caused by advances in transportation technologies. Due to the long time-series we use in this chapter, we cover the birth of both the railway system and motorised road and water transportation. The drop in urbanisation diseconomies might be caused by similar events. Inner-city transportation systems were upgraded as much as those between cities. Moreover, advances in medicine and sanitation certainly made cities more liveable. However, our analyses do not take such information into consideration, and thus, we must be cautious about attributing our findings to specific historical events or tendencies. The findings on Jacobs externalities are more erratic, and no stable pattern arises. Jacobs externalities are often thought to benefit young and renewing industries. As we argued in section 1.4, inter-industry spillovers are likely to be most important for industries going through radical technological changes. Without any information about the timing of these events, predicting the pattern of Jacobs externalities may be all but impossible. In conclusion, externalities do not appear to be stable over time. Localisation externalities and urbanisation externalities have undergone pronounced changes in the nineteenth and twentieth centuries. Neglecting this fact will bias estimations. Nevertheless, the results presented in this chapter are no more than stylised facts. It is therefore worthwhile to investigate variations over time more closely. One interesting research agenda would involve matching changes in infrastructure and communication technology as well as changes in the organisation of firms to the evolution of agglomeration externalities. As outlined in section 1.4, on a more disaggregated level of industrial classification, we moreover expect the technological trajectories of an industry to affect the strength of agglomeration externalities. This topic of the links between the technological development stages of an industry and agglomeration externalities is dealt with next in chapter 3.
72
Appendix 2.A: List of industries The dataset we have used in this chapter distinguishes between the following 24 industries:
Agriculture, forestry and fishing Mining and quarrying Food, drink and tobacco Coal and petroleum products & chemicals and allied industries Metal manufacture & metal goods not elsewhere classified Mechanical engineering Instrument engineering Electrical engineering Shipbuilding and marine engineering Vehicles Textiles & clothing and footwear Leather, leather goods and fur Bricks, pottery, glass, cement, etc. Timber, furniture, etc. Paper, printing and publishing Other manufacturing industries Construction Gas, electricity and water Transport and communication Distributive trades Insurance, banking, finance and business services Professional and scientific services Miscellaneous services Public administration and defence
73
Appendix 2.B: Yearly estimates of agglomeration externalities Note: Some years have been dropped due to collinearity.
1971
year
1971
1961
1951
1941
1931
1921
1911
1901
1891
1881
1871
1861
0
1851
1
1841
parameter estimate
2
year
-1
-2
-3
-4 Metal manuf. & metal goods n.e.c. Mechanical engineering Instrument engineering Shipbuilding and marine engineering
Vehicles Textiles & clothing and footwear Construction
Figure 2.1: Yearly point estimates of localisation externalities
1961
1951
1941
1931
1921
1911
1901
1891
1881
1871
1861
0
1851
1
1841
parameter estimate
2
-1
-2
-3
-4 Metal manuf. & metal goods n.e.c. Mechanical engineering Instrument engineering Shipbuilding and marine engineering
Vehicles Textiles & clothing and footwear Construction
Figure 2.2: Yearly point estimates of Jacobs externalities 74
5
3
2
1971
1961
1951
1941
1931
1921
1911
1901
1891
1881
1871
1861
0
1851
1
1841
parameter estimate
4
year
-1
-2 Metal manuf. & metal goods n.e.c. Mechanical engineering Instrument engineering Shipbuilding and marine engineering
Vehicles Textiles & clothing and footwear Construction
Figure 2.3: Yearly point estimates of urbanisation externalities
75
CHAPTER 3 AGGLOMERATION EXTERNALITIES AND THE INDUSTRY LIFE CYCLE
3.1: Introduction In the agglomeration externalities literature, it is commonly understood that diversified cities offer different benefits as compared to specialised cities. A host of statistical-empirical studies have focused on the trade-off between diversification and specialisation. So far, the empirical evidence on this matter is surprisingly inconclusive. We already showed in the preceding chapter that agglomeration externalities should not be treated as forces that are constant. Rather, they shift and change over time. In this chapter, we take this research one step further. Agglomeration effects are often associated with knowledge spillovers. At the same time, we know from the industry life cycle literature that the innovation processes in an industry change throughout the course of an industry’s life cycle. Therefore, the scope and type of knowledge spillovers should in part depend on the industry life cycle stage of an industry. The main question we seek to answer in this chapter is whether the maturity of an industry determines which types of agglomeration effects arise. In fact, the connection between the maturity of the technology used in an industry and the type of agglomeration effects that an industry should experience has been made already in earlier research. The framework we propose is compatible with theoretical notions like nursery cities (Duranton and Puga 2001) and is in line with the oft stated conjecture that externality estimates for high-tech industries differ from low-tech industries (e.g. Henderson et al. 1995; Combes 2000; Feser 2002; Henderson 2003).56 However, to our knowledge, no econometric study has yet systematically investigated whether variations in agglomeration externalities can be explained by theories of industrial evolution. In this chapter, we use one single database that covers Industry Life Cycle (ILC) stages across twelve different industries. The data constitute a panel of 70 Swedish cities over the period 1974 to 2004.
56 The nursery cities concept will play a central role in chapter 5, where we determine the effect of agglomeration externalities on plant survival.
77
The estimation framework mimics a production function approach. However due to a lack of data on some production factors, we will not assess the influence of agglomeration externalities on total factor productivity, but rather on the productivity of labour. A number of challenges that arise in empirical work in the field of agglomeration externalities are addressed. Most prominent among these are the Modifiable Areal Unit Problem (MAUP) and the problem of time-invariant regressors in panel data fixed effects models. Moreover, in order to disentangle the effects of factor costs and knowledge spillovers, we use both agglomeration indices and variables capturing differences in factor costs across cities. The outcomes of the analyses corroborate the prediction that changes in agglomeration externalities can be well understood in the context of industry life cycle developments. In particular, our estimates show that young industries benefit from being located in high-cost, high-diversity locations. When moving towards mature industries, however, the benefits shift gradually to producers located in low cost, specialised locations. In the remainder of this chapter, we first briefly discuss the literature on agglomeration externalities. Next, we turn to the ILC concept and show how it may be used to structure our expectations about the strength of different types of agglomeration externalities. In section 3.4, we describe the dataset and explain how we determined the life cycle stages of the twelve industries. In section 3.5, we discuss the econometric specification. Section 3.6 describes the data and presents the main results of our regression analyses. In section 3.7 we summarise the main conclusions and discuss some directions for future research. 3.2: Agglomeration externalities Agglomeration externalities can be defined loosely as the benefits a firm derives from being located close to other economics actors (see, for an extensive overview, Rosenthal and Strange 2004).57 Often, a distinction is made between three types of externalities: localisation, Jacobs, and urbanisation externalities.58 These types of externalities can be linked to opportunities for social learning and the level of factor costs in a city. Urbanisation externalities are benefits experienced by firms located in large cities. On the one hand, large cities offer access to large markets (either locally, or because they are hubs in international infrastructure networks), highly educated employees, and a wealth of business services and research centres. On the other hand, large cities represent high cost environments, with considerable congestion, high wages, and high land prices. Localisation externalities arise when firms benefit from a strong local specialisation in their own industry. In the Marshallian tradition (Marshall 1920), localisation 57 For a concise expose on the different research traditions of urban economic growth and diversity, see Quigley (1998). We focus on the empirical debate that started in the 1990s. 58 A fourth type of externality arises from a contest between local producers for excellence and innovation (Porter 1998). However, the intensity of competition is hard to quantify. Therefore it is not included here.
78
Clients
Service providers City A
City B
Figure 3.1: Diversity and focus externalities arise from three sources: labour market pooling, input-output linkages and intra-industry knowledge spillovers. A large local industry is able to grow and sustain a highly skilled specialised labour force, and has lower matching costs between employers and employees (e.g. Duranton and Puga 2004). It will also attract many specialised supplier and client firms, resulting in lower transport costs and inventories. Moreover, spatial proximity to suppliers and customers facilitates joint innovation efforts along the value chain. Between competitors, knowledge spillovers occur through imitation and skill transfers that are greatly facilitated by face-to-face contacts between geographically proximate actors (Storper and Venables 2004). In contrast to localisation externalities, Jacobs externalities arise when firms benefit from the presence of a high level of industrial diversity. Local diversification gives rise to opportunities for combining knowledge across industries (Jacobs 1969). Frequently, industries face problems in their production processes that have close analogues in other industries. Solutions that are applied in one industry can, in these cases, often be readily adapted to solve problems in other industries. Moreover, a diversified regional economy increases the likelihood of serendipitous inter-industry knowledge spillovers to arise. Industrial diversity also results in more stable demand conditions and allows firms to choose from a wide range of local input substitutes, which reduces their exposure to price fluctuations in inputs.59 Although congestion and high factor costs in large diversified cities may give rise to negative externalities, according to the discussion above, diversity per se should benefit local industries. However, in some empirical studies, diversity appears to have a negative effect on local economic performance. Examples can be found in some of the industries studied by Henderson (2003), and in some heavy manufacturing industries in Combes (2000). Both authors make note of these findings, but they do not probe their meaning or causes. We argue that, in fact, Jacobs externalities should be expected to become negative if they lead to a lack of focus in local services and amenities that are not specific to a particular industry. Cities of a given size can only sustain a limited number of suppliers of such services and local governments can tailor their services only to a limited number of industries. As a result, in cities with little industrial variety, general services, i.e. services that are not specific to one particular industry but are
59 A formalisation of the benefits of diversity can be found in the love-of-variety models that use Dixit-Stiglitz (Dixit and Stiglitz 1977) production or consumption functions (see for example Duranton and Puga 2004).
79
Table 3.1: Agglomeration externalities and their origins Factor costs
Knowledge and skills
Market conditions
urbanisation
land rents wage premium congestion
highly skilled employees knowledge infrastructure
market access
localisation
matching costs labour market minimise inventories
specialised labour force
access to specialised clients and suppliers
transportation costs within the value chain Jacobs
low risk environment
intra-industry knowledge spillovers joint innovation efforts within the value chain inter-industry knowledge spillovers
love of variety lack of focus
shared among firms in many different industries, can be better adapted to demands of the local industries. Figure 3.1 shows how this works in the case where multiple industries use the services of a limited number of providers of business services. It depicts two small cities of equal size that have just enough economic activity to sustain two marketing agencies. The squares in the upper part are the client firms, with different shadings for each industry. The squares in the lower part represent the service providers. In city A, each agency can specialise in the provision of services to two industries. In contrast, in city B, each agency needs clients from four different industries in order to generate sufficient income. For marketing agencies in city B, it is much harder to adapt to the needs of all its clients than for those in city A. Arguably, this can make a great difference when the demands of industries are rather specific, and do not change too much over time. If service providers are able to specialise, there should be an opportunity to adjust to these specific needs of each customer. However, if there are too many different customers, the service providers cannot develop the capabilities to offer specialised services.60 Table 3.1 summarises the different sources of urbanisation, localisation and Jacobs externalities, differentiating between knowledge spillover effects and the effects of factor costs. 60 Evidence in support of this line of reasoning can be found in one of the results in Combes et al. (2004). The authors use both a Herfindahl-Hirschman Index (HHI) capturing the evenness of the employment distribution across local industries and a count of the number of active industries in the region. The former yields positive effects of diversification, whereas the latter turns out to harm performance. This suggests that, optimally, a region hosts a small number of equally sized industries.
80
Since the seminal articles by Glaeser et al. (1992) and Henderson et al. (1995), the statistical-empirical literature investigating the impact of localisation, Jacobs, and urbanisation externalities has expanded rapidly. Unfortunately, though, as we already saw in chapters 1.2.3 and 2.2, these efforts have not yet resulted in a complete understanding of agglomeration externalities. Also Feldman’s (2000) literature review about the connections between innovation and location notes that there is wide divergence in the empirical results on the importance of localisation economies. Glaeser (2000) reaches similar conclusions when it comes to the difference between the impacts of concentration and diversity, respectively. A reason for the lack of convergent outcomes may be that studies differ widely in methodology: plant level versus regional studies, panel data versus cross-section analyses, and productivity versus employment regressions. Moreover, samples are drawn from different periods in history and relate to different geographic areas in the world. De Groot et al. (2009) review 31 studies containing over 200 parameter estimates. In a meta-regression, the authors find that sample issues as well as methodological issues affect outcomes. We argue that another important factor that may be causing divergence of outcomes is industrial heterogeneity. Referring to a Vernonian product life cycle view of regional development, it is often hypothesised that product development takes place in large, diversified cities, whereas production takes place in smaller-yet-specialised cities (e.g. Henderson 2003). Duranton and Puga (2001) formalise this conjecture in their nursery cities concept. We agree that specialised cities and diversified cities may be attractive for different industries. Indeed, we argue that this can best be understood by drawing from the literature on industry life cycles.61 3.3: Industry life cycles and agglomeration externalities As we described in chapter 1.3.3, the industry life cycle framework (ILC) (e.g. Gort and Klepper 1982; Klepper 1997) is a stylised description of the evolution of an industry from infancy to decline. In this section, we rehearse the most important characteristics of the ILC approach and then connect these to the discussion on agglomeration externalities. The archetypical evolution of the output in an industry follows a logistic (or S-) curve. The industry starts with the introduction of a new product. This is followed by a period of strong expansion of production. After a while, markets get saturated and the expansion levels off. Eventually an industry may even go into a period of decline. The ILC literature has grown into an extensive body of work with many detailed descriptions and subtleties. In this section, we restrict the discussion to three aspects 61 In the 1980s, the ILC approach was widely applied in economic geography to explain the rise of new industries in new growth regions (Boschma 1997). Moreover, Audretsch and Feldman (1996b) find evidence that the propensity of innovative efforts to cluster spatially is shaped by the characteristics of the life cycle stages.
81
Table 3.2: Industry characteristics at different stages of the industry life cycle Life cycle stage of industry Young
Mature
Innovation intensity
High
Low
Type of innovation
Product
Process
Mode of competition
Product
Price
of industry life cycle stages: type of innovation, innovation intensity, and mode of competition. Table 3.2 summarises how an industry changes as it moves from a young to a more mature stage. The birth of a new industry typically follows from radical innovations that result in new products. The young stage is characterised by the development of an immature technology. Innovation intensity is high, as there are many unexplored technological opportunities. Because standardisation has yet to set in, large discontinuities in a technological sense are not uncommon. Therefore, as argued by Gort and Klepper (1982), information about innovation(s) can come from a wide range of sources in these stages, often from outside the young industry’s population of firms. Interindustry knowledge spillovers associated with Jacobs externalities should be of utmost importance to these young industries. To improve their products, these industries need – and can accommodate – ideas from a large variety of fields of knowledge. Another characteristic of young industries is that firms tend to compete on the basis of the quality of their new products instead of their price. Therefore, they are not very sensitive to factor-cost differentials between regions. Due to the immaturity of the production process, the exact requirements in terms of infrastructure and services are still changing substantially in young industries. Moreover, due to their young age, firms in young industries have not yet had sufficient time to develop strong linkages with other economic actors in the city. As a result, young industries are usually not able to get local providers of business services to focus on their specific needs or to begin to successfully lobby the local government to develop special infrastructure and institutions in the region. Consequently, local embeddedness may be only of secondary importance for these industries and, therefore, it is likely that they are largely unaffected by a lack of focus that can manifest itself in Jacobs environments. Finally, the scale of non-standardised production in young industries is typically small. As a consequence, one should not expect strong urbanisation benefits because of access to a large market. However, access to a highly qualified labour force and the concentration of lead users that can be found in large cities should be valuable to these industries. The net effect of urbanisation is, however, uncertain. After a period of experimentation, the industry reaches more mature stages and disruptive technological jumps become less likely. A dominant design (Abernathy and Utterback 1978) allows for standardisation of production. This opens up opportunities to exploit division of labour and economies of scale. Products get more homogenous, 82
Table 3.3: Agglomeration externalities and life cycle dynamics Life cycle stage of industry Young
Mature
urbanisation factor costs
high land rents high wages congestion knowledge highly skilled labour force knowledge infrastructure market conditions access to large market access to sophisticated market
0 0 0 + + 0 +
0 + + 0
localisation
factor costs
low matching costs labour market low inventories low transportation costs within the value chain knowledge large specialised labour force high intra-industry knowledge spillovers easy joint innovation efforts within the value chain market conditions easy access to specialised clients and suppliers
0 0 0 0 + 0
+ + + + + +
0
+
factor costs
+ 0 + +
0 0 0
Jacobs
large variety of services and goods lack of focus knowledge high inter-industry knowledge spillovers market conditions reduced volatility in demand and supply
output volumes rise, and firms engage increasingly in price competition. This leads to a sharp drop in prices that enlarges the client base from early adopters to the wider general public. More attention is diverted to lowering factor costs, whereas the mechanisation of the production process lowers the demand for highly educated labour. However, access to large markets and international infrastructure networks is a prime concern in these large-scale industries, suggesting there may, overall, be an important role for urbanisation externalities. As technological opportunities become exhausted, R&D efforts shift towards process innovation in order to increase efficiency. Process innovations mostly require specialised, industry-specific machines, skills and knowledge. Inter-industry spillovers become less likely. The value of a local focus increases as the possibilities to tailor the local education system, infrastructure and many other aspects of the local environment grow (Grabher 1993). This may penalise high-diversity environments. Both tendencies lead to lower Jacobs externalities. Furthermore, standardisation supports the development of a common language and technology framework across firms, facilitating the orchestration of innovation efforts along the value chain. Similarly, industry-specific knowledge can now be carried more easily across firm boundaries by labour mobility. Therefore, the opportunities for intra-industry (localisation) spillovers rise. 83
The ILC description of industry development is highly stylised. In practice, industries could rejuvenate after a radical innovation that has far reaching consequences for the industry and which casts the industry back to more infant stages. Moreover, at a higher level of industrial aggregation, various technological trajectories are often stacked and overlap with one another. This may obfuscate the life cycle and prevent an industry from progressing through each of the stages in the described order. However, the basic characteristics in each stage are still the same, whether an industry really is new or just rejuvenated. Table 3.3 merges the elements of Tables 3.1 and 3.2 to summarise this discussion of the interaction between agglomeration externalities and life cycle dynamics. In the rows, externality types and their different sources are listed. In the columns, we describe how the influence on the competitiveness of local industries changes between negative, neutral and positive, when moving from young to more mature industries. 3.4: Data and industry life cycle stages Data The data used in this study cover all Swedish manufacturing plants with five employees or more (1968-1989) or with at least five employees belonging to firms that employ at least ten people (1990-2004).62 All plants in the dataset are classified according to the Swedish SNI-code system at the 5-digit level (similar to the SIC classification). Due to a change in this system, we had to merge some 5-digit industries. For these industries, the classes correspond roughly to the 3- or 4-digit level.63 The geographical location of plants is known at the municipality level (there are 277 municipalities in our dataset).64 This provides us with a high quality database containing detailed information about the development of the Swedish economy from the late 1960s up to 2004. Calculation of potentials As the unit of our analysis is the local industry, we aggregate plant-level data into spatial units. A classical problem occurs when simply summing micro-level data up to regional units: outcomes of analyses based on such data are often subject to change when regional borders are redrawn. Moreover, there are many qualitative differences between regional units. For one, the area of individual regions varies greatly. Another issue is that some regions are multi-core regions, whereas other regions are dominated by one large city. Moreover, Swedish municipalities are, in many cases, too small in terms of population to exhibit the kind of agglomeration externalities discussed in the literature (e.g. Glaeser et al. 1992). For these reasons, we construct metropolitan62 The databases were provided by Statistics Sweden. We have run several algorithm-based data cleaning procedures and parts of the data were checked by hand. Information can be obtained from the authors. 63 This was the case for Chemicals, Furniture, Metalware, Paper, Publishing, and Textiles. 64 We have cleaned the data both employing algorithms and manually. Information can be obtained from the authors.
84
area data for 70 Swedish labour market regions (so-called functional or A-regions). Most regions are dominated by a single large city, but some contain two or more equal sized cities. Agglomeration externalities in multi-core regions should be weaker than their combined size suggests, but stronger than what may be expected from each city separately. Simply attributing all economic activity to a single point in space would therefore overstate the size of externality potentials, whereas focusing only on the largest city would understate them. Instead of committing ourselves to one of these extremes, we calculate potential measures for the largest cities in each region. The lowest spatial level we can distinguish is the municipality. Typically, this consists of a town and some surrounding hamlets or villages. Therefore, it is not unreasonable to assume that all economic activity takes place at the location of the central town. Using a road-distance matrix, we construct a spatially weighted sum of the contributions from all municipalities in Sweden to the largest town in each A-region. This gives us a potential measure for the 70 “capital” cities in Sweden. Take as an example the number of plants. Let: M: A: Pmit : dmc :
set of all municipalities in Sweden set of all A-region-capitals in Sweden number of plants in municipality m∈M in industry i at year t road-distance between the municipality core, m, and the A-region core, c∈A
Now the “plant-potential” in industry i for A-region-capital c is calculated as follows: Pcitpot =
∑ f (δ , d )P
m ∈M
mc
mit
where f(d,dmc) is a distance decay function.65 Analogously, we can calculate a population-potential, an employment-potential and a valued added-potential for each of the 70 cities. However, if we were to apply the potential-calculations to the dependent variable in a regression analysis, we would artificially create spatial autocorrelation. Therefore, when calculating potentials for the dependent variable, we set the contributions of municipalities outside the A-region equal to zero. We do the same for the employment variable as this will proxy the scale of the inputs used to produce the output of a local industry. For all other variables, contributions from all Swedish municipalities are used.
65 We choose an exponential decay that gives a 1% weighting to places 100 km. away. Within a circle of 10 km surrounding the A-region-capital, decay is assumed to be zero.
85
Next, we add data on housing prices, acquired from Statistics Sweden.66 The housing price indicators, however, are not spatially weighted and reflect the housing prices in the 70 capital cities. Industries and lifecycles In total, our dataset distinguishes between 102 different industries that can be followed consistently over time. Most of the industries are small and are present in only a handful of labour market regions. As this would cause additional estimation problems, we focus on 12 major industries. These 12 account for some 44% of total Swedish manufacturing output in 1974 and for 42% of such output in 2004. A major challenge is to find an adequate way to determine the life cycle stages of an industry in each year. Gort and Klepper’s (1982) method relies on changes in net entry rates into an industry. However, due to the limited number of firms that are active in a small country like Sweden the entry or exit of a single plant changes the net entry rate considerably, making entry-exit data too volatile for our purpose. Instead, we determine the stage of the life cycle by looking at the age of plants in the industry. Technology is to a large degree embedded in machinery, which is costly to replace. More importantly, new technologies require new routines. Firms usually have to struggle hard to change routines (e.g. Nelson and Winter 1982). For both reasons, we argue that old plants generally use older technologies than young plants. If an industry is in a stage of strong technological renewal – i.e. if the industry is young or recently rejuvenated – mature plants become obsolete and young plants are able to capture large shares of the market. In contrast, if the industry is in a stage with a stable technological trajectory, older plants are less threatened by new entrants and will retain a larger share of the market. Defining old plants as plants that are ten years and older, we calculate the market share of old plants for all industries in our dataset. To control for changes in the overall plant turnover over the years, we divide the old-plant market shares of each industry by the market share of old plants in the economy as a whole. This yields the over or under representation of old plants in a particular industry. Next, we normalise this index by subtracting the mean and dividing by the standard deviation across all industries. Let the maturity index be:
I it =
VAold VAtot it it old tot VAt VAt
66 The data on housing prices are based on sales prices for smaller houses, available at the municipality level. Before 1981, only growth rates in housing prices at the province level and for major metropolitan areas (11 regions in total) are available. We use these growth rates to impute housing prices for each municipality, assuming that housing prices in all municipalities that belong to the same region experience the same growth rate. Between 1974 and 1981, our local housing prices are therefore only estimates.
86
where: VAoldit : value added in old plants in industry i at year t VAtotit : value added in all plants in industry i at year t VAoldt : value added in all old plants in Sweden at year t VAtott : value added in all plants in Sweden at year t The normalised maturity index is now: I itnorm =
I it − mean(I it ) stddev (I it )
We distinguish between three levels of maturity: young, intermediate, and mature. In order to obtain a roughly equal number of observations for each type, we use -0.3 and +0.3 as demarcation values. Using a five-year moving average to control for business cycle volatility, Table 3.4 shows, for each year, the life cycle stages for the twelve industries in our study. Industries may move through several stages, such as Other plastics which progresses through young as well as intermediate and mature stages. However, please note that industries close to the maturity threshold may shift repeatedly between categories.67 The general picture shows, in line with our intuition, that Textiles, Sawmilling, Carpentry, Furniture, Paper and Chemicals have been rather mature industries over the entire course of the past three decades. Publishing and Communication underwent rejuvenation in the 1990s. Electric motors had entered a young stage already in the 1980s. Other plastics, in contrast, slides into maturity. To a lesser degree, the same holds for Metal ware. The Instruments industry has been classified as a young industry for all years in our sample. 3.5: Estimation framework In order to measure the size of externalities, we estimate a Cobb-Douglas like production function for city-industries. Output is measured by value added. Due to a lack of data on local capital stocks, the only inputs in the production process at our disposal are employment data. We therefore use the employment potential as a proxy for the scale of inputs in the local industry. However, this variable also captures the influence of labour market pooling effects that constitute one of the Marshallian externalities. In the end, we arrive at the following multiplicative model: (3.1) VAcitpot = Tcit (Lcitpot ) ε cit α
where: VAcitpot : Value added potential produced by city c in industry i at year t pot Lcit : Labour potential employed by city c in industry i at year t
67 As the threshold is arbitrary, we test the sensitivity of results to changes in this threshold at the end of section 3.6.
87
Textiles
Sawmilling
Carpentry
Furniture
Paper
Publishing
Chemicals
Other plastics
Metalware
Electric motors
Communication
Instruments
Table 3.4: Definition life cycle stages
1974
2
2
2
2
3
2
2
1
1
3
2
1
1
young
1975
2
2
2
2
3
2
2
1
1
3
2
1
2
intermediate
1976
2
2
2
2
3
2
2
1
1
3
2
1
3
mature
1977
2
2
2
2
3
2
2
1
1
3
2
1
1978
2
2
2
2
3
2
2
1
1
3
2
1
1979
2
3
3
2
3
2
2
1
1
3
2
1
1980
3
3
3
2
3
2
2
2
1
3
2
1
1981
3
3
3
3
3
2
2
2
1
3
2
1
1982
3
3
3
3
3
2
2
2
1
3
2
1
1983
3
3
3
3
3
3
2
2
1
3
2
1
1984
3
3
3
3
3
3
2
1
1
1
3
1
1985
3
3
3
3
3
3
2
1
1
1
3
1
1986
3
3
3
3
3
2
2
1
1
1
3
1
1987
3
3
3
3
3
2
2
1
1
1
3
1
1988
3
3
3
2
3
2
2
1
1
1
3
1
1989
3
3
3
2
3
1
3
2
1
1
3
1
1990
2
3
3
2
3
1
3
2
1
1
2
1
1991
2
3
3
2
3
1
3
2
1
1
2
1
1992
2
3
3
2
3
1
3
2
1
1
2
1
1993
2
3
3
2
3
1
3
2
2
1
2
1
1994
2
3
3
2
3
1
3
2
2
1
2
1
1995
3
3
3
2
3
1
3
2
2
1
1
1
1996
3
3
2
3
3
1
3
2
2
1
1
1
1997
3
3
2
3
3
1
3
3
2
1
1
1
1998
3
3
2
3
3
1
3
3
2
1
1
1
1999
3
3
2
3
3
1
3
3
2
1
1
1
2000
3
3
2
3
3
1
3
3
2
1
1
1
2001
3
3
2
3
3
1
2
3
2
1
1
1
2002
3
3
2
3
3
1
3
3
2
1
1
1
2003
3
3
2
3
3
1
3
3
2
1
1
1
2004
3
3
3
3
3
2
3
3
2
1
1
1
88
Tcit : �Technology term. This term contains the externality effects for city c in industry i at year t. We will now turn to the elements that make up the technology term. Urbanisation externalities are measured by the population potential: POPULATION ct =
∑ f (δ , d )POPULATION
m∈M
mc
mt
We, we would like, however, to disentangle the different aspects of big cities implicit in urbanisation externalities. We therefore control for two other factors. The first is the overall wage level in the city. For this purpose, we construct for each industry the relative wage level in a city compared to the corresponding national level. We next construct a weighted average, using local employment in each industry as a weight:
WAGEct = ∑ i
pot Lcit wcit pot Lct wit
where pot and Lctpot = ∑ Lcit i∈ I
wcit: average local wage paid in industry i. w it: average Swedish wage paid in industry i. The resulting index is equal to one if average wages in the city are equal to average wages in the whole of Sweden, keeping constant the composition of industries. As this index is calculated across all 102 manufacturing industries in the economy, the influence of the wage level of a single industry is negligible. The problem of using a wage index is that the wage level in a city reflects both variations in the cost of living across cities, and differences in the premium that is paid for the quality of the local workforce. We would like to distinguish between the cost and quality-of-labour effect. As rents account for a large portion of household expenditures, the higher costs of living in big cities are to a large degree accounted for if we control for housing prices (HOUSEct). We will assume that if we keep housing prices constant, the remaining variation in the wage index is due to differences in quality of labour. Localisation externalities have been modelled in various ways in the literature. Levels or shares of own industry employment are widely used indicators (e.g., Glaeser et al. 1992; Henderson et al. 1995; Henderson 1997). However, these indicators do not differentiate between plant-internal and plant-external economies of scale. In the extreme case, where all the employment in a city-industry is located in a single
89
plant, the effects of local employment are fully attributable to internal economies of scale. The number of plants, in contrast, can only give rise to external economies of scale.68 Henderson (2003) argues that the number of plants is a good measure for capturing localisation externalities. His reasoning is that each plant can be interpreted as an experiment with a specific variation on the industry’s production process. The potential of intra-industry knowledge spillovers depends therefore on the local of those number experiments, and not so much on the number of the local industry’s employees. Moreover, workers acquire more industry-specific skills if they can become employed and educated in different local firms. The number of plants also measures the number of potential innovation partners in the own industry. For these reasons, we measure the scope for knowledge spillovers in localisation externalities as the numberof-plants potential in the local industry:
LOC cit =
∑ f (δ , d )P
m ∈M
mc
mit
where: Pmit : the number of plants in municipality m, industry i at year t. Jacobs externalities result from the presence of a large diversity of industrial activity in a city. To quantify this, many authors use an index that measures the evenness of the distribution of economic activity across different local industries, like the HirschmanHerfindahl index (HHI) or the entropy index of local employment shares. These measures try to convey information on the number of spikes in the distribution and their relative height in one number. However, this is not an ideal way of measuring the potential of local diversity to give rise to new combinations of ideas. Constellations with very different spillover potentials may yield the same index.69 If we think of each local industry as representing a specific field of knowledge that is available to other firms in the city, the number of significant industries in a city is a more adequate measure. We call an industry’s presence in a region significant if its size reaches a certain threshold. As we argued before that spillovers are related to the number of experiments carried out by different plants, we base the Jacobs externalities indicator on the number of plants potential.70 JACOBS ct = ∑ g ∑ f (δ , d mc )Pmit ≥ 10 i m ∈M
68 The effect of the number of plants while holding local employment constant can also be interpreted as the effect of average plant size. However, average plant size is not very informative in our study as plant sizes are very skewed. Therefore, we do not attribute any specific meaning to this interpretation. 69 E.g., the HHIs for the employment sets {100,20,20,20} and {100,100,9,9} are about the same. 70 We set this threshold at ten plants, but also experiment with different threshold values and variants based on employment. This has hardly any impact on the outcomes.
90
where g(⋅) is an indicator function that evaluates to 1 if its argument is true and 0 otherwise. Assuming that all externalities and control variables enter the technology term in a multiplicative way, after a log transformation, we arrive at the following log transformed estimation equation:71 (3.2) log (VA citpot ) = α log (Lcitpot ) + β1 log (POPULATION ct − 2 ) + β 2 log (WAGEct ) + β 3 log (HOUSE ct ) + β 4 log (LOC cit − 2 ) + β 5 log (JACOBS cit − 2 ) + log (ε cit )
The effects of local learning will only be felt after a certain amount of time. We therefore used a two year time lag for all variables that mainly capture knowledge spillovers.72 To meet the aim of the study, we must discover how externalities differ across ILC stages. We therefore pool observations across all industries and make coefficients dependent on the particular ILC stage. We end up with a panel of 70×12 city-industries for 31 years. Adding city-industry fixed effects and year dummies, we get: (3.3) log (VAcitpot ) =
α s log (Lcitpot )+ β1s log (POPULATION ct − 2 ) + β 2s log (WAGEct ) + β 3s log (HOUSE ct )+ β 4s log (LOC cit − 2 ) + β 5s log (JACOBS cit − 2 ) + η ci + δ t + log (ε cit )
where the superscript s indicates the life cycle stage, ηci are city-industry fixed effects and dt are year fixed effects. 3.6: Empirical results Table 3.5 shows the main descriptive statistics for our dependent variable, log(VA), and for the six regressors which have also been log transformed. Table 3.6 contains the correlations between the regressors. As a baseline, we estimate the effects of externalities without distinguishing between life cycle stages using a fixed effects (FE) estimation. The outcomes are shown in column (1) of Table 3.7. The estimate for employment (L) is very close to 1, indicating constant returns to scale. Localisation externalities are positive and have an elasticity of about 2%, meaning that a doubling of the number of own-industry plants leads to efficiency gains of 2%. As a comparison, 71 The model can also be interpreted as a labour productivity model. To arrive at this model, we subtract log(Lcit ) from both sides of the equation to arrive at:
(
)
( )
pot pot log VAcitpot Lcit = (α − 1)log L cit + β1 log (POPULATIO N ct − 2 )+ β 2 log (WAGEct )
β 3 log (HOUSE ct ) + β 4 log (LOC cit − 2 )+ β 5 log (JACOBS cit − 2 )+ log (ε cit )
The coefficient on labour, a-1, reflects now both internal and external economies of scale. 72 Different lag structures have been tried, but outcomes are very similar to the ones we present here.
91
Table 3.5: Descriptive statistics standard deviation
log(VA) L LOC JACOBS POPULATION WAGE HOUSE
mean
min
max
between
within
ratio
10.15 4.55 0.48 0.75 10.95 0.01 6.09
-3.77 -9.36 -34.86 0.00 9.08 -0.60 4.56
17.82 10.04 5.76 3.33 13.80 0.26 8.31
2.13 1.97 2.38 0.67 0.73 0.04 0.28
0.98 0.73 1.12 0.26 0.04 0.03 0.50
2.17 2.71 2.12 2.54 17.45 1.29 0.55
Variables as defined in section 3.5 and log transformed. Final column contains ratio of between-group to within-group standard deviation.
this estimate ranges from 2% to 8% in Henderson (2003). Jacobs externalities seem to be absent. The point estimate for urbanisation externalities (POPULATION), is high, but the standard error is large as well. The reason for this can be derived from Table 3.5. The population of a city changes only very slowly over time, which gives rise to a very low within-group standard deviation. However, the between-group standard deviation is high as, from one city to the other, population potentials vary widely. In FE models, the between-group variation in variables is ignored which explains the imprecise estimates. Including the extra information on wages and housing prices (column (2), Table 3.7) does not improve the situation. One way to increase the precision of the estimates is using random effects (RE). RE models exploit the cross-sectional information of a panel in the between-group equation. However, RE models have to assume that the unobserved city-industry fixed effects are uncorrelated with the regressors. Theoretically, it is hard to defend this assumption, as many historical aspects of a city may still influence the productivity of its industries. Column (3) presents the results. The population estimate is small but negative, and the standard error drops tremendously. The other parameter estimates have remained more or less the same. However, a Hausman test on the adequacy of the RE model rejects the RE specification at any conventional significance level. This leaves us with a dilemma: on the one hand, FE will not enable us to get precise estimates on one of our core variables; on the other hand, RE has not passed the Hausman test. Theoretically, the Hausman-Tailor procedure (Hausman and Taylor 1981) could be applied. However, the fact that, for this method, one must find variables that can be convincingly thought of as a priori uncorrelated with the city-industry effects, makes this method problematic (Arellano 2003, p. 44).
92
Table 3.6: Correlations between regressors L LOC JACOBS POPULATION WAGE HOUSE
L
LOC
JACOBS
POPULATION
WAGE
HOUSE
1.000 0.663 0.283 0.263 0.123 0.054
1.000 0.351 0.323 0.176 0.062
1.000 0.764 0.408 0.168
1.000 0.641 0.359
1.000 0.082
1.000
Variables are as defined in section 3.5 and log transformed.
A different solution has been developed by Plümper and Troeger (2007). These authors use a procedure originally proposed by Hsiao (2003).73 In their Fixed Effects Vector Decomposition (FEVD) method, variables can be modelled as either time-varying or as (predominantly) time-invariant. The coefficients of time-varying variables are estimated without bias. However, the estimates of the effect of time-invariant and slowly changing variables are biased, as already noted by Hsiao (2003). This bias can be interpreted as a between-group (cross-sectional) omitted variable bias and therefore depends on the correlation between the time invariant variables and the cityindustry effect. As the city-industry effects are unobserved, it is impossible to assess this correlation. However, Plümper and Troeger show that for a wide range of values, in small samples, the FEVD estimator outperforms the FE, RE and Hausman-Taylor estimators in terms of the Root Mean Squared Error (RMSE). In other words, the increased efficiency more than offsets the modest bias in the estimates. In our study, the superiority of the FEVD depends on two factors: first, the correlation between the city-industry effects and the regressors that we regard as slowly changing, and, second, the ratio of between-group to within-group standard deviations of the slowly changing variables. Looking at Tables 3.5 and 3.6, population is clearly a slowly changing variable, with a between-within ratio of over 17. As POPULATION is strongly correlated with JACOBS, and a sizeable part of the variation in JACOBS is actually cross-sectional, omitting JACOBS from the residuals would give rise to a large omitted variable bias in the second step of the FEVD procedure. Column (4) in Table 3.7 shows the estimates for the FEVD specification where POPULATION and JACOBS are modelled as slowly changing variables. The estimates are similar to the RE estimates. The time-varying variables, L, LOC, HOUSE and WAGE, are all indistinguishable from their FE estimates in column (2). However, the standard errors of FEVD estimates are considerably lower. Jacobs externalities are 73 In the first step, they estimate a fixed effects model. The residuals of this equation now contain two components: the unobserved city-industry effects and a part that can be explained using variables with no or very little variation over time. In the next step, the authors regress these residuals on the time-invariant and hardly changing variables, and decompose them into two parts: an unexplained part and a part explained by the time-invariant and hardly changing variables. In the final step, the complete model is rerun without the fixed effects, but this time with estimates of the unexplained part of the city-region effects obtained in the second step to estimate the correct standard errors.
93
Table 3.7: Outcomes L
(1)
(2)
(3)
(4)
0.999 *** (0.004)
0.998 *** (0.004)
1.015 *** (0.004)
0.998 *** (0.002)
L_Y L_I L_M LOC
0.019 *** (0.004)
0.019 *** (0.004)
0.017 *** (0.004)
LOC_I LOC_M 0.014 (0.011)
0.014 (0.011)
0.009 (0.010)
JACOBS_I JACOBS_M 0.138 * (0.079)
0.124 (0.090)
-0.002 (0.020)
POPULATION_I POPULATION_M 0.149 (0.102)
0.144 (0.098)
WAGE_I WAGE_M
HOUSE_Y HOUSE_I HOUSE_M
94
0.000 (0.023)
0.008 (0.020)
0.008 * (0.004) 0.013 *** (0.005) 0.022 *** (0.005)
0.015 *** (0.004) 0.021 *** (0.005) 0.027 *** (0.005)
0.019 ** (0.009) 0.006 (0.009) -0.053 *** (0.008)
-0.004 (0.009) 0.014 * (0.008) -0.052 *** (0.008)
-0.029 *** (0.010) 0.042 *** (0.010) 0.038 *** (0.010)
0.009 (0.008) 0.007 (0.008) 0.023 *** (0.008)
0.522 *** (0.114) -0.136 (0.116) 0.074 (0.102)
0.341 *** (0.112) 0.008 (0.113) 0.092 (0.100)
0.149 ** (0.072)
WAGE_Y
HOUSE
1.013 *** (0.004) 0.998 *** (0.004) 0.986 *** (0.003)
0.018 ** (0.009)
POPULATION_Y
WAGE
1.008 *** (0.004) 0.998 *** (0.004) 0.985 *** (0.003)
-0.017 *** (0.006)
JACOBS_Y
POPULATION
(6)
0.019 *** (0.003)
LOC_Y
JACOBS
(5)
0.000 (0.012) 0.069 *** (0.014) -0.063 *** (0.015) -0.027 ** (0.014)
Nobs N average T Rsq
(1)
(2)
(3)
(4)
(5)
(6)
17424 753 23.10 0.873
17424 753 23.10 0.873
17424 753 23.10 0.873
17424 753 23.10 0.970
17424 753 23.10 0.970
17424 753 23.10 0.970
***: p1 Cˆ ij
will be dealt with later on, when we develop a Bayesian extension of the method. Indirect links With the method outlined above, we can calculate an entire matrix of relatedness indices for all possible combinations of classes. If such a matrix is to be an adequate representation of the relatedness between classes, its elements must maintain a certain level of transitivity with respect to each other. That is, if class j is very similar to class m and class m is very similar to class i, then class i is probably also very similar to 77 As a matter of fact, we define RR in such a way that we can predict these variations without any error. All remaining variation is attributed to variation in the RR. In practice, however, this means that we will measure RR with some error. In this sense, our method is not different from any of the other methods encountered in the literature. 78 As the vast majority of class combinations has zero links, using a rule that takes the 90th percentile of all class combinations, including those with zero links, will most likely result in k being equal to zero.
109
class j. To our knowledge, the first authors to exploit such information inherent in all relatedness matrices are Bryce and Winter (2006). Like Teece et al. (1994), they use the hypergeometric approach to calculate a relatedness matrix based on the industrial portfolios of firms. This yields non-zero estimates for many industry combinations. Bryce and Winter then use shortest path analysis to calculate the relatedness for all pairs of industries that have zero co-occurrences. We share the opinion that a relatedness matrix contains much valuable indirect information. However, Bryce and Winter’s shortest path analysis is an ad hoc fix that lacks a solid theoretical foundation. Moreover, Bryce and Winter treat each finding of zero co-occurrences between a pair of industries as an error that must be fixed. This amounts to assuming that all industries are in some way or another related to each other, but that firms somehow overlooked this opportunity for diversification. We take a different approach to the indirect information in relatedness matrices. Let us assume that we have a situation where many of the estimated RR indices are equal to zero. If we concentrate on one of the class pairs that yield zero relatedness, it is not necessarily the case that this zero is an imperfect measurement caused by a lack of information. An estimate of zero may just indicate that the classes are unrelated. Therefore, it is also not obvious that we should change all zero relatedness estimates and instead use an indirect estimate of relatedness. Nevertheless, it may still be the case that we do not observe any co-occurrences because we only expect a very small number of actors to investigate a specific combination of classes. The count data procedure may even predict the number of investigating actors to be smaller than 1, suggesting that zero relatedness is caused by a lack of investigating actors. In such a case, an estimate of zero relatedness becomes questionable. As a matter of fact, all estimates for which the predicted number of investigating actors is small are necessarily imprecise. For combinations of classes with a low predicted number of investigating actors, it therefore does make sense to use the indirect relatedness information that is contained in the matrix as a whole. Let us depict a class as consisting of a number of elements. For example, an industry can consist of a number of production processes, or use a number of skills. These skills are not necessarily unique to the industry, as they could be used in other industries as well. The greater the overlap in the elements of two classes, the more the classes are related to each other. Figure 4.1 shows the set of skills used in three different industries i, m and j. Let us now assume that we are unable to directly estimate the relatedness from i to j because the predicted number of actors investigating this combination is very small. However, let us also assume that it is possible to assess the relatedness between m and j and between m and i, respectively. The outcomes are depicted in Figure 4.1 to the right. Product m is quite similar to product j, as most of j’s elements are also part of m: RRmj = 66%. We can therefore use m as a proxy for j.79 According to our estimate of 79 Note that we use RRmj because this expresses the number of elements that are found in both m and j as a percentage of the number of elements of j. The reason for this is that we assume that the decision to effectuate
110
Skill base product i
RRmi = 0.33
Skill base product m
RRim = 0.25
Skill base product m
RRjm = 0.50
Skill base product j
RRmj = 0.66
I
II
Figure 4.1: Graphical representation of skill base overlap for products i and m, and products m and j RRim , 25% of m’s elements are also present in i. Our best guess is that the same must be true for j, because m is very similar to j. Therefore, we would guess that RRij = 25%. The closer m is to j as measured by RRmj , the more confident we will be. Hence, a sound strategy for deriving indirect information on a pair of classes, (i,j), is to look for a class m for which relatedness with both i and j is reliably measured and that is very related towards j. In this case, the relatedness from i to m can be used as a proxy for the relatedness from i to j: RRij = RRim. Adding second-step estimates: Bayesian updating By now, we have developed two different ways of estimating the RR index of (i,j). Nonetheless, in some situations, there might also be other relatedness matrices available that were constructed in quite different ways. For example, we may use expert opinions. Or, there may be an input-output-based relatedness matrix. The main difference with the indirect estimates is that it is not clear how the numeric values can be compared to the first-step, frequentist RR indices. All the same, it is possible to use regression analysis to relate the first-step RR indices to such an external relatedness matrix.80 The main question would however be how to merge this information with the information that is present in the observed co-occurrences. For this, we reformulate the estimation model in a Bayesian framework. As notation becomes somewhat cumbersome, we drop the subscripts in this section. Let us return to equation (4.1) in which we express the probability of observing a co-occurrence conditioned on the number of investigating actors. Making it explicit a link from i to j depends on how many elements of j are shared by i. Therefore, the denominator of the percentage should be the number of elements of j. 80 The main problem is that we need relatedness estimates that are measured in the same units as the RR index. One way to do that is to use a regression analysis of the first-step estimates on the external relatedness matrix. The predicted values of such an estimation would be expressed in RR units. As the RR matrix contains proportions data, which are always between 0 and 1, standard methods are not appropriate. However, methods have been developed for such data (e.g. Papke and Wooldridge 1996).
111
that we do not know RR and dropping subscripts, our likelihood function – the probability of observing l co-occurrences, given RR and C – is: c
(4.13) P (L = l RR = r , C = c )= (r )l (1 − r )c −l l
where we define c ≡ 0 l
if c1 gives rise to a symmetric distribution with maximum probability density on the mean of ½. a=b0 Γ(a ) Γ(b)
Filling in (4.13) and (4.17) in (4.15), we arrive at the following expression (details can be found in Appendix 4.A): (4.18) P (RR = r L = l , C = c )= (r ) l + a−1 (1 − r )c −l +b−1
Γ(a + c + b) Γ(l + a ) Γ (c − l + b)
We have now expressed the probability distribution of RR in terms of the number of observed co-occurrences, the information present in the intermediate estimates (as captured by a and b) and the number of investigating actors, C. C is, however, unobserved. Therefore, in a final step, we have to remove the conditioning on C. To achieve this, we treat C as the outcome of another binomial process. The number of actors in the originating class, class i, is a known variable. We also know how many actors we would expect to investigate the co-occurrence from i to j. If for the moment we reintroduce the subscripts and use the expression for the mean of a binomial process, we get: (4.19) E(Cij)= Ni qij where Ni is the number of actors in class i, and qij is the probability that they will investigate the co-occurrence to j. Setting this expected value equal to our estimates for Cij , we can calculate qij . As the probability distribution of Cij is binomial, dropping subscripts again yields: N
(4.20) P (C = c ) = (q)c (1 − q)N−c c
We can use this expression together with the law of total probability to remove the conditioning on C in equation (4.18). Appendix 4.B shows a detailed derivation. The end result of this is that we can calculate a Bayesian variant of Revealed Relatedness as the expected RR given the number of observed links.84 c N β (a, b, c, l ) q c (1 − q)N−c l c l+a ⋅ N (4.21) E (RR L = l )= ∑ ~ ~ c N ~ c =l a + c + b β (a, b, c~, l )q c(1 − q)N−c ~ ∑ c~=l l c N
the indirect estimate. After some experimentation, we decided that this is best accomplished by choosing the minimum of a and b to be equal to 2 and at the same time to have a/(a+b) equal to the value of the indirect estimate. 84 As we remarked at the end of our discussion of the first-step estimates, the frequentist approach cannot cope with cases in which the observed number of links exceeds the expected number of links. In contrast, in our Bayesian approach, Lij can take any value between 0 and Ni without causing any problems. We can therefore now also calculate the RR indices for which Lobs >Ĉij. ij
113
where: β (a, b, c, l ) =
Γ(l + a ) Γ(c − l + b) , with Γ (⋅) the Gamma function. Γ(a + b + c )
4.4: An application: Calculating RR based on the product portfolios of plants Diversification as a branching process A better understanding of relatedness between industries would be valuable to many economic applications. In strategy research, an extensive literature argues that multiindustry firms are active in industries that share certain commonalities (e.g. Teece 1982; Teece et al. 1994; Breschi et al. 2003). This suggests that firms tend to expand their business by moving into industries that are related to their current activities. As a result, the growth of a firm’s portfolio resembles a branching process in which future expansion builds on competences that were gathered in the past, as described in Penrose (1959). As coherent portfolios are thought to exploit economies of scope, they should be more efficient than incoherent portfolios. Teece et al. (1994) invoke the survivor principle according to which economic competition weeds out inefficient organisations, and surviving organisations display, as a consequence, efficient practices. Accordingly, studying the portfolios of surviving firms sheds light on which industries share many commonalities. Our application is similar to the one in Teece et al. (1994). However, while Teece and his colleagues look at firms that own plants in different industries, we look at different products that are produced in one and the same plant. We argue that there are a number of reasons why firms produce several different products that are not linked to the technology used in production processes. For example, portfolio construction at the firm level may reflect marketing economies or risk diversification strategies. In holding companies and large conglomerates, access to cheap capital, superior management capabilities and cross-financing may play a key role in the determination of the portfolio. However, at the plant level, such considerations are less important. It is likely that products are built in the same plant, because the production processes involved are similar. Similarity in skills and routines embodied in human capital as well as similarities in physical capital, such as machinery and raw materials, will generate economies of scope at the plant level and therefore make joint production of products attractive. However, it is unlikely that two products for which production processes have no commonalities whatsoever will be produced in the same production facility. Rather, it may make sense to use separate production locations to avoid the different production process interfering with each other. Therefore, a RR matrix based on plant portfolio data is likely to reflect relatedness at the level of the production processes and the technologies involved. Data and implementation The database we use contains information on products produced in thousands of plants in all manufacturing industries across Sweden. As we are interested in the relatedness between industries, we translate these product codes into industry codes. Over the entire sampling period, about 57% of all observed plants produce products in 114
only one industry. The vast majority of plants that are active in multiple industries are only active in two industries (22% of all plants). In the regional analysis presented in section 5 of this chapter, we use data on all 70 Swedish labour market regions, or A-regions. These data we take from a database that covers all manufacturing plants in Sweden with more than five employees in the period from 1968 to 1990. From 1990 to 2002, the sample is limited to plants with more than five employees belonging to firms with over ten employees. For our zero-inflated negative binomial regressions, we use industry aggregates at the Swedish level. The database on the product portfolios provides us with the total sales value of each product in each plant, which we then aggregate to the sales level of industries at the national level. The number of active plants, total profit, total valuedadded and total number of employees are taken from the database we also use in the regional analysis. Again, we add up all plant-level data to arrive at national industry aggregates. With these data, we predict the number of co-occurrences in every single year. These predictions are then used as described in section 4.3. Often, a plant produces some main products and a couple of minor by-products. We can thus rank the industries in which a plant is active according to the sales value of the products involved. The industry in which the highest sales value is generated is taken to be the core business of the plant. This hierarchy can be used to establish the direction of co-occurrences: co-occurrences are defined as links that run from the core industry towards the other industries. The implicit assumption is that non-core products are kept in a portfolio because their production processes are relatively simple extensions of the production processes used in the production of the core products. However, it may also be the case that all products in a portfolio share commonalities. If this is true, each combination of two products in a portfolio represents a co-occurrence, but it is impossible to establish the direction of links. In total, we end up with between 10,000 (in 1970) and 2,500 (in 2000) directed (asymmetric) co-occurrences and between 63,000 (in 1970) and 17,700 (in 2000) undirected (symmetric) co-occurrences. We also create versions of our RR matrix that are based on such undirected co-occurrences.85 In these versions, all possible combinations of two industries in a portfolio are administered as a co-occurrence. To make sure our intermediate (indirect) estimates are reliable, we calculated them using only the elements (i,j) of our first-step RR matrices for which we predicted more than ten co-occurrences.86 Otherwise, the intermediate estimates would be based on evidence too weak to improve the first-step estimates. The correlation between our intermediate and first-step estimates is strong: across the entire sample, the rank 85 In general, using undirected co-occurrences does not necessarily lead to symmetric RR matrices. This depends on the exact specification of the zero-inflated negative binomial model. Moreover, the indirect estimates introduce asymmetry as well. To arrive at symmetric matrices, we must therefore symmetrise the RR matrix by imposing RRsym(i,j)=max(RR(i,j);RR(j,i)). 86 Moreover, we demand that the estimated relatedness between the proxy industry m, and j, RR(m,j), is over twice the average of all relatedness estimates that were based on at least one co-occurrence. This ensures that m is a strong proxy for j.
115
116
Isolated nodes in the Southwest corner
Musical instruments
Marine engines
Non ferrous metals 1
Plastic containers
Tires (2)
Tar paper
Publishing (1)
Wallpaper
Corrugated board
Paper (2)
Paper (1)
Pulp (3) Hats
Apparel Shirts
Fur (2)
Womens clothing (1)
Matches
Fur (1)
Mens clothing
Pottery
Machinery repair
Fabrics
Coated textiles
Tanneries
Tires (1)
Fibreboard
Brooms Earthenware
Butchery
Other food Mill prod
Meat
Starch
Malt
Animal feeds
Liquor
Softdrinks
Chocolate
Fish
Coffee
Glass containers
Bread
Pastry
Dairy
Cliches
Newspapers
Ornamental glass
Printing
Bookbinding
Glass products
Confectionary
Fruit and vegetables
Sugar cube
Poultry
Petroleum
Glass
Paper containers
Paper articles
Ice cream
Pulp (2)
Margarine
Sulphite alcohol Concrete prod 2
Gas
Pesticide
Food oils
Resins
Plaster
Oils
Paper (3)
Other chemicals Medicines
Concrete
Chemicals (1) Paints
Chemicals (2) Soap Plastic
Fertilizer
Mineral prod nonmet
Footwear
Narrow fabrics
Knitwear
Garments
Leather clothing
Carpets
Batteries
Clay products Mineral wool Other textiles Spinning
Rubber
Plastic prod
Textile furnishing Textile finishing Underwear
Leather Textile goods Rope
Pulp (1) Sewing
Sporting goods
Wooden building
Outerwear
Womens clothing (2)
Tobacco
Wine
Ethyl
Board
Other manufacturing
Watches
Cars Machinery parts
Abrasives
Bulbs Office eqt Household appliances Ships Iron casting Paper machinery Pumps Wood machinery Lifting machinery Boats Structural metal Metal machinery Mining machinery Consumption metal Electrical machinery Wood Communication Car motors Railroad eqt Cables Other casting Jewellery Wires Industrial machinery Engines Other machinery Metal containers Non ferrous metals 2 Argicultural machinery Iron and steel Bikes Wooden containers Wooden furniture (1) Metal furniture Aircrafts Scientific eqt Metal prod Metal prod Building joinery Computers Cutlery Bolts Ink Alloys Sawing Transport eqt Other electricals Household metalware Wooden furniture (3) Electrical appliances Cement Wooden furniture (2) Plywood Railroad eqt repair Wood products Optics Other manufacture Explosives Petroleum prod
Fabricated metal products, machinery and equipment: R&D intensive
Fabricated metal products, machinery and equipment
Basic metal industries
Non-metallic mineral products
Chemicals and chemical petroleum, coal, rubber and plastic products
Pulp, paper and paper products
Wood and wood products
Textiles, wearing apparel and leather industries
Food beverages and tobacco
LEGEND
Stoneworking
Figure 4.2: Industry Space in 1970
Isolated nodes in the Southwest corner
Musical Instruments
Railroad eqt repair
Boats
Machinery repair
Household applicances
Abrasives
Stoneworking
Cement
Glass containers
Tires (2)
Sulphite alcohol
Newspapers
Wooden furniture (3)
Wooden furniture (2)
Wooden containers
Wooden buildings
Fur (2)
Sewing
Fur (1)
Textile finishing
Ethyl
Coffee
Pastry
Other manufacturing
Plywood
Brooms
Board
Explosives
Other manufacture
Shirts
Apparel
Womens clothing (1) Footwear
Wallpaper
Fibreboard
Fabrics
Tar paper
Corrugated board
Pulp (2)
Resins
Tobacco
Paper articles
Paper (3)
Ink
Paper (1)
Pulp (1)
Pulp (3)
Liquor
Concrete Food oils
Medicines
Malt
Ice cream Wine
Dairy
Other food
Animal feeds
Bread
Confectionary
Fish Meat
Butchery
Matches
Glass
Sugar cube Mill prod
Starch
Concrete prod 2
Chocolate Fruit and vegetables
Margarine
Paints
Non ferrous metals 2 Glass products
Softdrinks
Plaster
Chemicals (2)
Other chemicals
Pesticide
Paper (2)
Soap Oils
Chemicals (1) Gas
Petroleum prod
Mineral wool
Fertilizer
Petroleum
Paper containers
Other textiles
Plastic
Wires
Printing
Clay products
Household metalware Alloys
Non ferrous metals 1
Metal prod
Mineral prod nonmet
Earthenware
Ornamental glass
Railroad eqt
Mining machinery
Electrical appliances
Other electricals
Iron and steel
Bulbs
Bookbinding
Outerwear
Garments
Spinning
Cliches
Womens clothing (2) Carpets
Wood products
Hats
Coated textiles
Textile furnishing
Knitwear
Leather
Rope
Batteries
Cutlery
Plastic containers
Plastic prod
Metal prod
Communication
Pumps
Lifting machinery
Ships
Jewellery Metal machinery Industrial machinery Consumption metal Electrical machinery Engines Aircrafts Other machinery Computers
Optics
Metal furniture
Narrow fabrics
Rubber
Bolts
Office eqt
Iron casting
Paper machinery
Watches
Argicultural machinery Scientific eqt
Wood machinery
Machinery parts
Car motors
Structural metal
Bikes
Cables
Cars Marine engines
Sporting goods
Mens clothing
Underwear
Sawing
Publishing (1)
Tanneries
Leather clothing Textile goods
Building joinery
Wood
Pottery
Wooden furniture (1)
Tires (1)
Fabricated metal products, machinery and equipment: R&D intensive
Fabricated metal products, machinery and equipment
Basic metal industries
Non-metallic mineral products
Metal containers Other casting
Transport eqt
Chemicals and chemical petroleum, coal, rubber and plastic products
Pulp, paper and paper products
Wood and wood products
Textiles, wearing apparel and leather industries
Food beverages and tobacco
LEGEND
Poultry
Figure 4.3: Industry Space in 2000
117
correlation between the elements of the intermediate RR matrix and the first-step RR matrix are above 0.40 for every year and typically around 0.50.87 However, we use the intermediate estimates only if the frequentist estimates are based on predictions of ten or less co-occurrences. In other instances, we do not expect the intermediate estimates to improve the frequentist estimates. To smooth our relatedness matrices, we take 3-year moving averages of the RR matrices. General properties of the relatedness industry networks: symmetric links Our estimated RR matrices allow us to regard industries as nodes in a network of relatedness links. We call this complete network industry space, as an analogy to Hidalgo et al.’s (2007) concept of product space. Below, we visualise different instances of industry space using a spring embedded algorithm.88 This algorithm treats the industry nodes as equally charged particles that exert a repulsive force on each other. However, the industries are attached to each other with springs the rigidity of which reflects the strength of RR links between them. This results in a field of forces that scatters industries across the entire plane, but in such a way that closely related industries are also located closely together in that plane. If two industries are visually close, this can be interpreted as that they are located close to each other in industry space. Figure 4.2 displays industry space for Sweden in 1970 using the symmetric RR matrix. Each node (here, each circle) represents an industry, while ties represent the 1,500 strongest RR links in 1970. We have applied a colour scheme that shows the 2-digit family of each node according to the Swedish SNI69 industrial classification system. In 1970 industry space, the pattern of industries clearly follows the 2-digit classification. Nodes that share a colour are, in general, clustered closely together. On a first glance, we would therefore say that the RR measure classifies industries in a similar way as the SNI69 hierarchy. However, there are also quite a number of exceptions to this. For example, members of the Non-metallic mineral products industry are scattered across a large part of industry space. The quality of the match between the SNI69 hierarchy and the RR matrix can be quantified by calculating the correlation between the relatedness matrix derived from the SNI69 hierarchy89 and the RR matrix.90 For 1970, 87 In the asymmetric case, correlations are considerably weaker, but the number of elements that meet the criteria for recalculation are also considerably smaller. 88 The graphs are made using the software packages UciNet and NetDraw (Borgatti et al. 2002, Borgatti 2002). For a description of the spring embedded algorithm, we refer to the help file of these packages. 89 We construct a SNI69 relatedness matrix by counting for each combination of two industries the number of shared digits. For example, the relatedness between an industry 311200 and 321000 is equal to 1, whereas the relatedness between industries 345209 and 345202 is equal to 5. 90 In the remainder, correlations between two relatedness matrices are calculated as the average rank correlations of their columns. Reported variances do not refer to the variance in the estimate of this rank correlation coefficient but rather to the variances of the rank correlations across columns. The variance therefore expresses how much the correlation between two relatedness vectors differs across industries.
118
we find an estimated average rank correlation of 0.43 with a variance of 0.04 across the columns of the matrices. In other decades, we obtain similar estimates (see Table 4.7 in Appendix 4.C), which confirms our impression that the RR matrix and the SNI69 hierarchy yield similar pictures. This is quite remarkable, as the RR calculations make no use whatsoever of the hierarchical relations within the SNI69 system. At the same time, however, the correlation is low enough to conclude that there are also some marked differences. Apart from such differences, industry space also offers some information that cannot be derived from the SNI69 classification. For example, Pulp, paper and paper products and Fabricated metal products, machinery and equipment are mostly located in the first and second quadrants. Wood and wood products and Textiles, wearing apparel and leather industries clusters are positioned in the second and third quadrant, whereas Chemicals and chemical petroleum, coal, rubber and plastic products and Food, beverages and tobacco clusters are located in the fourth quadrant. This shows where the clusters around the various 2-digit industries are located relatively to each other. As an example, Basic metal industries are positioned closely to the Fabricated metal products, machinery and equipment industries, whereas many members of the Non-metallic mineral products industry are more closely related to industries in the Chemicals and chemical petroleum, coal, rubber and plastic products cluster. Zooming in on the borders between two clusters, we see that these borders are quite fuzzy. Some of the Pulp, paper and paper product industries are located along the lower rim of the Food, beverages and tobacco and Chemicals and chemical petroleum, coal, rubber and plastic products clusters. This indicates that these industries are rather related to chemicals, whereas this is less true for other industries, such as Printing and Newspapers. Finally, it is possible to zoom in on an individual industry, and assess its position relative to all other industries. Here we can observe, for example, that Explosives takes a central position in industry space. Another example is the Communication industry, which in 1970, is located quite far from other technologically advanced industries. For comparison, the industry space in 2000 is depicted in Figure 4.3.91 By and large, the clusters that existed in 1970 are also present in 2000. However, there have been important changes. For instance, the Fabricated metals, machinery and equipment cluster has becomes more diffuse, but the R&D-intensive industries within this cluster have moved closer together and towards centre of the cluster. This suggests that there has been an increased specialisation within the industries of Fabricated metals, machinery and equipment, but it is beyond the scope of this chapter to explore this issue further. Although there is some stability, it is clear that industry space is not static but rather dynamic. As we do not expect relatedness structures to change very fast, large shifts in relatedness from one year to another would signal a weakness in the RR method. 91 We initialised the spring embedded algorithm with the position of the nodes in Figure 4.2 to improve comparability.
119
Gas
Pesticide
Sulphite alcohol Plaster
Resins
Mineral wool
Pulp (2) Medicines
Soap
Malt
Ink
Animal feeds
Other food Other chemicals
Other textiles
Mill prod Ice cream
Food oils
LEGEND Food beverages and tobacco Textiles, wearing apparel and leather industries Chemicals and chemical petroleum, coal, rubber and plastic products Non-metallic mineral products Other manufacturing
Figure 4.4: The ego-network for medicines in 1980 Therefore, it is reassuring to see that the RR matrices are highly stable in the shortrun. If we consider the symmetric RR matrices between 1970 and 1971, the average rank correlation is 0.83. Between 1970 and 1972, it is 0.78. The short-term changes in the later part of the period under study are quite a bit larger, with a correlation of 0.63 from 2000 to 2001 and 0.52 from 2000 to 2002. This may be caused by the fact that the number of plants in our sample goes down over time, reducing the quality of our estimates.92 In contrast, in the long-run, we expect that structural changes in the economy are likely to leave an imprint on industry space. Looking at the symmetric RR matrices between 1970 and 1980, we find a correlation of 0.55. Comparing 1970 estimates to 1990 estimates, this correlation is reduced to 0.32; it falls to 0.26 when we compare 1970 and 2000.93 These numbers suggest that industry 92 To better assess the quality of the RR estimates, Tables 4.1 and 4.2 in Appendix 4.C contain correlation coefficients for the remaining decades and for both the first- and second-step estimates. 93 For a comparison between other decades and the first- and second-step matrices, see Tables 4.3 to 4.6 in Appendix 4.C.
120
space indeed underwent some significant changes over the past decades. In this way, our RR calculations might also be used to describe the velocity of structural change in economies. General properties of industry space: directed links One of the strengths of our method is that it also allows for a directed interpretation of the concept of relatedness. Rank correlations comparing the columns and rows of asymmetric RR matrices are typically around 0.4 (see Table 4.8 in Appendix 4.C). The “outgoing relatedness” is therefore quite similar to the “incoming relatedness”, yet, there are also substantial differences. As discussed earlier, in asymmetric industry space, the direction of the arrows should be taken to indicate a decrease in complexity from industries producing a more complex set of products to industries with less complex output. This complexity should be interpreted primarily as complexity in production technology. As an example, Figure 4.4 shows the RR links of the Medicines industry in 1980. The Medicines industry has outgoing links to a large set of industries, including Soap, Pesticide, Resins and Animal feeds. This shows that manufacturers of medicines can relatively easily venture into niches in those industries. The explanation we propose for this is that these manufacturers already possess the complex skills needed for the production of medicines. By adding less complex skills, they can manufacture new products that compete with the products of other industries. However, it does not mean that a manufacturer of medicines can easily appropriate the skills to manufacture all products in these other industries. Rather, the producer can move into specific niches for which the skills involved in the production of medicines are complementary. A good example is the production of soap products94 with a therapeutic application. A manufacturer specialising in soap products, in contrast, generally cannot compete in niches of the Medicines industry without considerable effort and large investments. The link from Other textiles to Medicines is more difficult to explain. The interpretation of the link would be that producers of Other textiles, a category containing a large diversity of products, can move without too much effort into niches of Medicines production. The reverse move would be much more difficult. This seems counterintuitive. However, if we take a closer look, we find that this strong link appears because the production of bandages is classified in the other textiles sector. Yet, bandages almost exclusively have medical applications. A plant that specialises in bandages will therefore be more likely to produce medical disinfectants as a secondary product than pairs of jeans. A similar problem arises with the Other food industry in which the “nuisance products” are spices, herbs and sauces. To summarise, our RR method yields very promising empirical results. However, none of the above discussion can count as a rigorous quality assessment of the RR measure. We next put the RR matrix to the test by using it to predict changes in the industrial 94 This category also includes detergents, essential oils and perfumes.
121
profiles of regions. As the regional dimension has not played any role in our analyses so far, finding out whether industry space has any explanatory force in this context can be considered a litmus test for its usefulness in other economic applications. Analyses of Regional Structural Transformation Processes In the course of their history, regions build up tangible and intangible assets to the benefit of their local firms. Good examples of such assets include cost-effective client-supplier networks, specialised infrastructure, a trained workforce and a strong regional brand. Moreover, it is often argued that by cooperating, the actors in a region engage in a process of collective learning. In economic geography, the benefits of these regional features have been extensively debated within the literature on industrial districts (Marshall 1920; Ottati 1994a; Ottati 1994b), clusters (Porter 1998) and regional innovation systems (Cooke and Morgan 1998). They also are at the heart of the agglomeration externalities on which we focus in the other chapters of this thesis. Furthermore, as discussed in section 1.3.4, in Jacobs’s (1969) terminology, new work in local economies is added to old, and regions develop by branching out to new industries that are somehow related to the industries that already exist in a given region. All this raises the expectation that the industries that are present in a region will show some kind of coherence in the sense that most local industries will be related to one another. Moreover, if local actors can build on regional assets that are specific to the existing local industries, regions as a whole are more likely to diversify into related rather than unrelated industries. Similarly, industries that are technologically isolated from the other industries in the region may have little to gain from the particular industrial mix in their immediate vicinity. Therefore, these industries should have a higher likelihood to leave the region than other industries. In the next section, we show how industry space can be used as an analytical tool to investigate such structural transformations in regions. The regional portfolio and structural transformation A region’s industrial portfolio consists of all industries in which the region has any employment. The RR matrix can tell us how close an industry is to each industry in this portfolio. However, to evaluate the coherence of a regional portfolio, we still must specify how to measure the closeness of an industry to the portfolio as a whole. An intuitive approach is to count the number of portfolio members to which an industry is closely related. Let us call two industries, i and j, closely related if RR(i,j) is above a threshold value γ. The closeness of an industry i to the portfolio of region r, CLir , is therefore a function of γ:95 (4.21) CLir (γ ) = ∑ I ( j ∈ PF r ∧ RR (i, j ) ≥ γ ) j ≠i
95 We also calculated closeness as the sum of relatedness to all industries in the regional portfolio, CL'ir = ∑ I ( j ∈PFr )RR (i , j ) . The results are very similar to those we discuss here. j ≠i
122
A: Membership probability
0. 8
Graphs contain the average probability across all years that industry j:
Probability
0. 6
(A) is a member of the regional portfolio (B) expands into the regional portfolio (C) drops out of the regional portfolio.
0. 4 0. 2 0
Closeness is the number of portfolio members, i, for which RR(i,j)>=.3 0
10 Closeness
15
B: Expansion probability
0. 2
0. 2
0.15 0. 1 0.05 0
C: Contraction probability
0.25
Probability
Probability
5
0.15 0. 1 0.05
0
5
10 Closeness
15
0
0
5
10 Closeness
15
Figure 4.5: Closeness to regional portfolio and membership, expansion and contraction probabilities where PFr is the set of industries belonging to the portfolio of region r, and Ι (⋅) is an indicator function that takes the value 1 if its argument is true and 0 if not. The choice of γ is arbitrary in a sense. It should not be too high, because this will categorise almost all industry pairs as unrelated, nor should it be too low, as this will mean that many weakly related industries are close to each other. We strike the balance by setting γ equal to 0.3. However, results are very similar for a large range of values for c. Further, as the symmetric RR matrices are estimated with a higher precision than the asymmetric RR matrices, we use the symmetric estimates. Nevertheless, the asymmetric matrices yield very similar conclusions. To test the value of our RR matrix, we will investigate whether or not the closeness index derived from it helps explain the composition and change in regional portfolios of the 70 labour market regions of Sweden. More specifically, we want to find out if (1) regional portfolios consist of related industries, (2) regional portfolios are more likely to expand into related industries than into unrelated industries, and (3) regional portfolios are more likely to lose industries that are related to most other industries in the portfolio than technologically more peripheral industries. The number of exits and entries of local industries in regional portfolios are counted by looking at 5-year shifts in portfolios. For example, we compare the regional portfolio in 1990 with the portfolio in 1995 to assess whether an industry entered or exited a region. To address the first issue, we calculate the rank correlation between a membership dummy variable and the closeness, CL, of that industry to the rest of the region’s 123
portfolio members. Note that this dummy variable takes the value 1 if an industry is a member of a region’s portfolio. We indeed find that the correlation between membership and closeness is significant and positive. Averaged across all years in our sample, this correlation equals 0.24, which seems rather low. However, if for each value of CL between 0 and 20, we estimate the probability that an industry is part of a portfolio and plot that probability against CL, we see a pronounced effect of relatedness. In Figure 4.5A, we show the estimated membership probability averaged across all years for an industry that is close to CL other industries in the region. If we move from the lowest values for CL in the graph to the highest, the membership probability more than quadruples. This shows that the degree of coherence in regional portfolios is actually quite high. Figure 4.5B and 4.5C show similar graphs for estimated expansion and contraction probabilities. Again, we find a pronounced effect of our closeness variable. As expected, industries that are closely related to many portfolio members have a high probability of entering the portfolio within five years. As a matter of fact, the probability increases more than sevenfold when we move from industries that are not close to any portfolio members to industries that are close to thirteen portfolio members. The picture for contraction is reversed. Industries in the region that are unrelated to the other members of the regional portfolio run about three times the risk of falling out of the portfolio as compared to industries that are related to many other local industries. Rank correlations between closeness and expansion and between closeness and contraction confirm this finding. Averaged across all years, the correlation between an expansion dummy and closeness is significant and positive at 0.13. For contraction, similar calculations yield a negative and significant correlation equal to -0.11. The overall conclusion is that the RR matrix has substantial predictive power when it comes to the composition of and changes in regional portfolios. We have shown that in terms of our Revealed Relatedness concept, regions not only show a strong coherence in their manufacturing activities. In addition, this coherence is sustained over time by the exit of unrelated industries and the entry of related industries. As the RR matrix is based on plant-level data without taking into consideration any information about regions, the predictive quality is quite remarkable. 4.5: Conclusion The Revealed Relatedness index presented in this chapter compares raw co-occurrence counts to the number of co-occurrences that can be predicted based on knowledge about class-specific attributes only. This comparison yields a meaningful relatedness index whenever co-occurrences are more likely to arise between related classes. The index has the advantage that it can be interpreted as a probability. We have shown that relatedness as quantified in this way is not necessarily a symmetric notion; its direction can express a complexity gradient between the involved classes. This feature is useful, 124
for example, if spillovers between classes are more likely to arise from more complex to less complex classes than vice versa. By applying this concept to portfolio data, we have derived a matrix of industry space that has many desirable properties. Industry space is stable enough in the short run to be considered credible, but at the same time, it is sufficiently dynamic to unveil shifts in relatedness in the long-run. It is compatible with the relatedness implicit in the industrial classification system but also offers many additional, at times new insights. The use of industry space in our application to economic geography shows the versatility of our relatedness measure. Although its derivation is primarily based on the assumption that plant portfolios contain products for which production processes share many similarities, we have shown that industry space has substantial predictive power in the structural transformations of regions. The theoretical assumptions we test are admittedly simple: regional economies are hypothesised to have coherent portfolios of industries, expand into related industries and contract by getting rid of unrelated industries. Nevertheless, given that no regional information whatsoever is used in the construction of RR indices, the explanatory force of industry space is remarkable. An important next step is to repeat these analyses for other countries. This would allow for comparisons of industry spaces across countries. It is by no means a given that Swedish industry space is representative of the entire world. If no comparable data are available, the issue could be explored by investigating the predictive power of Swedish industry space with regards to regional transformations in other countries, for instance. Furthermore, co-occurrences can also be based on firm, regional or national portfolios. As the method is flexible, there is ample opportunity to use other interindustry flow data as the basis of co-occurrences. On a more methodological level, experiments combining such RR matrices using the Bayesian framework would make an interesting research endeavour. Apart from a further development of RR and industry space, there are numerous existing research questions that could benefit from the RR matrices we develop here. In business research, comparable indices are already in use to quantify corporate coherence. In the field of industrial dynamics, a time series of RR matrices themselves can become the subject of investigations, shedding light on how relatedness shifts over time. For this thesis, however, the most important application of industry space is the refinement of the agglomeration externalities concept. With more knowledge of the relatedness between industries, we can construct new agglomeration indicators that incorporate the notion that industries can learn from industries that are involved in technologically close activities. In the next and final empirical chapter of this thesis, we explore this possibility in detail.
125
Appendix 4.A: Derivation of the posterior distribution of RR Substituting (4.13) and (4.17) into (4.15) yields: (4.A.1) P (RR =r L = l , C = c ) =
c a−1 b −1 Γ(a + b) ⋅ r (1 − r ) l Γ(a ) Γ(b)
(r )l (1 − r )c−l
P (L =l C = c )
Using the law of total probability, we can express the denominator of this equation as: P (RR = r L = l , C = c ) = (4.A.2)
c a−1 b−1 Γ (a + b) ⋅r (1 − r ) l Γ(a ) Γ(b)
(r )l (1 − r )c−l 1
∫ P (L = l C = c, RR = r )P (RR = r C = c )d r ~
~
~
0
As RR and C are independent by assumption, we can fill in terms and simplify as follows: (4.A.3) P (RR = r L = l , C = c )=
(r )l + a−1 (1 − r )c −l +b−1 1
l a c l b ∫ (r~) (1 − r~) + −1
d r~
− + −1
0
As the BETA(l+a,c-l+b) distribution must integrate to 1 over its domain, we find that: 1
l + a −1 c −l + b−1 (4.A.4) ∫ (r ) (1 − r ) 0
Γ(a + c + b) dr = 1 Γ(l + a ) Γ(c − l + b)
Rearranging terms yields: 1
l + a −1 c −l + b−1 (4.A.5) ∫ (r ) (1 − r ) dr = 0
Γ(l + a ) Γ(c − l + b) Γ(a + c + b)
Using this result in (4.A.3) gives: (4.A.6) P (RR = r L = l , C = c )= (r )l + a −1(1 − r )c − l + b −1
Γ(a + c + b) Γ(l + a ) Γ(c − l + b)
As l ≥0 and c≥l means that l+a>0 and c-l+b>0, the degree of relatedness, given the number of co-occurrences (that is, the posterior distribution of RR) is BETA(l+a,c-l+b) distributed.
126
Appendix 4.B: Removing the conditioning on C From (4.18), we can calculate the conditional expectation of RR, given that we observe l co-occurrences and c plants investigating the co-occurrence. However, we do not observe c. We therefore remove the conditioning on C using the law of total probability: N
(4.B.1) P (RR =r L = l )= ∑ P (RR =r L = l , C = c ) ⋅P (C = c L = l ) c =l We now must find an expression for P(C=c|L=l). Bayes’ law gives the following equation for the conditional probability of C = c, given that there are l co-occurrences: (4.B.2) P (C =c L = l )=
P (L = l C = c )P (C = c ) P (L = l )
Applying the law of total probability twice in the denominator and once in the numerator, and using the assumption that RR and C are independently distributed from each other, we find: 1
(4.B.3) P (C =c L = l )=
∫ P (L =l
RR = r , C = c )P (RR = r )dr P (C = c )
0
N
1
~=
0
∫ P (L =l ∑ c l
RR = r~,C = c~)P (RR = r~)d r~P (C = c~)
Let us focus on the integral: 1
(4.B.4) ∫ P (L =l RR = r ,C = c )P (RR = r ) 0
1 l c −l c b−1 Γ (a + b) dr = ∫ (r ) (1 − r ) r a −1 (1 − r ) l Γ(a ) Γ(b) 0
(see (4.13) and (4.17))
c Γ(a + b) 1 l Γ(a )Γ(b) 0
l + a −1 c −l + b−1 = ∫ (r ) (1 − r ) dr
c Γ(a + b) Γ(l + a ) Γ(c − l + b) =
l Γ(a ) Γ(b)
Γ(a + c + b)
(see (4.A.5))
Let Γ(l + a ) Γ(c − l + b) , Γ(a + b + c )
β (a, b, c, l ) =
with Γ (⋅) being the Gamma function. Using the result above in (4.B.3) leads to:
127
(4.B.5)
c Γ(a + b) β (a, b, c, l )P (C = c ) l Γ(a ) Γ(b) P (C = c L = l ) = N ~ c Γ(a + b) β (a, b, c~, l )P (C = c~) ∑ ~ c =l l Γ(a ) Γ (b)
Filling in the binomial likelihood for the probability of C=c and simplifying yields: c N−c N β (a, b, c, l )q c (1 − q) l c (4.B.6) P (C = c L = l ) = N ~ ~ c N − c~ N β (a, b, c~, l )q c (1 − q) ~ ∑ c~=l l c
If we substitute equations (4.B.6) and (4.A.6) into (4.B.1) and simplify, we get: N
(4.B.7) P (RR = r L = l ) = ∑ (r )l + a−1(1 − r )c−l +b−1 ⋅ c =l
N
c~
~=
c c N c N q (1 − q) − l c
β (a, b, c~, l )q c (1 − q) ∑ c l l ~
N − c~
N ~ c
We now calculate the posterior expectation of RR: 1
N
0
c =l
(4.B.8) E (RR L = l ) = ∫ r ∑ (r )l +a−1(1 − r )c −l +b−1
c c N c N q (1 − q) − l c
~ c~ N c~ N β (a, b, c~, l )q c (1 − q) − ~ ∑ c~=l l c
N
dr
c c N q (1 − q)N−c 1 c l l a c l b = ∑ N ~ ( r ) + (1 − r ) − + −1dr ∫ c c =l N − c~ N 0 c~ ~ ∑ β (a, b, c , l )q (1 − q) ~ ~ c c=l l N
Using the fact that the BETA(l+a+1,c-l+b) distribution must integrate to 1 over its domain, we find that: 1
(4.B.9) ∫ (r )l + a (1 − r )c − l + b −1dr = 0
Γ(l + a + 1)Γ(c − l + b) Γ(a + 1 + c + b)
Substituting (4.B.9) into (4.B.8), we get: c c N c N q (1 − q) − c l Γ(l + a + 1) Γ(c − l + b) (4.B.10) E (RR L = l )= ∑ N ~ Γ(a + 1 + c + b) c c =l N− c~ N ~ c~ ∑ β (a, b, c , l )q (1 − q) ~ c c~=l l N
128
From the Gamma function, we know that Γ(x+1)=x Γ(x). Therefore, we can express (4.B.10) as: N −c c N c (l + a ) β (a, b, c, l )q (1 − q) l c (4.B.11) E (RR L = l )= ∑ ~ N N − c~ c N c =l (a + c + b) c~ ~ β (a, b, c , l )q (1 − q) ~ ∑ c~=l l c N
This result is reported as equation (4.21) in the main text. For completeness we also derive the unconditional variance of RR. The only piece of information missing now is the unconditional expectation of RR2. 1
N
0
c =l
(4.B.12) E (RR 2 L = l ) = ∫ r 2 ∑ (r)l +a−1 (1 − r )c −l +b−1
c c N q (1 − q)N−c l c
~ c~ N c~ N β (a, b, c~, l )q c (1 − q) − ~ ∑ ~ l c =l c
N
c c N−c N l q (1 − q ) c =∑ N ~ ~ c c =l N − c~ N c ~ ∑ β (a, b, c , l )q (1 − q) ~ ~ l c c =l N
dr
l + a +1 c −l +b−1 ∫0 (r ) (1 − r ) dr 1
Again, we can use the fact that any BETA distribution must integrate to 1 over its domain: 1
(4.B.13) ∫ (r )l + a+1(1 − r )c −l +b−1dr = 0
Γ(l + a + 2 )Γ(c − l + b) Γ(a + 2 + c + b)
Substituting this into (4.B.12) yields: c c N−c N l q (1 − q) c Γ(l + a + 2 ) Γ(c − l + b) (4.B.14) E RR 2 L = l = ∑ N ~ Γ(a + 2 + c + b) c c =l N − c~ N c~ ~ ∑ β (a, b, c , l )q (1 − q) ~ ~ l c c =l
(
)
N
If we apply Γ(x+1)=x Γ(x) twice to this expression, we arrive at the following: c c N−c N β (a, b, c, l ) l q (1 − q) c ( )( ) l a l a + + + 1 (4.B.15) E RR 2 L = l = ∑ N ~ c c =l ~, l )q c~(1 − q)N−c~ N (a + 1 + c + b)(a + c + b) ( a b c β , , ∑ c~ c~=l l
(
)
N
2
As VAR(RR|L=l)=E(RR2|L=l)-[E(RR|L=l)] , the expression for the unconditional variance of RR is: 129
c c N−c N β (a, b, c, l ) l q (1 − q) c ( l + a + 1)(l + a ) (4.B.16) VAR (RR L = l )= ∑ N ~ c c =l N − c~ N (a + 1 + c + b)(a + c + b) c~ ~ ∑ β (a, b, c , l )q (1 − q) ~ c c~=l l N
c' N β (a, b, c' , l )q c ' (1 − q)N−c ' N (l + a ) l c' − ∑ ~ N c '=l (a + c'+b) β (a, b, c~' , l )q c~ ' (1 − q)N−c~ ' c ' N ∑ ~ c~ '=l l c'
130
2
Appendix 4.C: Descriptive tables of RR matrices Tables 4.1 and 4.2 describe the short-term stability of the different relatedness estimates during the first year of each decade. In most cases, the correlations (stability) for the first-step estimates are higher than for the other estimates. Stability also shows a tendency to decrease with time. The row Intermediate only shows the correlation for only those second-step estimates for which the first-step estimates were too weak and the intermediate estimates were used instead. It is therefore quite remarkable that even for the elements for which information on raw counts was very weak, stability is still so high. As expected, the stability of the directed links is lower than that of the symmetric links. Table 4.1: Average Spearman rank correlations between relatedness vectors of different years for symmetric links 1970-1971 1970-1972 1980-1981 1980-1982 1990-1991 1990-1992 2000-2001 2001-2002 First-step Intermediate only Second-step
.90 (.01) .82 (.03)
.86 (.01) .78 (.03)
.93 (.01) .86 (.04)
.89 (.01) .79 (.06)
.89 (.02) .82 (.06)
.79 (.03) .61 (.2)
.85 (.03) .65 (.11)
.76 (.03) .63 (.08)
.83 (.01)
.78 (.02)
.85 (.01)
.81 (.01)
.72 (.03)
.59 (.04)
.63 (.04)
.52 (.04)
Standard deviation across industries is in parentheses.
Table 4.2: Average Spearman rank correlations between relatedness vectors of different years for directed links 1970-1971 1970-1972 1980-1981 1980-1982 1990-1991 1990-1992 2000-2001 2001-2002 First-step Intermediate only Second-step
.86 (.02) .76 (.04)
.79 (.02) .73 (.03)
.87 (.01) .83 (.03)
.79 (.02) .64 (.18)
.85 (.02) .67 (.27)
.76 (.03) .88 (.01)
.81 (.04) .70 (.00)
.72 (.04) 1.00 (.00)
.80 (.03)
.73 (.03)
.85 (.02)
.77 (.03)
.82 (.02)
.75 (.03)
.78 (.06)
.68 (.05)
Standard deviation across industries is in parentheses.
Tables 4.3-4.6 display the long-term stability of the different relatedness estimates between decades. The stability of the relatedness structures generally decreases the longer the time period that is bridged, as might be expected. Comparing Tables 4.3 and 4.4 to Tables 4.5 and 4.6, the first-step estimates are generally higher than the secondstep estimates.
131
Table 4.3: Average Spearman rank correlations between RR vectors of different decades: second-step, symmetric links 1970 1980 1990
1980
1990
2000
.55 (.04)
.32 (.03) .38 (.02)
.26 (.02) .26 (.03) .40 (.03)
Based on 3-year moving averages. Standard deviation across industries is in parentheses.
Table 4.4: Average Spearman rank correlation between RR vectors of different decades: second-step, directed links 1970 1980 1990
1980
1990
2000
.53 (.04)
.37 (.04) .42 (.04)
.33 (.04) .35 (.04) .45 (.05)
Based on 3-year moving averages. Standard deviation across industries is in parentheses.
Table 4.5: Average Spearman rank correlations between RR vectors of different decades: first-step estimates, symmetric links 1970 1980 1990
1980
1990
2000
.68 (.03)
.45 (.03) .46 (.03)
.44 (.03) .43 (.03) .53 (.04)
Based on 3-year moving averages. Standard deviation across industries is in parentheses.
Table 4.6: Average Spearman rank correlations between RR vectors of different decades: first-step estimates, directed links 1970 1980 1990
1980
1990
2000
.60 (.04)
.43 (.04) .46 (.04)
.38 (.04) .39 (.04) .50 (.05)
Based on 3-year moving averages. Standard deviation across industries is in parentheses.
132
A comparison between our relatedness estimates and relatedness according to the hierarchical SNI69-system is displayed in Table 4.7. The correlation is surprisingly low, especially compared to the network pictures displayed in this chapter. Table 4.7: Average Spearman rank correlations between RR vectors and relatedness according to the SNI69-system First-step Second-step
1970
1980
1990
2000
.43 (.04) .31 (.05)
.39 (.05) .27 (.05)
.35 (.04) .26 (.03)
.35 (.04) .25 (.04)
Based on 3-year moving averages. Standard deviation across industries is in parentheses.
Table 4.8 displays the correlations between ingoing and outgoing links. Table 4.8: Average Spearman rank correlations between ingoing and outgoing links First-step Second-step
1970
1980
1990
2000
.48 (.08) .37 (.04)
.44 (.05) .36 (.04)
.37 (.07) .32 (.06)
.39 (.08) .35 (.07)
Based on 3-year moving averages. Standard deviation across industries is in parentheses.
133
CHAPTER 5 THE IMPACT OF PLANT AGE AND TECHNOLOGICAL RELATEDNESS ON AGGLOMERATION EXTERNALITIES: A SURVIVAL ANALYSIS
5.1: Introduction Cities are the nuclei of the productive systems of our economies. Not only do people concentrate there, but most economic activity can also be found in or close to urban centres. As explained in section 1.2.2, in the agglomeration externalities literature, this clustering behaviour has commonly been ascribed to the Marshallian triplet of localisation externalities: labour market pooling, input-output linkages and specialised knowledge spillovers. However, scholars have also argued that firms benefit from large industrial diversity in the city in which they are located. These so-called Jacobs externalities have been addressed in section 1.2.2 as well. Ideally, a city would both host a large number of different industries as well as show large concentrations of each of these industries. Unfortunately, such an ideal city would have to grow extremely large, and substantial congestion effects would be unavoidable. It is therefore reasonable to assume that firms experience a trade-off between local diversity and local specialisation. As we have shown in chapter 3, the nature of this trade-off may vary across industries depending on their stage in the industry life cycle. Most prominently, young industries benefit from Jacobs externalities, whereas mature industries benefit from localisation externalities. In a recent article, however, Duranton and Puga (2001) suggest a model in which the outcome of the trade-off depends not on the industry but rather on the type of activity carried out in a firm. The authors distinguish between two types of activities: exploration and mass-production. In their stylised economy, firms enter the market with a prototype of a product but without fully developed production technology. To find a suitable production process, they can engage in trial and error by imitating one of the locally used production technologies. This is the exploration stage. This stage goes on until the optimal process is found. At this point, the firm can start mass-producing its product. Further, whether exploring new technologies or engaging in mass production, all firms benefit from localisation externalities. The size of the localisation externalities depends on the concentration of firms that use the same 135
production process as the firm itself. Finally, the overall level of economic activity in the city is a source of congestion effects. The model combines a number of assumptions about the productive stages of a firm’s development and the nature of externalities. The first is that firms move from an exploration (or search) stage to an exploitation (or mass production) stage. The second assumption is that exploration is best conducted in diversified cities. The third assumption is that exploitation is best conducted in specialised cities. Duranton and Puga call the constellation of diversified cities and specialised cities that co-exist, but fulfil different tasks in the productive system the nursery cities constellation. Accordingly, we refer to their model as the nursery cities model. The aim of this chapter is to investigate the nursery cities framework by studying plant survival rates. Our first research goal is to assess the influence of agglomeration externalities on the survival rates of plants. A second objective is to find out how these influences change as a plant grows older. Third, we try to compare mass-production plants to exploratory plants by studying the difference between agglomeration effects in plants of different sizes. A final factor we investigate is the extent to which the survival of a plant depends on the presence of related industries in its vicinity. In the empirical sections, we use a technique originally developed in medical statistics to determine which agglomeration benefits prolong the lives of plants in different stages of their existence. Our analyses are conducted on a dataset covering almost 25,000 manufacturing plants. In general, plants that are built for mass-production purposes should have higher starting employment. To investigate the relation between mass-production and agglomeration externalities, we therefore split our sample into small, medium and large plants. In line with the nursery cities model, we find that Jacobs externalities only contribute to plant survival in the first fifteen years of a plant’s existence. After this period, plants no longer benefit from being located in diversified cities. Surprisingly, however, this holds as much for small plants as for large plants. As a matter of fact, the benefits that small plants derive from their local environment over time are very similar to the benefits for large plants. Apart from investigating the age dependence of agglomeration externalities, we also attempt to overcome the strict opposition of specialised versus diversified economic environments. This opposition is not only found in Duranton and Puga’s work but also in the vast majority of the empirical papers on the topic of agglomeration externalities. In the nursery cities model, diversity matters because exploring firms simply try out a random production process they find in their city. However, in reality, we would expect that firms that are rational enough to locate themselves in diversity rich cities in order to benefit from knowledge spillovers will not just randomly test any locally available production technology. Rather, firms can be expected to employ a more sophisticated search strategy. In particular, they will probably focus on a limited set of production processes that share some similarities with their own. In such a case, firms would not benefit from just any kind of diversity in the city but rather from the diversity within industries engaged in technologically related, yet different, activities. Similarly, 136
localisation externalities can be expected to accrue not only from the presence of plants in a firm’s own industry but also from plants engaged in technologically related, yet different, activities. To investigate if this is observed in reality, we must specify the relatedness between industries in terms of production technology. For this purpose, we use the Revealed Relatedness (RR) index we developed in the previous chapter. According to the RR index, relatedness between industries can be extracted from co-production patterns in the product portfolios of plants. The index enables us to smooth the artificial dichotomy between diversity and localisation by adding information about the level of relatedness between industries. The empirical findings show that the impact of related activities in a location is considerable. Adding a term that captures the local concentration of related industrial activity to our regression eclipses the effect of pure localisation externalities (i.e., externalities deriving from a firm’s own industry). Apparently, plants benefit far more from being located close to plants in related industries than being close to real competitors. The remainder of the chapter is structured as follows. In section 5.2, we offer an overview of the literature on agglomeration externalities.96 Towards the end of this section, we provide a more in-depth treatment of the nursery cities model. Section 2.3 describes the link between agglomeration externalities and plant survival. Here we also put forward some hypotheses. Section 2.4 presents the data and our estimation strategy. In section 2.5, we discuss the outcomes of the empirical analyses and the robustness checks. Section 2.6 compares the plant-level results of this chapter with the results we found at the level of local industries in chapter 3. We end this chapter with a summary and some suggestions for further research. 5.2: Theoretical background In the contemporary literature, agglomeration externalities are often divided into two types: localisation externalities and Jacobs externalities.97 A third type of externality is urbanisation externalities, which capture the effects of city size. Big cities can often boast high-quality amenities and infrastructure, but they are also plagued by congestion, resulting in pollution and high factor costs. As a consequence, from the perspective of local firms, urbanisation externalities can just as well represent economies as they can represent diseconomies.
96 For the most part, this is a repetition of the arguments in sections 1.2.2 and 3.2. 97 A third type of externality that is sometimes described is the so-called Porter externalities. These externalities derive from fierce local competition that spur innovative activities in a city (Porter 1998). However, as we explained in footnote 12, fierceness of competition is ideally measured in terms of profit margins. Unfortunately, we do not have these data at our disposal and will therefore not consider these types of externalities.
137
Localisation externalities refer to the situation in which firms benefit from the local presence of other firms belonging to the same industry.98 Building on Marshall (1920), localisation externalities result from a large pool of specialised labour, easy access to local supplier and client firms and unintended local knowledge spillovers between firms belonging to the same industry. In the formal models pioneered by Fujita (1988), localisation externalities are often modelled as arising from a greater variety in specialised intermediates. Each set of intermediates is assumed to be produced for local firms belonging to a single final-goods industries and cannot be imported from outside the city. Producers of intermediate products and services compete, accordingly, for the demand of one specific local industry. Intermediates are supposed to be imperfect substitutes for each other and are sold on a monopolistically competitive local market. Jacobs externalities arise when firms benefit from a large number of different industries in a local economy. Jacobs (1969) argued that most innovations result from “adding new work to old” in cities. The larger is the local diversity of ideas, the more new combinations can arise. This insight led Glaeser et al. (1992) to coin the term Jacobs externalities to capture the benefits of local diversity.99 A formal treatment of this mechanism was accomplished in 2001 by Duranton and Puga. By now, a large body of literature has studied the different types of agglomeration externalities. In many articles (e.g. Henderson et al. 1995; Henderson 1997; Combes et al. 2004), findings suggest an important role of localisation externalities. The role of Jacobs externalities is less well established. However, they seem to be particularly important for young or technologically advanced industries (e.g. Henderson et al. 1995 and the findings in chapter 3 in this thesis). In a meta-analysis of the literature, however, De Groot et al. (2009) show that the findings on agglomeration externalities vary widely across studies. Moreover, the results may depend to a large extent on the industries and time period studied, the geographical area covered and the specific estimation framework employed. For example, in an economy-wide analysis of France, Combes’s (2000) findings vary greatly across industries, even though data are drawn from the same country and time period. In chapter 3, we investigated whether the maturity of an industry contributes to the divergence in outcomes we observe in the literature. In the present chapter, we suggest that not only the industry level but also the plant level may determine which types of local environments generate the largest benefits. In the nursery cities model, firms 98 Some authors prefer the term MAR (Marshall-Arrow-Romer) externalities, as it highlights to the more long-lasting, dynamic effect of local specialisation. However, empirically, the distinction between static and dynamic agglomeration effects is very demanding in terms of data requirements. The variation in the data must allow for an estimate of the precise lag structure of the effects of the regressors. Making this distinction is therefore beyond the scope of this chapter. 99 As larger cities are usually also more diversified, at times urbanisation and Jacobs externalities are not treated as separate effects. However, in this study, we follow the convention that Jacobs externalities refer to a city with a high degree of diversification, controlling for overall city size.
138
enter the market with a prototype. Before being able to mass-produce their product, firms must search for the optimal production process. This search is modelled as a trial and error process. Firms can try out any production process that they observe in their city. Although it is possible to relocate in order to discover more alternatives, this is costly. In diversified cities, firms can imitate several processes without having to bear the cost of moving to another city. Therefore, searching in diversified cities is cheaper than searching in specialised cities. Consequently, firms prefer to perform their exploration activities in diversified cities. Localisation externalities are present in diversified as well as specialised cities. As in Fujita (1988), final goods producers source intermediates from a sector of intermediate producers. These intermediates cannot be traded across cities. The firms in intermediate sectors are engaged in monopolistic competition, and the output of each sector is only used in one specific final-goods production process. Next, the intermediates enter the final-goods producers’ production process according to a Dixit-Stiglitz production function. The larger is the concentration of firms that make use of a particular set of intermediates, the higher is the diversity in intermediates that can be sustained locally, and therefore, the higher is the impact of the localisation externalities that accrue to the final-goods producers. To generate localisation effects as substantially as in specialised cities for each of the locally used production processes, diversified cities must grow larger than specialised cities. However, the overall size of a city comes at the cost of higher congestion. As soon as firms find the optimal production process, they can upscale their production volumes. From then on, they no longer benefit from local diversity. At this moment, firms are faced with a predicament. Their current location in a big city begins to impose high congestion costs without any economies in exploration to compensate. Therefore, these firms are drawn to specialised cities that – for them, at least – strike a better balance between localisation, urbanisation and Jacobs externalities. The upshot of this is that diversified cities and specialised cities may co-exist, with each focusing on a different task in the economy.100 More specifically, one may expect that plants that are set-up as small prototype plants should, especially in the early years of their existence, benefit from being located in diversified cities. In contrast, plants that are already set-up as large-scale mass-production plants from the outset should not benefit at all from Jacobs externalities, but rather benefit from specialised local environments. In other words, small plants that are still very young are expected to benefit from local diversity, while large and already quite mature plants are better off in a specialised local environment. However, the way in which firms are assumed to engage in technological exploration appears to be too stylised for empirical work. If managers of firms are supposed to 100 This division of labour between cities had already been anticipated in less formal studies. As mentioned before, Jacobs (1969) regards large diversified cities as the breeding ground of new ideas. In the product life cycle location model of Hirsch (1967), the suitability of the national production environment varies with the stages of the product life cycle.
139
be intelligent enough to locate in diversified cities in order to benefit from Jacobs externalities, surely they must have a more sophisticated research strategy than randomly testing locally available production processes. More realistically, we would expect firms to limit their search to production processes used in related economic activities. This would indicate the importance of something like the concept of related variety, introduced by Frenken et al. (2007). A similar kind of reasoning applies to localisation externalities. It is not very realistic to expect that only plants in their own industry give rise to localisation externalities to firms. One could even argue that plants in the same industry are likely to generate lower knowledge spillovers, as they would rather prevent knowledge from leaking to their competitors. Plants in related industries, in contrast, may serve as a source of ideas that are relevant, yet new to an industry. At the same time, firms in related industries may be less protective about knowledge spillovers, as they are not direct competitors. Still, the literature on agglomeration externalities seems to have not yet addressed this issue. A main empirical challenge is the measurement of relatedness between different industries. Most existing indicators are either ad hoc, like those that assume that two industries are related if they are close to each other in the Standard Industry Classification (SIC) system, or they are biased towards technology intensive industries, such as patent-based measures. What is needed is a manufacturing-wide measure that assesses the degree of relatedness in the production processes used in different industries. In this chapter, we use the Revealed Relatedness (RR) approach developed in the preceding chapter. In essence, it views plant portfolios as an expression of the existence of economies of scope. More specifically, the fact that one plant produces products belonging to two different industries is interpreted as an indication of relatedness of the production technologies employed in those industries. Using a database on the product portfolios of a large sample of Swedish manufacturing plants, we arrive at a matrix containing relatedness estimates for the vast majority of industry combinations.101 The RR approach allows us to estimate the impact of the local concentration of related industries on the performance of plants. We refer to the effects of related concentration as related localisation externalities as opposed to pure localisation externalities, which term we reserve for effects of a local concentration of activity in the own industry. Similarly, we will make a distinction between related Jacobs externalities and pure Jacobs externalities. Related Jacobs externalities count the number of related industries with a significant presence in a city, whereas pure Jacobs externalities count the number of all significant industries in a city, regardless of whether they are related or unrelated. These two types of Jacobs externalities capture the qualitative differences in local industrial structure in the sense that they are intended to measure how many different fields of knowledge are represented in a city. The two types of localisation externalities focus on the concentration of activity in a firm’s own industry as well as related industries in a city and therefore measure a quantitative aspect of the industrial structure. 101 For details on the method, we refer the reader to section 4.3.
140
5.3: Estimation framework In the agglomeration externalities literature, most studies use regional employment growth or regional employment levels (e.g. Glaeser et al. 1992; Henderson et al. 1995). However, a decline in employment does not always result from a decline in productivity and, therefore, is not necessarily related to weaker agglomeration externalities. A good example is labour-saving investments or a market in which demand is relatively inelastic. Under these circumstances, higher productivity simply means that fewer employees produce the same output, and instead of rising, employment may even drop. Plant productivity data (e.g. Henderson 2003) or plant entry data (Rosenthal and Strange 2003) are then probably more appealing. A lack of data on capital inhibits us from taking this route to investigate the impacts of agglomeration externalities. We would have to make the uncomfortable assumption that the capital-labour ratio is constant across plants. Instead, we study agglomeration externalities by estimating their effect on the survival rates of plants. There are few papers in agglomeration externalities that focus on survival rates. Some exceptions are Falck (2007) and Boschma and Wenting (2007). This is surprising because the fact that a plant survives is a crude, yet very significant performance measure. It is not as volatile as yearly productivity figures, since plants may build buffers in years of good fortune and draw upon their reserves in years of bad fortune. Moreover, a survival analysis also explicitly accounts for plants that exit and can thus be regarded as an interesting, complementary approach to existing analyses in the literature. The plant is chosen as the unit of analysis because plants have one physical location, whereas firms may have different plants in various cities. Such multiple locations severely complicate the task of determining what the relevant local environment is. Although it is not very common in externality studies, survival analysis has been widely used in the field of industrial dynamics and business studies. Most of these studies have looked at the survival of firms or plants with respect to their size and age (Disney et al. 2003), pre-entry experience (Thompson 2005), the structure of the market (Cantner et al. 2006; Buenstorf 2007), the maturity of the industry (Agarwal and Gort 2002), or combinations of these dimensions (Klepper 2002). A common finding in this literature is that the larger the plant or firm, the higher its survival rate. Moreover, older plants tend to show lower exit rates. In this chapter, we therefore control for these influences. Size is measured by the starting employment of firms. The influence of age is removed from the data using the semi-parametric specification of the Cox proportional hazards model (Cox 1972), which allows for an unspecified relation between survival and age. To control for market structure and industry effects, we use industry dummies. In some agglomeration externalities studies, corporate and non-affiliated establishments have proven to behave quite differently (e.g. Henderson 2003; Rosenthal and Strange 2003). Henderson argues that corporate plants may draw fewer benefits from the local environment than non-affiliated plants. The reason for this is that plants belonging to larger corporations can use their channels within the corporation to access knowledge and organise supplier and client relations. In a total 141
factor productivity study of American plants, he finds that corporate plants indeed experience lower agglomeration externalities as compared to non-affiliated plants. Corporate plants may therefore be less inclined to engage in local interaction than their non-affiliated counterparts. This suggests that corporate plants are fundamentally different with respect to their externality needs as compared to non-affiliated plants. In our analyses, we take this into account by splitting the sample into corporate and nonaffiliated parts. As we are not interested in the effect of plant age per se but rather wish to focus on the externality variables, we choose a Cox proportional hazard model (henceforth referred to as the Cox model).102 Coefficients are obtained from maximum partial likelihood estimation, which uses information on the order in which plants exit. In the Cox model, we must specify the hazard rate as a function of the age of a plant and some plant characteristics. In an informal way, the hazard rate at age t can be thought of as the rate at which plants exit, given that they have survived up to age t (e.g. Greene 2000, pp. 937-950). Let θ(t,X,b) be the hazard rate for a plant of age t with k different characteristics that are summarised in matrix X. b is a vector of parameters. The Cox specification now results in: (5.1) θ(t,X,b)= θ0(t)exp(b'X) θ0(t) is a function that represents the baseline hazard, capturing the direct impact of plant age on plant survival, and will not be specified. A common finding is that the larger the plant, the lower its hazard rate. Therefore, X must at least contain a measure of the size of the plant. Moreover, X also contains variables describing the local environment at the time of the plant’s birth. We discuss these variables in greater detail in the next section. An important prerequisite for using the Cox model is that the effect of covariates is the same for plants of all ages. This is obviously violated by our prediction that the effect of Jacobs externalities diminishes as plants grow older. In fact, one might say that the violation of the proportional hazards assumption lies at the heart of our research questions. To address this issue, we use a method outlined in Hosmer and Royston (2002). This method, originally developed for applications in medical statistics, uses the Aalen linear hazard model (Aalen 1989; henceforth, referred to as the Aalen model) as a guide on how to incorporate age-dependent effects in a Cox model. The hazard function for an Aalen linear hazard model with k covariates is quite different from the Cox model. It is not multiplicative but additive and is specified as follows: 102 That is not to say that we are not interested in the effect of plant age at all. We do want to know whether the survival of old plants depends more or less strongly on externalities than the survival of young plants, yet we do not care whether old plants have, in general, higher survival rates than young plants.
142
(5.2) h(t,X,g (t))= g0 (t)+ g1 (t)x1+...+ gk (t)xk As in the Cox model, the coefficients g1 to gk represent the change of the baseline hazard rate, g0, for a one-unit change in the corresponding covariate. However, unlike the Cox model, the effects of the covariates are now different at different ages of a plant. We can derive the cumulative hazard rate by integration:103 t
k
p= 0
(5.3) H (t, X , Γ(t )) = ∫ ∑ γ p (u) x pdu
t = ∑ x p ∫ γ p (u)du p= 0 0 0
k
k
= ∑ x p Γ p (t ) p= 0
The Γp (t)’s are called cumulative regression coefficients. Instead of estimating the individual gp(t)’s, it is easier to calculate these cumulative regression coefficients (Hosmer and Lemeshow 1999, pp. 338). The cumulative regression coefficients can be seen as empirical functions that describe the impact of the corresponding covariates. More specifically, the slopes of these functions provide information about the influence of the covariate (Aalen 1989). If at a certain age t, the slope is positive, the covariate raises the hazard rate and is therefore associated with a negative effect on plant survival. Analogously, negative slopes indicate a positive effect on plant survival, and horizontal slopes suggest that the covariate has no impact on the survival of a plant. To obtain an impression of the age-dependence of the effect of the pth covariate, we plot Γp (t) against plant age, t. In such a plot, a proportional hazard in the pth variable should result in a straight line for all values of t. A violation of the proportional hazards assumption would lead to a plot with non-linearities so that the slope changes with t. Based on an inspection of the plots, it is possible to derive the functional shape of age-dependence in the covariate under consideration. The only functional shapes we consider in this model are step functions. At the end of this procedure, we feed the information on age-dependence back into the Cox model of equation (5.1), but now the coefficients take different values for different sets of t, as indicated by the argument t of the β’s: 104
k
(5.4) θ (t, X , β (t )) = θ 0 (t ) exp ∑ β p (t )x p p=1
where 103 In this notation, xp is a vector of ones. 104 As we limit ourselves to step functions, the function of age enters multiplicatively in the term between the large parentheses. This allows us to transform the regressor values and estimate a Cox model with timevarying regressors.
143
1 if t ∈ Apr 0 elsewhere
(5.5) β p (t ) = α pr I (Apr , t ), with I (Apr , t )=
The Apr terms represent the sets of t that correspond to the different values α pr that bp (t) can assume. 5.4: Data For our empirical investigations, we use data on Swedish manufacturing plants that were collected by Statistics Sweden. The dataset contains information on about 15,000 individual plants that entered between 1970 and 2004. The total number of different active plants in this period is around 25,000. Between 1970 and 1989, the sample covers Swedish manufacturing plants with five employees or more that are engaged in manufacturing activities. In 1990, the data collection regime changed to cover plants with more than five employees belonging to firms employing at least ten people. Plants with fewer than ten employees are thus only reported if they are part of a larger firm. In other words, from 1990 and onwards, the only plants below ten employees are corporate plants. For the sake of consistency, we focus in the largest part of this text on non-affiliated plants with at least ten employees. We use the complete sample for robustness checks. For each plant, we know to which of Sweden’s 277 municipalities it belongs.105 The data have been cleaned and checked, both manually and by using tailor-made algorithms.106 To avoid problems with left-censored plants, we only study the survival spells of plants that entered the database after 1970.107 We distinguish between corporate and non-affiliated plants using information on the organisation identification number. Plants that do not share their organisation number with any other plant are called non-affiliated. All other plants are corporate plants.108 All characteristics of a plant are measured at the year in which the plant enters the database. We assume this is also the year in which the plant was created.109
105 We have merged a few municipalities in order to create consistent definitions over time. 106 Available on request. 107 We were able to use a plant identification variable to follow plants over the course of their existence. From 1984 and onwards, the identification variable that was used in the 1970s was gradually abandoned in favour of a new identification system. Using the years for which both the new and the old identifications numbers were available, we were able to create a consistent identification code for the vast majority of plants. Still, exit rates in 1983 and birth rates in 1984 were slightly higher than expected. We therefore also dropped the spells belonging to plants that entered in 1984 or exited in 1983. In the construction of the variables describing the local environment, we however also picked up contributions from these plants. 108 The use of the organisation number is not unproblematic. Firms may change organisation numbers, and use more than one organisation number for administrative or legal reasons. The distinction between corporate and non-affiliated plants by use of organisation identification is nevertheless the best that our data allow. 109 Given the fact that we only use data on plants with at least ten employees, this is obviously only an approximation.
144
In order to measure the effect of agglomeration externalities, we must define what we mean by the local environment of a plant more carefully. As noted above, for each plant we know in which municipality it is located. However, Swedish municipalities vary enormously in size. In the vast and scarcely populated North, municipalities can cover many thousands of square kilometres. In the much more densely populated South, in contrast, municipalities are limited to a far smaller area they cover sometimes only small parts of metropolitan areas. Moreover, surely, a municipality that is located at a short distance from the centre of the capital city of Stockholm should experience some of the agglomeration externalities that are generated there. To cope with these issues, we determine the position of the largest population core – the largest village, town or city – for each municipality. Typically, there is one clear “municipality capital” surrounded by a couple of smaller villages. Next, we assume that all economic activity takes place in this municipality capital. In general, agglomeration effects should attenuate gradually over distance. Therefore, we base our agglomeration indices on quantities that are generalisations of the well-known population potential quantity. For example, the employment potential of industry i in municipality m and year y is calculated as: (5.6) Eipot , m ,y =
Eπ y ∑ g (dmm )π ∑ m M P '∈
'
∈
,
i , m ',y
,
where Ep,y : the employment of plant p in year y Pi,m,y : the set of plants active in industry i and located in municipality m in year y M: the set of municipalities in Sweden g(dmm'): �a function that expresses the attenuation over the distance by road between the capitals of m and m' in kilometres, dmm' .110 We proxy pure localisation externalities that accrue to a plant p in industry i that is located in municipality m and was founded in year y by the natural logarithm111 of the employment potential of the industry minus the plant’s own employment: (5.7) LOCπ = E ipot , m, y − E π , y
110 We use the following expression for this attenuation:
ln 0.01 (dmm ' − 10 ) if dmm ' > 10 exp 90 1 if dmm ' ≤ 10
g (dmm ') =
This results in an attenuation for which the contributions of municipalities that are less than 10 km away are counted fully. At longer distances, the distance decay is exponential with parameters such that the employment in a municipality at 100 km contributes for 1% to the overall employment potential of m. 111 The log-transformation is chosen because it seems reasonable that hazard rates should react to proportional transformation rather than to additive transformations of our regressors.
145
Related localisation externalities are defined in an analogous way: (5.8) RLOCπ = ∑ Ei pot ', m , y i '∈Ri
where Ri represents the set of industries that are related to industry i but excludes i itself. To decide which industries should be a part of this set, we make use of the Revealed Relatedness index developed in the previous chapter.112,113 As explained earlier, this index of Revealed Relatedness captures the intensity of the plant-level economies of scope between industries that are manifest in the product portfolios of manufacturing plants covered by a large Swedish database. Two industries are said to be related if they have a RR index of at least 0.14.114 The maximum RR index is 1, which would suggest that the production processes used in the involved industries are virtually indistinguishable. Jacobs externalities should capture the number of different production processes that are used locally. As we cannot observe production processes, we count the number of industries with a significant local presence instead. According to Henderson (2003), each plant can be thought of as a specific experiment with the production technology in an industry. Arguably, therefore, an industry can be said to have a significant local presence if its number-of-plants potential exceeds a certain threshold, ξ. Alternatively, however, the threshold may be set in terms of the employment potential of the municipality in which the plant is located. In the main text, we report on analyses in which this threshold is set equal to five plants.115 The number-of-plants-based value is calculated as follows: (5.9) JACm ,y = ∑ Ξ(PLANTi ,pot m ,y , ξ ) i ∈I
where 112 In principle, this matrix of relatedness indices may change over time. However, here we choose the average relatedness between industries in the period 1971-2002, which most closely corresponds to our sampling period. This avoids fluctuations in the set of related industries over time. 113 We have been able to calculate the Revealed Relatedness index for almost all industry pairs, except for the ones that involved industries with very few plants. Plants in these industries have been ignored in this study. 114 This number corresponds to a choice of the 3,000 strongest links that we encountered. At this level, only very few isolated industries exist, and most industries are related to some other industry. As we leave out all plants for which no related industries exist, this ensures our sample does not become unnecessarily small. The choice of exactly 3,000 links is therefore reasonable yet admittedly ad hoc. 115 We use a smaller threshold in this chapter as compared to the one used in the analyses in chapter 3 because we now calculate the diversity in all municipalities of Sweden, not only in the 70 capital cities. As many municipalities are very small, using the previous threshold of ten employees would result in a poor measurement of the differences in Jacobs externalities between plants in these small municipalities. However, the threshold of ten employees is still used in the robustness checks.
146
1 if X ≥ ξ , 0 if X < ξ
Ξ(X , ξ ) =
and I is the set of all industries in Sweden. PLANT i ,pot m ,y is the number-of-plants potential in industry i in municipality m during year y. Similarly, by only counting the number of related industries with a significant local presence, it is possible to construct an indicator of local related diversity: (5.10) RJACi , m ,y = ∑ Ξ(PLANTi ,'pot m ,y , ξ ) i '∈Ri
To capture congestion effects, we also calculate a population potential for each municipality capital using the procedure in (5.6). 5.5: Empirical results Descriptive statistics and specification details Tables 5.1 and 5.2 contain some general descriptive statistics for our datasets. The entire sample consists of about 14,700 observations, that is, plants that entered after 1970. However, if we drop all plants smaller than ten employees to obtain a consistent sampling definition over time, the number of investigated plants decreases to about 11,500. The plants with less than ten employees seem to be randomly distributed across the country. The correlation between a dummy representing a size between five and nine employees and each of our agglomeration indicators is always lower than 5%.116 In what follows, we focus on the results obtained by leaving out all plants under ten employees.117 Estimations using the complete sample are not presented. However, to assess the robustness of our outcomes, we reran all analyses using the broader sample as well. The set restricted to plants with at least ten employees contains 2706 corporate and 8829 non-affiliated plants. The cross-correlations between the covariates are shown in Table 5.2. Given the sample size, in principle we have no reason to be too concerned about multi-collinearity effects. Moreover, any such problems should emerge during our robustness checks. PLANTSIZE is the size of a plant in terms of employees at the time it entered the
116 Obviously, this does not hold for the control variable that measures the size of the plant. Furthermore, please note that all our covariates are log-transformed. 117 Note that the plants below the employment threshold of ten have been used in the construction of the agglomeration variables. Leaving such plants out would increase the measurement error in these variables. As there is no substantial correlation between the size of a plant and its local environment, we do not believe this procedure leads to spurious results. This belief is confirmed by regressions with agglomeration variables that only use information from plants with at least ten employees. Outcomes are very similar, but standard errors are somewhat larger.
147
Table 5.1: Descriptive statistics of covariates CORP ln(PLANTSIZE) ln(LOC) ln(RLOC) ln(JAC) ln(RJAC) ln(POPPOT)
Obs
Mean
Std. dev.
Min
Max
11535 11535 11501 11535 11535 11535 11535
0.2346 3.0375 4.4984 7.3476 1.9989 0.9562 11.4641
0.4238 0.8438 3.4890 2.2644 1.0840 0.8681 1.2356
0.0000 2.3026 -33.9642 -55.3776 0.0000 0.0000 7.6566
1.0000 8.9335 9.9399 10.8369 4.0431 3.2189 13.8122
Variables are defined as in section 5.4. CORP is a dummy variable that takes the value 1 for corporate plants and 0 for non-affiliated plants.
database.118 LOC, RLOC, JAC and RJAC are defined as in the previous section and refer to the values in the entry year of the plant. As we discussed before, both the localisation and the Jacobs externalities variables can be based either on local employment potentials or on local number-of-plants potentials. However, the correlation between pairs of employment and number-of-plants-based variables is typically above 95%. This prohibits the simultaneous estimation of both types of specifications. In the main text, we calculate the LOC and RLOC indicators using employment potentials. For the JAC and RJAC indicators, we use the number-of-plants potentials. This approach most closely follows the spirit of the nursery cities model. Here, localisation externalities arise from a large local demand for intermediates specific to the particular production process used in the industry. Localisation externalities in the nursery cities model therefore depend on the overall demand generated by the local industry. This will be correlated with the total local employment in the industry. Jacobs externalities, in contrast, are associated with the notion of inter-industry knowledge spillovers. The more different are industries that are active in a city, the greater will be the variety of locally available production processes. However, for these production processes to be sufficiently visible, the industries involved must be of a certain minimum size. Therefore, for Jacobs externalities, we must choose a lower limit for when the local presence of an industry is labelled “significant.” As each plant in a particular industry represents one experiment with the production process associated with that industry, the number of plants can be regarded as the knowledge spillover potential of the industry.119 As it is this knowledge spillover potential that generates Jacobs externalities, in the main text we use the local number-of-plant potential to decide whether an industry is significantly present in a city. We set this lower limit at five plants, but we use different cut-offs, including both number-of-plant-based and employment-based, to assess the robustness of our findings.
118 Please note that this variable cannot take on values below ten employees in the main text and five employees in any of the robustness analyses presented in section 5.5. 119 See Henderson (2003).
148
Table 5.2: Cross-correlations between covariates ln(PLANTSIZE) ln(LOC) ln(RLOC) ln(JAC) ln(RJAC) ln(POPPOT)
ln(PLANTSIZE)
ln(LOC)
ln(RLOC)
ln(JAC)
ln(RJAC)
ln(POPPOT)
1.0000 0.1004 0.0602 0.0381 0.0405 0.0596
1.0000 0.4367 0.4123 0.3950 0.4011
1.0000 0.5087 0.6543 0.5111
1.0000 0.7130 0.8959
1.0000 0.6409
1.0000
Variables are defined as in section 5.4.
Interpretation of the regression tables In all regressions below, we control for initial plant employment size and for differences in hazard rates across industries by adding 3-digit industry dummies. The dummies are added to all regression analyses in this chapter. All variables have been log-transformed. This implies that we believe that the effects enter as “hazard elasticities:” a d% increase in the pth variable is supposed to raise the instantaneous probability of exit by exp(dbp). This has the attractive property that increasing the population of a town of 10,000 inhabitants by 1,000 has a different effect from adding 1,000 inhabitants to a city with a population of a million. The regression tables report untransformed coefficients with their robust120 standard errors in parentheses. This means that a negative coefficient is associated with a positive effect on survival. In the text, we will often discuss findings in terms of hazard ratios. These express the change in hazard rate that is associated with a given increase in the covariate value. Outcomes Table 5.3 summarises the results of the Cox regressions that assume that the influence of the local environment does not change with the age of a plant. Column (1) presents results based on the sample that includes both corporate and non-affiliated plants. We start with the traditional set of agglomeration externalities and the control variable for plant size. The effect of plant employment (PLANTSIZE) is strong and has the expected negative sign. A doubling in the initial employment of a plant results in a reduction of the hazard ratio by 14.5%.121 All three local environment variables have the expected sign. A large population (POPPOT) increases the risk of a plant exiting, with a hazard ratio of about 1.25 for a doubling of the population. Localisation externalities are very small and not significant. Doubling the number of active local industries
120 We control for clustering of residuals on plant ID. Controlling for clustering on municipality or industry yields very similar standard errors. 121 In fact, the influence of ln(PLANTSIZE) is strongly non-linear, with a decreasing effect for higher values of PLANTSIZE. However, using a non-linear specification does not affect any of the other coefficients, and therefore, we stick to the simpler linear specification. In later regressions, this non-linearity is expressed in the different coefficients we find for plants of different sizes.
149
Table 5.3: Cox regressions of plant survival rates assuming age-invariant effects (1)
(2)
(3)
(4)
all
all
CORP
NON-AFFILIATED
ln(PLANTSIZE)
-0.157*** (0.015)
-0.157*** (0.015)
-0.251*** (0.025)
-0.177*** (0.024)
ln(LOC)
-0.006 (0.004)
-0.003 (0.004)
0.016 (0.009)
-0.008 (0.005)
ln(JAC)
-0.151*** (0.025)
-0.143*** (0.029)
-0.021 (0.063)
-0.198*** (0.033)
ln(POPPOT)
0.222*** (0.023)
0.236*** (0.023)
0.173** (0.053)
0.250*** (0.026)
ln(RLOC)
-0.035*** (0.007)
-0.088*** (0.018)
-0.023** (0.008)
ln(RJAC)
0.017 (0.026)
0.004 (0.053)
0.055 (0.030) yes
Industry dummies
yes
yes
yes
Model statistics df PH stat PH stat Nobs Log-likelihood
31 38.8 11501 -57434.7
33 40.3 11501 -57424.3
32 52.4 2698 -11285.6
33 47.4 8803 -42426
Clustered (on plant identification numbers) standard errors in parentheses, * p