International Journal of Computer Graphics Vol. 2, No. 2, November, 2011
Open-Source-based Visualization of Flight Waypoint Tracking Using Flight Manipulation System Myeong-Chul Parka, Hyeon-Gab Shinb, Yong Ho Moonb , Seok-Wun Hab*, a
Dept. of Biomedical Electronics, Songho College, Namsanri, HoengseongEup, HoengseongGun 225-704, Republic of Korea b,b*
Dept. of Informatics, Gyeongsang National University, 900 Gajwadong, Jinju 660-701, Republic of Korea
a
[email protected], b
[email protected],
[email protected] b*
[email protected] ( *corresponding author) Abstract
Flight Waypoint visualization of the aircraft is the system which is widely used to solve the threat against a low altitude task and terrain altitude. But, it is difficult to implement the system because of restrictions that a GPS data and a huge geographic information should be stored. In this paper, an open-source-based Moving Map system for an economic visualization of the flight Waypoint is proposed. First, a simulated flight path information transferred from Flight Manipulation System interlocked with X-Plane through UDP is acquired and then from this a terrain altitude information is earned and simultaneously demonstrated on Google Earth. In the proposed Moving Map system, flight waypoints are visualized on the map information downloaded from a Map server using the mapping data between the present altitude of the aircraft and the present terrain altitude. Also, the monitoring screen is provided that indicates the terrain location which has the dangerous characteristic of collision at the projected course by comparing the terrain altitude and the aircraft’s altitude which it follows in time interval. The outgrowths of this paper could be used an economic tool in the field of flight Waypoint visualization and the flight algorithm research. Keywords: Flight Waypoint, Visualization, Manipulation, Open Source, Moving Map.
1. Introduction Flight visualization has been widely used to more effectively cope with the various threats from skies and an accidental situation change [1], [2]. In recent, the related studies of automatic generation of waypoints considering terrain altitude information and of waypoint generation to avoid the multiple threats using optimization method are proposed. [3], [4]. But, these researches provide only a path or waypoints of aircrafts. In order to represent the generated waypoints to the user, a moving map system should be built with the map and the terrain information, it is used as a tool to guide the flight path. But the most moving map has restrictions that it needs databases with the vast amount of geographical and terrain information, and it is difficult for them to apply to a system have an intension of a game or a research. In this paper, we propose a visualization tool to track the waypoints in effect by establishing an economic moving map system with the use of various software based on the
1
International Journal of Computer Graphics Vol. 2, No. 2, November, 2011
open-sources. Data for visualization is earned from a Flight Manipulation System designed as an external flight system interlocked with X-plane because of difficulties of the flight data extraction on an aircraft flight in real. Simulated flight data is transferred from the Flight Manipulation System using UDP protocol. And the position data earned from the Flight Manipulation System is represented on the Google Earth and the corresponding terrain data of the position is transferred to the moving map system. Using data of the altitude and the orientation data of the aircraft an estimated vertical ascending speed rate or descending speed rate of the aircraft is calculated and from this one the terrain altitude toward the proceeding direction is extracted. Lastly all the flight data is represented on the moving map through the visualization modules using the OpenGL libraries and the map information is transferred from the MapServer of ArcGIS [5] at real-time Our proposed system has a problem of a time delay because the map information is transferred through Web database but it would not give a serious affect to the simulation level system that demands a real-time operation because it could be implemented using multi-core system.
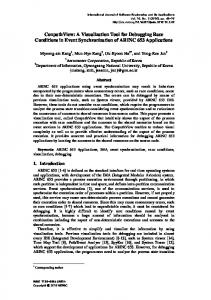
2. Background Song, J. and others [6] have been presented a system for the flight path visualization which using the state transition information without a terrain information [6]. Figure 1 shows the flight path visualization system. In this system there is a limit that it lacks in reality and it simply represents the location information of the aircraft because this system merely appears the flight path.
Figure 1. Flight Path Visualization System by Song, J. and others And Park, M. and Hur, H [1] introduced a visualization system which the flight information is visualized on the Google Earth but does not present the path information besides the flight condition and the instrument information. Also Park, S. and Park, M. [2] presented a three-dimensional visualization tool to recognize the flight situation. This tool represents a simple moving path but does not alert the threat factors according to the terrain altitude information. In short, the existing flight information visualization tools don’t provide a data worthy of reference during the flight state else than the simple visualization of the flight results.
2
International Journal of Computer Graphics Vol. 2, No. 2, November, 2011
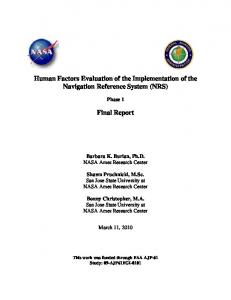
3. Visualization System Figure 2 shows the overall structure of the proposed waypoint tracking visualization system. The structure is composed of Flight Manipulation System interlocked with X-Plane, Visualization and UDP Engines, and Visualization Module includes Map View that the waypoint tracking could be represented.
Figure 2. Architecture of the Visualization System In this section we design Flight Manipulation System, Visualization/UDP engine, and Visualization Module including Map View. 3.1 Flight Manipulation System Figure 3 represents a visual view of the Flight Manipulation System. This system has a role to generate the flight data such as pitch, roll, headings, and speeds operating a external flight control device and receive the flight data such as latitude, longitude, altitude, and vertical speed rates from the interlocked X-Plane, and then send these information to the Flight Data Collector connected with Visualization/UDP Engines.
Figure 3. Flight Manipulation System
3
International Journal of Computer Graphics Vol. 2, No. 2, November, 2011
3.2 UDP Engine An UDP Engine Module is designed to receive a UDP packet from the Flight Data Collector and operate UDP Server, then analysis the received UDP packet and transfer to the Visualization Engine Module. Figure 4 shows a structure of UDP Engine Module. Figure 4 shows the block diagram of the UDP Engine module
Figure 4. Diagram of the UDP Engine A data packet transferred from Flight Manipulation System has a type of UDP with the data corresponding to its packet index number. One UDP packet is composed of independent data of 8 at the most and each of them have a float type of 4 bytes. Table 1 defines items of an UDP packet for visualization. Table 1. Items of the UDP Packet for Visualization Packet No.
Information
Index
UDP 01 UDP 03 UDP 04 UDP 18 UDP 20 UDP 37 UDP 41,42
Times Aircraft Speeds Vertical Speed Indicator Pitch, Roll, Headings Lat, Lon, Altitude Engine RPM N1, N2
0 0 1 0,1,2 0,1,2 0 0
The packet structure format for the received UDP packet is a form of code 1. Code 1 : Structures type for UDP packet format typedef struct data_struct { int index; float data[8]; } FMS_UDP;
4
International Journal of Computer Graphics Vol. 2, No. 2, November, 2011
3.3 Visualization Engine The UDP Packet information stored to the packet structure is transferred to the flight waypoint generation module for the waypoint visualization and this module compares altitudes between the aircraft and the terrain by using map and vertical speed rate information received from the Map Server. Vertical speed rate is calculated on a next equation and here means aircraft’s descending or ascending speed. Vertical speed rate Aircraft speed 6075.62963 / 60 tan
In order to visualize the aircraft’s past path and the estimated proceeding path on the basis of the flight waypoints several consecutive rectangular boxes are utilized by using heading, pitch, roll data from UDP Engine. Heading data is an information for a proceeding direction and pitch is one for ascending/descending activities, and roll data is used for left/right rotation. And to represent the estimated proceeding path of the aircraft using vertical speed rate information a blue dotted line is used in figure 5.
Figure 5. Representation of the Flight Waypoint Tracking 3.4 Visualization Panel In addition to visualization of the waypoint tracking, all of the flight information is needed to display on the instrumental panel so that the pilot can be recognized the current flight state. In this study, using various functions of the open-source OpenGL the basic instruments with Map View is designed and implemented. Figure 6 shows the manipulated cockpit instrumental panel of the simulation aircraft. It is composed of MFD(Multi-Function Display) instruments on the left side and Map Viewer on the right side and on the middle part PFD(Primary Function Display) instruments are arranged. These instruments are designed on the basis of the real cockpit instrument images and so it is enhanced the reality.
5
International Journal of Computer Graphics Vol. 2, No. 2, November, 2011
Figure 6. Integration of Simulation Instruments and Map View In the instruments, a mapping between a flight data and instrument indicator is operated in method of mapping to the corresponding area by calculating the rotational coordinate, using the central coordinates as a guide. Because the rotation functions to be provided from OpenGL affects to other image area, a method is used which mapping by extracting the corresponding area on the image through a specific rotation coordinate calculation procedure. The coordinate arrangement follows the range mapping on the figure 7.
Figure 7. Texture Mapping for Rotary Coordinate The following source code 2 is one part of the real-time maps for MFD mapping descriptions. Code 2 : Implementation of MFD using rotary coordinate glBindTexture(GL_TEXTURE_2D, texture[0]); glBegin(GL_QUADS); x1=(sm_X-Cen); y1=(sm_Y-Cen); x2 = x1 * cos(roll) - y1 * sin(roll)+Cen;
6
International Journal of Computer Graphics Vol. 2, No. 2, November, 2011
y2 = x1 * sin(roll) + y1 * cos(roll)+Cen-pitch; glTexCoord2f(x2,y2); glVertex3f(x, y, 0.0f); x1=(la_X-Cen); y1=(sm_Y-Cen); x2 = x1 * cos(roll) - y1 * sin(roll)+Cen; y2 = x1 * sin(roll) + y1 * cos(roll)+Cen-pitch; glTexCoord2f(x2,y2); glVertex3f(x+x_s, y, 0.0f); x1=(la_X-Cen); y1=(la_Y-Cen); x2 = x1 * cos(roll) - y1 * sin(roll)+Cen; y2 = x1 * sin(roll) + y1 * cos(roll)+Cen-pitch; glTexCoord2f(x2,y2); glVertex3f(x+x_s,y+y_s, 0.0f); x1=(sm_X-Cen); y1=(la_Y-Cen); x2 = x1 * cos(roll) - y1 * sin(roll)+Cen; y2 = x1 * sin(roll) + y1 * cos(roll)+Cen-pitch; glTexCoord2f(x2,y2); glVertex3f(x, y+y_s, 0.0f); glEnd(); And real-time map view of the right side on the figure 6 has extension steps of 10 levels and it displays the map information online. Map information is provided from MapServer for World Street Map of ArcGIS and the MapServer supplies the scale of from 1 to 73,874,399 to 1 to 144,285. If up-and-down directional keys is pressed the scale is automatically changed and the corresponding level is represented in the left side. In the middle part of the map the longitude and latitude coordinates for current flight are arranged and the divided map images of 2,097,152 pieces at the most are arranged on the display view to fit to the corresponding longitude and latitude degrees. Next code 3 presents one part of the code to make a mapping in real-time. Code 3 : Fuction for texture mapping of Map void textures_run(){ int i, j, no=1; x_st=abs((int)(((-180)-lon)/zoom_ra)); y_st=abs((int)((lat-90)/zoom_ra)); for(i=-1;i