OPERATIONAL USE OF A STATISTICAL FORECASTING TOOL ON THE SEWARD HIGHWAY, ALASKA Matt Murphy1* and Jordy Hendrikx 2 1 2
Alaska Department of Transportation and Public Facilities, Anchorage, AK, USA
Snow and Avalanche Laboratory, Department of Earth Sciences, Montana State University, Bozeman, MT, USA.
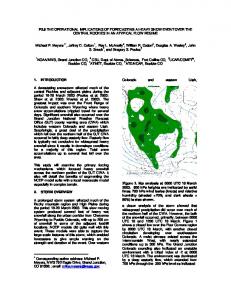
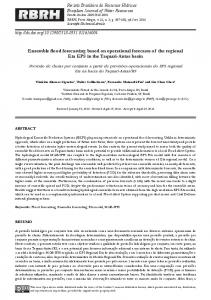
ABSTRACT: A variety of statistical avalanche forecasting tools using meteorological and snowpack predictors have been developed in many different snow avalanche environments around the World. They have also been used in “quasi-operational” settings in many places with mixed success. Despite numerous attempts using a range of statistical approaches, in different snow and avalanche climates, these statistical models tend to reach a statistical prediction ceiling of approximately 80-90% for overall accuracy. While encouraging, and of utility for learning and the transfer of institutional memory, this level of accuracy is still not widely considered adequate for real time operational uses. This paper will present an operational use case for a dual classification tree model which has been imbedded into the operational forecasting program for the Seward Highway in Alaska for the last two winters. We will discuss how this model is used as a tool, as part of the daily routine, and how the limitations in the model are operationally addressed. Of particular interest is that this model was of more use to predict the end of avalanche activity, rather than the onset of activity, which was typically more obvious. We will present two seasons of results and a case study to illustrate the utility of the model. These results have particular relevance to avalanche programs that want to consider incorporating a statistical tool as part of their program. KEYWORDS: Avalanche Forecasting, Statistical Forecasting, Operational Decisions. 1. INTRODUCTION & BACKGROUND The Seward Highway Avalanche Program (SHAP) has been a full time active operation since 1983 following nearly 30 years of intermittent avalanche work dating back to the 1950’s. The highway follows a route through the Chugach and Kenai Mountains between Alaska’s largest population center of Anchorage and the ice-free port of Seward. The highway was completed in 1951, but avalanches have had a long history of affecting this transportation corridor prior to highway construction dating back to the early 1900’s. Early records of avalanches include an accident two miles north of Girdwood on April 28, 1920 when six railroad workers were killed by a secondary avalanche that occurred while crews were removing debris from a previous snow slide (AMSC, 2003). * Corresponding author address: Matt Murphy, Alaska Department of Transportation and Public Facilities, Anchorage, AK, USA; tel: 907-783-2772; email:
[email protected]
In May of 1952, during the first year of highway operations, an incident with two avalanches resulted in a car being destroyed and pushed into Turnagain Arm, and the death of one pedestrian by the second avalanche (Mears, 1983). This accident highlighted the importance for the Department of Highways to begin an avalanche program. During the early years of the Seward Highway, attempts were made to reduce the avalanche hazard which included:
Building earth mounds as avalanche breakers north of Girdwood in the mid 1950’s Working with the U.S. Army and Alaska National Guard for artillery support between 1955-1968 Establishing an Alaska’s first avalanche research station near Girdwood in 1958 The installation of a ridge top weather station above Turnagain Arm in 1959
Prior to the mid 1970’s, there were only 3 years (1959-1962) during this first era of avalanche work when full-time personnel had the primary duties of
Murphy, M., and Hendrikx, J., 2014. Operational use of a statistical forecasting tool on the Seward Highway. Proceedings of the International Snow Science Workshop, September 28 - October 3, 2014, Banff, Alberta, Canada.
avalanche observations and forecasting (Hamre, 1979). There was staffing for avalanche specialists during the other years, but it was intermittent and avalanche decisions were primarily made by foremen and superintendents. Problems with rime ice destroying ridge top weather stations and inaccessible terrain made alpine weather and snowpack observations stations difficult and unreliable; so, most of the avalanche and weather observations came from lower elevation weather stations and road patrols. In the early 1980’s, U.S. Congress passed legislation enabling state governments to lease military weapons and purchase ammunition directly from the Army. It was during this time that the newly named Alaska Department of Transportation and Public Facilities (ADOT&PF) finally acquired a direct lease for artillery from the Army. Since the early 1980’s, the Seward Highway Avalanche Program has been working under the Maintenance and Operations Division of ADOT&PF. It is staffed by two full-time avalanche specialists and supported part-time by foremen and equipment operators who temporarily suspend regular highway maintenance during avalanche cycles to fire artillery, conduct traffic control, and remove debris from the highway in support of avalanche work. Since 1983, the Seward Highway Avalanche Program has been recording daily weather observations from the maintenance station in Girdwood, and conducting regular road patrols to maintain a data base that contains more than 4500 individual avalanche events. Hendrikx et al., (2014) used these avalanche event data to train statistical models to predict avalanche occurrences that would affect the roadway (i.e. 90% or greater of path length, where 100% represents the roadway). This paper presents an operational use case of these statistical models, showing two years of results and one case study example.
oped these classification tree models using 28 years of data, but used different misclassification costs, with one tree having equal misclassification costs (equal), while the other has higher cost for incorrectly classifying observed avalanche days as non-avalanche days (i.e. the false negatives) (Unequal). Operationally, SHAP used the combination of these two models as guidance to supplement the traditional avalanche forecast. This method produced 3 categories of statistical forecasts:
AVO (equal) /AVO (unequal): represented a high level of confidence by the models that at least one avalanche would run at least 90% of its path. NONAVO (equal) /AVO (unequal): represented a level of uncertainty by the models of whether at least one avalanche could occur. NONAVO (equal) /NONAVO (unequal): represented a high level of confidence by the models that no avalanches greater than or equal to 90% will occur.
An avalanche hitting a roadway is a critical threshold for a highway operation; so, SHAP has historically calculated 100% of the run out distance as the location of the road, not the maximum run out distance of the avalanche path which is traditionally used in measuring avalanches. Since the models are trained to forecast for avalanches equal to or greater than 90%, they are intended to forecast road hits and avalanches stopping just short of the highway (Hendrikx et al., 2014). We therefore considered the case of road hits (i.e. 100%), and avalanches that came close to the road (i.e. 90-100%) to reflect on the usefulness of this approach. We also examine a case study in more detail to provide a narrative of a typical use case.
2. METHODS
3. RESULTS
During the 2012-13 and 2013-14 winter seasons, the Seward Highway Avalanche Program (SHAP) issued a total of 288 days of avalanche forecasts using a combination of an avalanche forecast derived from statistical models (Hendrikx et al., 2014) and a traditional hazard rating issued by avalanche forecasters. Two different classification tree statistical models were used, one of which was conservative and another which tended to be less conservative with a wider range of parameters for determining avalanche days versus nonavalanche days. Hendrikx et al., (2014) devel-
3.1 2012-2013 Data The winter of 2012-2013 resulted in a total of 142 days that had a combination of a model forecast and a manual hazard rating issued by an avalanche specialist. There were 19 days with observed avalanche activity running ≥ 90% of its avalanche path, and there were 123 days with no avalanche activity within these defined parameters (Table 1).
Murphy, M., and Hendrikx, J., 2014. Operational use of a statistical forecasting tool on the Seward Highway. Proceedings of the International Snow Science Workshop, September 28 - October 3, 2014, Banff, Alberta, Canada.
Table 1: A contingency table for the 2012-13 winter showing the observed avalanche and non-avalanche days (columns) and the predicted statistical forecast category (rows).
Table 2: A contingency table for the 2013-14 winter showing the observed avalanche and non-avalanche days (columns) and the predicted statistical forecast category (rows).
2012-2013 Winter
Observed Avalanche Days
Observed NonAvalanche Days
2013-2014 Winter
Observed Avalanche Days
Observed NonAvalanche Days
AVO/AVO
10
12
AVO/AVO
2
20
NONAVO/AVO
9
82
NONAVO/AVO
9
66
NONAVO/NONAVO
0
29
NONAVO/NONAVO
0
49
19
123
11
135
Totals
The statistical models forecasted 100% of the 19 avalanche days as either AVO/AVO or NONAVO/AVO, and zero avalanche days occurred when the models forecasted NONAVO/NONAVO. Although all avalanche days were forecasted by the models, there was also an increased rate of false positives on the days with no observed avalanche activity. During the 123 days when no avalanches were observed, 76% were forecasted as either AVO/AVO or NONAVO/AVO. Only 24% were forecasted as NONAVO/NONAVO.
3.2 2013-2014 Data Unusually low precipitation amounts of snow and water content created a mild avalanche season for 2013-2014 resulting with zero avalanches hitting the road; however, there were a total of 11 days with avalanche activity running ≥ 90%. A total of 146 days were recorded with both a hazard rating and a model forecast. The model predictions were similar to the previous year with 100% of the avalanche days occurring during AVO/AVO and NONAVO/AVO days. Zero avalanches within the parameters of this study occurred when the model forecasted NONAVO/NONAVO (Table 2). However, also similar to the previous year, there was a high rate of false positives during days with no observed avalanche activity. During the 135 days when no avalanches were observed, 64% were forecasted to have some level of avalanche activity and predicted as either an AVO/AVO or NONAVO/AVO day, and 36% were forecasted as NONAVO/NONAVO.
Totals
3.3 January 2014 Case Study At the start of January 2014, the avalanche paths that affect the Seward Highway were covered by a thin snowpack composed mostly of faceted snow at and above the ground interface. This snowpack structure was widespread throughout the region, and extended from sea level up to the alpine. By January 12, a series of storms dominated the south central coast of Alaska resulting in measurable precipitation for 15 out of the next 16 days. Rain fell as high as the ridge top elevations due to record breaking high temperatures for the month of January. Avalanches running ≥ 90% of avalanche paths that affect the Seward Highway occurred on 3 separate days during this 15 day avalanche cycle. The first observed avalanche day was recorded on January 14th when 3 naturally triggered avalanches stopped well short of the highway after the models had increased from NONAVO/NONAVO on January 13th to an NONAVO/AVO forecast for the 14th. The most active avalanche day during this time period occurred on January 17th. The models appear to have captured this trend as they increased to AVO/AVO for the first time during this avalanche cycle on the 17th. The corresponding avalanche activity that day resulted in 6 artillery triggered avalanches and 2 naturally triggered avalanches running greater than 90% but without hitting the roadway. Eight out of next ten days were forecasted as AVO/AVO days and the other two days were NONAVO/AVO days following periods of decreased precipitation. During this time there were no avalanches ≥ 90% observed or reported in the paths that affect the Seward Highway which had been shot with artillery; however, there were large avalanches observed in
Murphy, M., and Hendrikx, J., 2014. Operational use of a statistical forecasting tool on the Seward Highway. Proceedings of the International Snow Science Workshop, September 28 - October 3, 2014, Banff, Alberta, Canada.
unmitigated paths that do not directly affect the highway on January 23rd and 25th. By January 28th, the weather had improved allowing for the Alaska Railroad to deliver explosives via helicopter to some avalanche paths that are not regularly mitigated with artillery but can infrequently affect the railroad and highway. The model forecast had decreased to NONAVO/AVO for the first time in this cycle, following 6 consecutive days of AVO/AVO, but the snowpack was still thought to be reactive even after 3 days since the last known natural avalanche occurrence in the region. This explosive control work resulted in a large avalanche stopping just short of the railroad tracks (which are adjacent to the highway). 4. DISCUSSION Having statistical models accurately forecast future avalanche events would be most beneficial for public safety and avalanche operational decisions. The statistical models for the Seward Highway have accurately forecasted all avalanche days like on January 17, 2014, but they have done this with a high rate of false positives on nonavalanche days requiring significant interpretation by the avalanche forecasters. In part this high rate of false positives is likely due to the fact that the model does not currently have a built in snow depth threshold included. This means that many early season storms that have sufficient snow to suggest avalanche activity (i.e. AVO/AVO) are in fact not real avalanche days as the snowdepth is not currently sufficient to overcome the ground and or vegetation roughness. Further refinement of the models is expected to address some of the issues with the high level of false positives. A clear weakness with statistical modeling is the uncertainty within the AVO/AVO and NON AVO/AVO days which occurred 80% of the days in 2012-2013, and 66% of the days in 2013-2014. Operationally, these days require the insight of the avalanche forecaster to weigh all factors for actual hazard ratings. Some of the uncertainty occurs because the model does not calculate the success of the Avalanche Forecasting and Explosive Control (AFEC) program. For example, during the storm cycle in January 2014, there was a long stretch of AVO/AVO days, but the hazard rating was only rated at Level 3 “Considerable” on January 17th which was the most active day for artillery and natural avalanches. All of the remaining AVO/AVO days between January 17 and 27 were rated at Level 2 “Moderate” in part because of the previous artillery work that had been successful at
reducing the avalanche hazard for the highway paths. While the weather data met the conditions that are typical for a dual avalanche day (i.e. AVO/AVO), the observed hazard was lower in the paths that affect the Seward Highway because they had previously been mitigated with artillery. Other avalanche paths in the region that do not affect the highway or that do not get mitigated on a regular basis did, however, continue to show avalanche activity after the January 17th artillery work. Another potential by-product of these statistical models could be timely and accurately forecasting trends of decreasing danger. Dropping down to the lowest hazard rating can be one of the most difficult decisions for an avalanche forecaster, but it can be very beneficial. For a highway avalanche program, the lowest hazard rating allows for fewer restrictions on operations. Accurately forecasting these low hazard days can help justify special projects within avalanche areas like: allowing traffic control, guardrail repair, surveying, fixing potholes or having any equipment work in areas that would be too risky for stationary or stagnant work at any other hazard rating. In both winter seasons where we have used statistical models we have observed a 100% accuracy with the NONAVO/NONAVO model forecasts. There have been zero avalanches running ≥ 90% on these days. When we consider our January 2014 case study we can observe the conservative nature of these models. Despite no new natural avalanche activity and relatively mild weather for 3 days prior to January 28, 2014, the helicopter-bombing results provide a good example of how the model was capturing the decreasing trend from AVO/AVO to NONAVO/AVO, but still holding on to some level of risk for avalanche activity. The corresponding hazard rating was at Level 2 “Moderate” on the 28th and did not decrease to Level 1 “Low” until 1/30/2014. The models showed a more conservative trend and did not decrease to NONAVO/NONAVO until 2/2/2014. 5. CONCLUSIONS The data from statistical models being used by the Seward Highway Avalanche Program have been a beneficial supplement to the traditional forecast. This additional tool has provided a very quick method for cross referencing 30 years of data, which can be a time consuming task while producing hazard assessments. The model data, however, is similar to weather station data because it must be interpreted by an avalanche specialist to determine pertinent infor-
Murphy, M., and Hendrikx, J., 2014. Operational use of a statistical forecasting tool on the Seward Highway. Proceedings of the International Snow Science Workshop, September 28 - October 3, 2014, Banff, Alberta, Canada.
mation. Further use and refinement of the models will hopefully lead to incremental improvements including a snow depth threshold to reduce uncertainty during early season storm cycles. Additionally there is no means to account for hazard reduction in the avalanche paths that get regular explosive mitigation. Despite the high rate of false positives related to this explosive mitigation, the models can still highlight some of the residual risk in the avalanche paths that are less frequently mitigated as seen in January 2014. Another benefit of the models is that they may provide timely but conservative estimates of decreasing avalanche hazard to complement regular hazard assessments, especially for special highway work projects within avalanche areas. 6. ACKNOWLEDGEMENTS We would like to thank the Alaska Department of Transportation and Public Facilities, and all the people that have worked on the Seward Highway. Without their observations and ongoing efforts this work would not have been possible. REFERENCES AMSC, 2003. Avalanche Atlas. Report prepared by Alaska Mountain Safety Center, Inc for Chugach Electric Association; Anchorage, Alaska. Hamre, D., 1979. Seward Highway Avalanche Safety Plan. Report prepared by Alcan Avalanche Services for the Alaska Department of Transportation and Public Facilities; Central Region, Maintenance & Operations and Graphics Section. Hendrikx, J., Murphy, M., Onslow, T., 2014. Classification trees as a tool for operational avalanche forecasting on the Seward Highway, Alaska. Cold Regions Science and Technology. 97, 113-120. DOI: 10.1016/j.coldregions.2013.08.009. Mears, A., 1983. Snow Avalanche Hazard and Control Analysis-Seward Highway, Bird Creek to Girdwood Turnoff. Prepared for the Alaska Department of Transportation and Public Facilities
Murphy, M., and Hendrikx, J., 2014. Operational use of a statistical forecasting tool on the Seward Highway. Proceedings of the International Snow Science Workshop, September 28 - October 3, 2014, Banff, Alberta, Canada.