These approaches deserve control overheads and the finding accuracy ... With the increasing sensor node density, it becomes difficult to detect the clone node ...
Asian Research Consortium Asian Journal of Research in Social Sciences and Humanities Vol. 6, No. 11, November 2016, pp. 201-217.
Asian Journal of Research in Social Sciences and Humanities
ISSN 2249-7315 A Journal Indexed in Indian Citation Index
www.aijsh.com
DOI NUMBER:10.5958/2249-7315.2016.01186.2 Category : Science and Technology
Optimal Clone Attack Detection Model using an EnergyEfficient GSA based Simulated Annealing in Wireless Sensor Networks Rajesh Kumar Dhanaraj*; Dr. Shanmugam A**; Dr. Palanisamy C***; Dr, Natarajan Am**** *Bannari Amman Institute of Technology, Sathyamangalam, India. **SNS College of Technology, Coimbatore, India. ***Bannari Amman Institute of Technology, Sathyamangalam, India. ****Bannari Amman Institute of Technology, Sathyamangalam, India.
Abstract Security of Wireless Sensor Networks (WSN) is an essential challenge as the sensors are deployed in open environment and they are prone to various attacks. One among them is the clone attack. Hence clone node discovery is a vital challenge in WSN. Various clone node discovery approaches have been projected to sense these clone nodes. These approaches deserve control overheads and the finding accuracy is low when the clone is chosen as a witness node. In this proposed method, a Residual Energy and Gravitational Search Algorithm based Simulated Annealing (RE-GSASA) for identifying and isolating the clone node in WSN is investigated. The performance of the proposed model is calculated using detection rate, packet delivery rate and sensor node density. The results show that the effectiveness of RE-GSASA method in terms of optimized energy consumption and improves clone node detection probability rate by minimizing the clone node detection time. The implementation is done using ns-2 to exhibit the actuality of the proposed work.
Keywords: Wireless Sensor Networks, Data aggregation, Clone attack, Gravitational Search Algorithm, Simulated Annealing.
201
Dhanaraj et al. (2016). Asian Journal of Research in Social Sciences and Humanities, Vol. 6, No.11, pp. 201-217.
1. Introduction The data packets acquired from multiple sensor nodes are aggregated at an aggregator node. The aggregated node then forwards the packets to the base station only the aggregate values. During data aggregation, once a node is being captured by an adversary or malicious node and generates a clone of it and through it propagates into the entire network, causing serious threats to the entire network. Many research works have been contributed to the detection and isolation of cloned or replica attack nodes. A secure data aggregation technique in the presence of collision attacks was designed in [1] by improving iterative filtering techniques that was proved to be more accurate and robust against collision attacks. Gravitational Search Algorithm (GSA) [2] has been recently suggested as an effective security mechanism for WSN. Though WSN has been deployed in several applications, performing data aggregation has remained a challenging issue. In this context, assessing the convergent speed and convergent accuracy during data aggregation becomes a challenging task. In [3], Gravitational Search Algorithm based on Simulated Annealing was investigated to obtain the optimal solution. With the increasing sensor node density, it becomes difficult to detect the clone node and normal node. In [4], random walk and table assisted random walk was designed to detect clone attacks in WSN. Different methods have been presented to detect the clone attack node in WSN. Concealed data aggregation [5] was performed to identify clone attack based on recoverable concept. An algorithm called, enhanced single hop detection [6] was applied in mobile WSN to detect the presence of clones using Clonal Selection Algorithm. A survey of detection and mitigation of node replication attack in WSN was presented in [7]. Detection and defending against replica attack using location binding symmetric key scheme was presented in [8]. In this work, we introduce a concept named Residual Energy and GSA based Simulated Annealing (RE-GSASA). In RE-GSASA, the cloned attack nodes are detected and isolated using GSA based Simulated Annealing with the aid of the witness node. With these objectives, three functionalities are provided. First, data aggregation is performed based on the residual energy. Next, node ID, location information and residual energy are used as a basis to measure the clone attack detection probability. Finally, a witness node is selected using GSA that detects the cloned attack node in the cluster with similar residual energy and isolates the nodes from the network using optimal simulated annealing. Through experiments, we show that the performance of our design is reasonable and also provide detailed comparisons with other methods. This paper is organized as follows: In Section 2, various related works towards this clone attack detection and isolation method implemented by different authors are discussed. In Section 3, the network model, followed by the problem formulation and the proposed RE-GSASA method is discussed. In Section 4, experimental setting with the parameter definitions is provided. In Section 5, the performance of the proposed method is compared with the existing methods based on certain performance metrics and finally Section 6 concludes the paper. 202
Dhanaraj et al. (2016). Asian Journal of Research in Social Sciences and Humanities, Vol. 6, No.11, pp. 201-217.
2. Related Works Despite its practical appeal, clone attack node detection and isolation has received surprisingly little attention in the literature. In this section we will present the related work. A new hierarchical distributed algorithm was designed in [9] with the objective of improving the energy efficiency. In [10], wormhole attack detection using pair-wise key pre-distribution technique was designed. Another method to identify the clone detection in static wireless sensor network using Random Walk with Network Division (RWND) [11] was designed. Energy efficiency is also related to measure clone attack detection in WSN. In [12], a novel distributed detection protocol to mitigate against node replication attack was presented resulting in improving the overall network. Another replica detection scheme using public key cryptography [13] was designed which not only improved the detection rate but also decreased the communication overhead. An intrusion detection method based on cluster was designed in [14] by applying artificial fish swarm optimized back propagation algorithm. Markov decision process and inner and outer bounds for optimal policy was investigated in [15] to reduce the computational complexity involved in detecting attack. Resource depletion attacks called vampire attack was studied in [16] and measures to mitigate the attack through proof of protocol concept was introduced. In [17], strategies to provide defense mechanism to mitigate against optimal jamming attack was presented aiming at improving the detection rate using heuristic model. To ensure confidential transmission, data aggregation and authentication protocol [18] was designed that helped in early detection of false attack. In [19], constrained version of relay node placement problem was studied to obtain optimal solutions to prolong the lifetime of network. In [20], fast detection of mobile replica attack node was presented using sequential probability ratio test. In general, clone attack node detection and isolation still remains as the most popular measure as the attacker can create any number of clone nodes. In the following sections, we propose a novel method to detection and isolate the cloned attack node in clustered nodes possessing similar residual energy, and consequently formulate new criterion functions in WSN.
3. Residual Energy and GSA based Simulated Annealing In wireless sensor network, due to the unsecured environment, an adversary node can seize a sensor node, reconstruct it and produce a clone of the seized node. These clone node attacks poses serious threats because with the single seized sensor node, the adversary node create as many cloned nodes as he requires. In this section, Residual Energy and GSA based Simulated Annealing (RE-GSASA) method to efficiently detect and isolate the cloned attack node in WSN, starting with a network model, followed by which problem formulation and the method is presented in detail. 3.1 Network Model Let us consider a wireless sensor network which consists of a Base Station „BS‟, and many sensor nodes „SN = SN1 , SN2 , … , SNn ‟ randomly deployed in a „1200 ∗ 1200m‟. Let us further design the wireless sensor network in the form of an undirected graph „G = (V, E)‟, where „V‟ and „E‟ 203
Dhanaraj et al. (2016). Asian Journal of Research in Social Sciences and Humanities, Vol. 6, No.11, pp. 201-217.
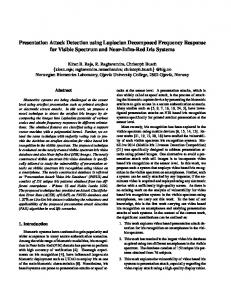
represents the set of sensor nodes and edges respectively. Prior to deployment, every sensor nodes in the network is assigned a key also called as the unique node ID „SNID ‟. A Unit Disk Graph model is used in our work in which two sensor nodes are connected if their distance is below a fixed threshold „τ ≤ 1‟ and therefore „p, q ∈ E‟. All sensor nodes in the network are considered to be limited in communication and computation power and also the battery life. So, every sensor in the network directly communicate with „n‟ other sensor nodes, also known as the neighbor nodes. 3.2 Problem Formulation The sensor nodes in wireless sensor networks are highly susceptible to attacks in hostile scenario. The adversary seizes certain nodes, modifies the node and acquires all the secret data. Therefore the compromised node creates clones of such malicious nodes gaining control of the entire network by establishing these replicas in the network. It is the goal of this paper to detect and isolate the clone attack using RE-GSASA method and improve clone attack detection probability by reducing clone attack detection time during data aggregation in WSN. 3.3 Residual Energy-based Data Aggregation in WSN Wireless Sensor Network (WSN) comprises of number of sensor nodes and a base station node where the base station node is considered to be more secured and possess unlimited available energy when compared to the other sensor nodes in the network. The task of sensor node is to monitor the geographical area and collect sensory information and communicate them to the Base Station. In order to preserve energy, the collected sensory information has to be aggregated at intermediate sensor nodes by using a suitable aggregation model on the data received. In this work we use Residual Energy-based Data Aggregation (RE-DA). Residual Energy-based Data Aggregation collects data from multiple sensor nodes and provides that fused data to base station node according to the residual energy so as to avoid redundant transmission of data. The main aim of this Residual Energy-based Data Aggregation is to minimize the energy consumption during clustering process by exchanging fewer packets between the nodes. Fig 1 shows the sensor node organization in clusters and communication between the nodes to the cluster head and then to the base station based on the residual energy.
204
Dhanaraj et al. (2016). Asian Journal of Research in Social Sciences and Humanities, Vol. 6, No.11, pp. 201-217.
Base station
Cluster Sensor nodes
Cluster
Fig 1Residual Energy-based Data Aggregation As shown in the fig 1 the proposed work chooses its aggregators based on residual energy to optimize the total energy consumption of the aggregation process with the sensor node having highest residual energy is selected as the cluster head. Other sensor nodes select their cluster head node among their neighbors according to the residual energy and distance to the cluster head. Let „Econsump ‟ be the energy consumption for one iteration. Let us consider the distance between the sensor node and base station in one iteration of packet transmission from a sensor node to the base station „BS‟ be twice the distance between the sensor node and base station and is formulated as given below. (1)
Energy_Con = 2 ∗ (DisSN →BS ) If it is two iterations then, the energy consumption is as given below. 2 ∗ Energy_Con = 22 ∗ (DisSN →BS )
(2)
Therefore, for „n‟ iterations, the energy consumption is as given below. n ∗ Energy_Con = 2n ∗ (DisSN →BS )
(3)
Hence, the residual energy for one sensor node after „n‟ iterations is as given below. Energy_Residualn = E − n ∗ EnergyCon = E − n ∗ 2n ∗ (DisSN →BS )
205
(4)
Dhanaraj et al. (2016). Asian Journal of Research in Social Sciences and Humanities, Vol. 6, No.11, pp. 201-217.
From (4), „E‟ denotes the initial energy of the sensor node then, the residual energy for all sensor nodes (i.e. total residual energy) in the network is as given below, Energy_Residualtotal =
n i=1 Ei
− n ∗ 2n ∗ Disi
(5)
With the obtained total residual energy from (5), clustering of sensor nodes for data aggregation is performed based on residual energy. This in turn reduces the time duration for data transmission over the network increasing the energy efficiency. Fig 2 shows the Residual Energybased Data Aggregation algorithm. Input: Base Station „BS‟, Sensor Nodes „SN = SN1 , SN2 , … , SNn ‟, Base Station „BS‟, Iteration „n‟ Output: Optimized energy consumption 1: Begin 2: For each Sensor Node „SN‟ and „n‟ iterations (to perform clustering) 3: Measure energy consumption using (3) 4: Measure residual energy using (4) 5: Measure residual energy for „n‟ sensor nodes using (5) 6: End for 7: End
Fig 2 Energy-based Data Aggregation Algorithm A distance weight taking account of the residual energy during clustering for data aggregation is presented in the proposed algorithm. Through the algorithm, the energy consumption during single iteration, two iterations and „n‟ iterations are measured. With this the residual energy for one sensor node and for all the sensor nodes in the network is obtained. 3.4 Location-based Cloned Attack on Cluster Nodes Once, the sensor nodes are clustered based on the similar residual energy model from Energy-based Data Aggregation (figure) algorithm, the next step is to identify any cloned attack on clustered nodes are present. Cloned attacks occur in different cases. The proposed method analysis the occurrence of cloned attack on clustered nodes based on similar residual energy. During data aggregation process every sensor node „SN‟ in the network sends its ID and location information „(SNID , SNr,c )‟ to the base station „BS‟ through other sensor nodes (i.e. neighboring nodes). Here, „SNID ‟ symbolizes the sensor nodes ID whereas „SNr,c ‟ symbolizes the sensor node positioning or location represented in the row and column „r, c‟ respectively. Fig 3 shows the occurrence of cloned attack on cluster nodes based on similar residual energy.
206
Dhanaraj et al. (2016). Asian Journal of Research in Social Sciences and Humanities, Vol. 6, No.11, pp. 201-217.
Base station
25J
40J
Cloned attack node
Fig 3 Structure of Cloned Attack on Cluster Nodes based on Similar Residual Energy As shown in the figure 3, upon receiving the location claims from all the sensor nodes, the base station checks the node IDs. If the base station receives two different locations „SNID 1 , SNr,c ‟ and „SNID 2 , SNr,c ‟ with the similar node ID „SNID 1 = SNID 1 ‟ with similar residual energy „Energy_ResidualSNID 1 = Energy_ResidualSNID 1 ‟, but with different location, then the base station concludes that at least one of the sensor nodes is a cloned attack node (fig 3), or else the base station realizes that no attack node is present in the network and proceeds with the data transfer. Fig 4shows the algorithmic representation of Cloned attacks on Clustered Nodes. Input: Base Station „BS‟, Sensor Nodes „SN = SN1 , SN2 , … , SNn ‟, Base Station „BS‟, Sensor Node ID „SNID = SNID 1 , SNID 2 , … , SNIDn ‟, Sensor Node ID „SNID = SNID 1 , SNID 2 , … , SNIDn ‟, Location information „(SNr,c )‟, Residual energy „Energy_ResidualSNID ‟ Output: Improves Clone attack detection probability 1: Begin 2: For each iterations and „n‟ sensor nodes 3: Sensor node sends it ID „SNID ‟ and location information „SNr,c ‟ to the base station „BS‟ 4: If (SNIDi = SNIDj ) && (Energy_ResidualSNIDi = Energy_ResidualSNID j) && (SNIDi r,c SNIDjr ,c ) 5: Occurrence of cloned attack node 6: Else 7: Occurrence of normal node 8: End if 9: End for 10: End
Fig 4 Cloned attack on Clustered Nodes
207
Dhanaraj et al. (2016). Asian Journal of Research in Social Sciences and Humanities, Vol. 6, No.11, pp. 201-217.
As shown in the fig 4, the cloned attack on clustered nodes is said to occur only if two sensor nodes possess similar node ID and residual energy but with different location. In this case, either of the sensor nodes is considered as the cloned attack node by the base station. The next step is to select the witness node that detects the cloned attack node which is discussed in the next section. 3.5 GSA based Simulated Annealing Finally, a GSA based Simulated Annealing model is applied to select the witness node that detects the cloned attack node and isolate the cloned attack node in WSN. From [2], it is observed that Gravitational Search Algorithm has global search ability; however, the algorithm lack local search mechanism. On the other hand, Annealing Algorithm, though not found to be good in global searching, can be applied to obtain local optimal solution. Therefore, the proposed method applies an integrated Gravitational Search Algorithm (to detect cloned attack node) based Simulated Annealing (isolate the cloned attack node) to render both the global and local search capabilities. To start with the cloned attack node detection using Gravitational Search Algorithm is presented followed by the optimal annealing model. Let us consider a network with „n‟ sensor nodes (masses). The position of the „ith‟ node is defined as below: Xi = X1i , Xi2 , … , Xik , … . , Xin
(6)
From (6), „Xik ‟, represent the position of the „ith‟ sensor node in „kth‟ dimension. At a particular time „t‟, force acting on mass „i‟ from mass „j‟ is given as below: Fijk = G t ∗
M pi t ∗ M aj t
(7)
Dis ij t + ε
From (7), „Mpi ‟ and „Maj ‟ represents the passive and active relational mass related to the mass of sensor nodes „i‟ and „j‟ respectively. The gravitational constant is represented by „G t ‟ with a small constant „ε‟. The distance between the sensor nodes „i‟ and „j‟ at time „t‟ is represented by „Disij t ‟. To further obtain stochastic characteristics, it is presumed that the total force that acts on sensor node „i‟ in a dimension „e‟ to be an arbitrarily weighted sum of „eth‟ component of the forces applied from other sensor nodes is as given below. Fie = ran Fijk t , j = 1, j ≠ i
(8)
Where „ran‟ represents the random number in the interval „0, 1‟. Hence, according to law of motion, the acceleration of the sensor node „i‟ at a time „t‟ in „kth‟ dimension is given as below. Aei t =
F kij
(9)
M ii (t)
From (9) „Mii (t)‟, represent the inertial mass of the sensor node „i‟ at time „t‟. In order to measure the fitness value to determine the node which is the witness node, gravitational and inertia masses are computed. A sensor node possessing heavier mass represents more efficient node. By 208
Dhanaraj et al. (2016). Asian Journal of Research in Social Sciences and Humanities, Vol. 6, No.11, pp. 201-217.
assuming the equality of gravitational and inertia mass, the values of masses are evaluated with the aid of map of fitness. Therefore, the gravitational and inertial mass is obtained as given below. mi t = Mi t =
Fit i t − Worst (t)
(10)
Best t − Worst (t) mi t n r =1 m r (t)
(11)
Where „Fit i t ‟ denotes the fitness value for „i‟ sensor node at time „t‟ and the „Best t ‟ and „Worst t ‟ is obtained as given below. For a minimization problem, the „Best t ‟ and „Worst t ‟ is formalized as given below, Best t = min Fit n (t)
(12)
Worst t = max Fit n (t)
(13)
For a maximization problem, the „Best t ‟ and „Worst t ‟ is formalized as given below, Best t = max Fit n (t)
(14)
Worst t = min Fit n (t)
(15)
Therefore from (8), the sensor nodes with the best fitness value are assigned as the witness node that detects the presence of cloned attack on cluster nodes with similar residual energy. Once the cloned attack nodes are detected by the witness node that possesses the best fitness value, they (sensor node) are isolated using simulated annealing that operates the annealing of optimal individuals (sensor nodes). At each step, the simulated annealing considers certain neighbor sensor nodes „SN ′ ‟ of the current sensor node „SN‟ and probabilistically decides between moving the system to sensor node „SN ′ ‟ or staying at „SN‟ with the objective of isolating the cloned attack node. This step is repeated until the detected cloned attack node is isolated from the network. The following algorithm presents the simulated annealing process to isolate the detected cloned node in WSN. Fig 5 shows the algorithm using the optimal annealing to operate the optimal individual to improve the capability of local optimization.
209
Dhanaraj et al. (2016). Asian Journal of Research in Social Sciences and Humanities, Vol. 6, No.11, pp. 201-217.
Input: Sensor Node „SN = SN1 , SN2 , . . , SNi , … , SNn ‟ Output: Improves cloned attack detection time 1: Begin 2: Let SN = SNi , where i = 1 to n 3: For n = 0 through SNn 4: Pick a random neighbor SNnew ← Neighbor SNi 5: If Prob Energy_Residual SNi , Energy_Residual SNnew > 𝑅𝑎𝑛 0, 1 6: Move to the next sensor node SNi ← SNnew 7: Cloned attack node does not exist and outputs sensor node SNi and terminate test 8: End if 9: If Prob Energy_Residual SNi , Energy_Residual SNnew < 𝑅𝑎𝑛 0, 1 10: Move to the next sensor node SNnew ← SNi 11: Cloned attack node exists and outputs sensor node SNnew and terminates test 12: End if 13: End for 14: End
Fig 5 Optimal Annealing algorithm As shown in the figure, Optimal Annealing algorithm starts from a sensor node „SNi ‟ and continues to process till a maximum of „n‟ steps are arrived at. During the process, a randomly chosen neighbor of a given sensor node „SN‟ is generated. The annealing schedule is defined by the „Energy_Residual‟ function, which should yield the residual energy to use, given the presence of the sensor nodes in the network. The application of GSA based Simulated Annealing reduces the cloned attack detection time.
4. Simulation Settings In this section we evaluate performance of RE-GSASA method via simulation. The RE-GSASA method has been compared to iterative filtering techniques [1] and Gravitational Search Algorithm (GSA) [2] in WSN. The simulation parameter used for conducting the experiments is given below (table 1). The sensor nodes in RE-GSASA method are positioned in uniform topology.
Table 1 Simulation Parameters Parameters Network area Number of sensor nodes Number of data packets i.e., size of data block Range of communication Speed of node Simulation time Number of runs
Values 1200 m * 1200 m 10,20,30,40,50,60,70 9, 18, 27, 36, 45, 54, 63 30 m 0 – 10 m/s 500ms 7
The network consists of 70 nodes, placed in a random manner in the wireless sensor network that generates traffic for every 10 m/s. The base station node collects the data from different sensor nodes with a range of 9 – 63 and forwards the data to the base station node. The size of each data packet size varies from 100 KB to 512 KB. The simulation time varies from 500 210
Dhanaraj et al. (2016). Asian Journal of Research in Social Sciences and Humanities, Vol. 6, No.11, pp. 201-217.
simulation seconds to 1500 simulation seconds and the following metrics like energy consumption during data aggregation, clone attack detection probability rate and packet delivery ratio in Wireless Sensor Network is measured. Energy consumption for data aggregation at the base station node is the product of energy consumed by a single sensor node and the total sensor nodes in WSN. (16)
EC = EnergySN ∗ TotalSN
From (16), „EC‟ is the energy consumption for data aggregation at the base station node whereas „SN‟ represents the sensor nodes. The consumption of energy is measured in terms of Joules. Whenever sensor nodes in the network send data, due to the presence of replica or cloned attack nodes in WSN, possibility of packet drops occur during data packet transmission, that creates a clone for a specific sensor node and inject the false data through the sensor nodes and send to the base station. The base station node then collects that data from the sensor node. As a result, clone attack node gets aggregated at the base station. Cloned attack detection probability rate is the ratio of difference between the overall sensor node and cloned attack node to the overall sensor node in WSN. The clone attack detection probability rate is formulated as given below CADP =
SN i − SN CN
(17)
SN i
From (17) the cloned attack detection probability rate „CADP‟ is obtained using the overall sensor nodes „SNi ‟ and the cloned attack sensor nodes „SNCN ‟ during data aggregation in WSN. Average Packet Delivery Ratio is the ratio of the number of data packets received successfully at the base station and the total number of packets transmitted by the sensor nodes. PDR =
Pr Ps
(18)
∗ 100
From (18), the packet delivery ratio „PDR‟ is obtained using the number of packets received at the base station node „Pr ‟ to the number of packet sent by the sensor node „Ps ‟ respectively.
5. Discussion In this section the result analysis of RE-GSASA method is evaluated and compared with two existing methods, Iterative Filtering Techniques and GSA [2] in WSN. The nodes in RE-GSASA method are positioned in uniform topology. To evaluate the efficiency of RE-GSASA method, the following metrics like energy consumption during data aggregation, cloned attack detection probability and packet delivery ratio in Wireless Sensor Network is measured. 5.1 Scenario 1: Energy Consumption during Data Aggregation The values obtained through (16) are tabulated (in table 2) for different node density using the proposed RE-GSASA method and compared elaborately with the existing two works Iterative Filtering Techniques [1] and GSA [2] respectively.
211
Dhanaraj et al. (2016). Asian Journal of Research in Social Sciences and Humanities, Vol. 6, No.11, pp. 201-217.
Table 2 Tabulation for Energy Consumption during Data Aggregation Sensor Nodes
Energy consumption during data aggregation (J) RE-GSASA Iterative Filtering GSA Techniques 54 59 62 68 73 78 79 84 89 84 89 94 98 103 108 105 110 115 118 123 128
10 20 30 40 50 60 70
Energy consumption during data aggregation (J)
Figure 6 shows the energy consumption during data aggregation with respect to different node density. To better observe the efficiency of the RE-GSASA method, substantial experimental results are illustrated in Figure 6 and compared against the existing Iterative Filtering Techniques [1] and GSA [2] respectively. 140
120 100
RE-GSASA
80 Iterative Filtering Techniques
60 40
GSA
20 0 10
20
30
40
50
60
70
Sensor Nodes
Figure 6 Different Energy Consumption Rates with respect to varied Sensor Nodes Figure 6 shows that Residual Energy and GSA based Simulated Annealing consume less energy when compared with Iterative Filtering Techniques and GSA. In RE-GSASA, every forwarding sensor nodes choose its aggregators based on residual energy with the sensor node having the highest residual energy is selected as the cluster head. Thus the clustering of sensor nodes is performed based on residual energy. The transmission of these clustered nodes data packet consumes much battery power resulting in more energy drain. RE-GSASA then provides the fused data to the base station that further does not require any additional process to aggregate so very less energy is discharged. In RE-GSASA method, during data aggregation the sensor nodes exhaust less 212
Dhanaraj et al. (2016). Asian Journal of Research in Social Sciences and Humanities, Vol. 6, No.11, pp. 201-217.
energy whereas in Iterative Filtering Techniques and GSA more energy is exhausted and also due to efficient clustering based on residual energy, RE-GSASA reduces time duration for data transmission. The energy consumed in RE-GSASA is reduced by 6.14% compared to Iterative Filtering Techniques and 11.75% compared to GSA. 5.2 Scenario 2: Cloned Attack Detection Probability From (17), clone attack detection probability rate for different sensor node density in the range of 10 to 70 is measured. The results of seven simulation runs conducted to measure the clone attack detection probability rate are listed in table 3. As listed in table 3, clone attack detection probability rate for three different methods is measured in terms of percentage (%). The clone attack detection probability rate obtained using our method RE-GSASA offer comparable values than the state-ofthe-art methods.
Table 3 Tabulation for Clone Attack Detection Probability Rate Sensor Nodes RE-GSASA 10 20 30 40 50 60 70
91.35 92.14 88.25 90.14 92.31 94.16 96.78
Clone attack detection probability rate (%) Iterative Filtering GSA Techniques 82.49 73.89 83.11 78.05 79.22 75.16 81.11 76.04 83.28 78.22 85.13 80.06 87.75 82.69
Clone attack detection probability rate (%)
The targeting results of clone attack detection probability rate using RE-GSASA method is compared with two state-of-the-art methods Iterative Filtering Techniques and GSA and figure 7 is presented for visual comparison based on the pertinent data provided in Table 3. The figure shows the clone attack detection probability rate with respect to data packets, with each sensor nodes sending different data packets to the base station. 120 100
RE-GSASA
80
Iterative Filtering Techniques GSA
60 40 20 0 10
20
30 40 50 Sensor Nodes
60
70
Figure 7 Different Clone Attack Detection Probability Rates with respect to Varied Sensor Nodes 213
Dhanaraj et al. (2016). Asian Journal of Research in Social Sciences and Humanities, Vol. 6, No.11, pp. 201-217.
The clone attack detection probability method must have a high probability of node replication detection. In addition, in the optimal approach, the detection probability should be designed in such a way to be independent of the sensor network configuration and number of sensor nodes. Fig 7 represents the simulation result of the clone attack detection probability for different methods, when there is only one clone node in the network. From Fig 7 it is observed that for networks with any node density, detection probability of methods is acceptable. But the detection probability was proved to be comparatively better when applied with RE-GSASA. Also it is observed that clone attack detection probability in the existing methods Iterative Filtering Techniques [1] and GSA [2] with increasing size of networks are improves, but with the change of location of sensor nodes continuously; packet loss are increased and therefore, cloned nodes cannot be easily measured. On the other hand, by applying Location-based Cloned attack on cluster nodes, the detection probability is improved that not only compares the sensor node ID and location but also the information regarding residual energy. As a result, the clone attack detection probability rate using RE-GSASA is improved by 9.77% compared to Iterative Filtering Techniques and 15.66% compared to GSA. 5.3 Scenario 3: Packet Delivery Ratio In table 4 we further compare the packet delivery ratio with respect to node density at different time intervals in WSN. The experiments were conducted using seventy sensor nodes and the packet delivery ratio is measured in terms of percentage (%).
Table 3 Tabulation for Packet Delivery Ratio Sensor Nodes RE-GSASA 10 20 30 40 50 60 70
92.35 95.89 87.32 89.41 91.34 93.16 95.87
Packet delivery ratio (%) Iterative Filtering Techniques 84.89 87.79 79.22 81.31 83.24 85.06 87.77
GSA 73.26 78.59 70.02 72.11 74.04 76.06 78.57
Figure 8 given below shows the packet delivery ratio for RE-GSASA method, Iterative Filtering Techniques and GSA versus seventy different sensor nodes. The route searching time returned over EPFMR framework increases gradually though not linear for different node density when compared to the two other methods
214
Dhanaraj et al. (2016). Asian Journal of Research in Social Sciences and Humanities, Vol. 6, No.11, pp. 201-217.
Packet delivery ratio (%)
120 100 80
RE-GSASA
60 Iterative Filtering Techniques
40
GSA
20 0 10
20
30
40
50
60
70
Sensor Nodes
Figure 8 Measure of Packet Delivery Ratio From figure 8, the packet delivery ratio three methods differ according to the number of nodes and data packets sent. As illustrated in Figure, the RE-GSASA method performs relatively well when compared to two other methods Iterative Filtering Techniques [1] and GSA [2]. This is because of the GSA based optimal Simulated Annealing to detects the presence of cloned attack nodes based on the similar residual energy and isolates the node in an optimal manner that simulates the annealing pattern to operate optimal individual gravitational and inertial mass on the basis of node density. Furthermore, RE-GSASA method simulates the annealing model based on the residual energy in addition to the sensor node ID and location. Through this, the packet delivery ratio using the RE-GSASA method is improved by 8.69% compared to Iterative Filtering Techniques and Tula and 19.03% compared to GSA respectively.
6. Conclusion This paper has introduced a novel Residual Energy and GSA based Simulated Annealing (REGSASA) method to reduce both the energy consumption during data aggregation and improve packet delivery ratio and clone attack detection probability rate with varying node density and packets. This joint objective is achieved by performing data aggregation using residual energybased clustering to select the optimal cluster head node and transmitting the data packets to the base station accordingly. The joint objective uses a Location-based Cloned attack on cluster nodes to measure the occurrence of cloned attack on clustered nodes based on similar residual which performs energy saving, and obtains optimum attack detection probability route for different sensor nodes with different packets in WSN. Finally, to obtain the witness node that detects and isolates the cloned attack nodes from the network, GSA-based optimal Simulated Annealing model is investigated that ensures maximum packet delivery ratio. Performance evaluation were conducted and the performance was compared with different system parameters, in terms of different metrics, such as energy consumption during data aggregation, cloned attack node detection probability rate, 215
Dhanaraj et al. (2016). Asian Journal of Research in Social Sciences and Humanities, Vol. 6, No.11, pp. 201-217.
sensor node density and packet delivery ratio. The results show that RE-GSASA method offers better performance with an improvement of energy consumption during data aggregation by 8.94% and packet delivery ratio by 13.86% compared to the state-of-the-art methods.
References Mohsen Rezvani, Aleksandar Ignjatovic, Elisa Bertino, and Sanjay Jha, “Secure Data Aggregation Technique for Wireless Sensor Networks in the Presence of Collusion Attacks”, IEEE Transactions on Dependable and Secure Computing, Volume 12, Issue 1, January/February 2015, Pages 98-110. Esmat Rashedi, Hossein Nezamabadi-pour , Saeid Saryazdi, “GSA: A Gravitational Search Algorithm”, Elsevier, Information Sciences, Volume 179, Issue 13, 13 June 2009, Pages 2232–2248. TONG Chengyi, “Gravitational Search Algorithm Based on Simulated Annealing”, Journal of Convergence Information Technology (JCIT), Volume9, Number2, March 2014, Pages 231-237. Yingpei Zeng, Jiannong Cao, Shigeng Zhang, Shanqing Guo and Li Xie, “Random-Walk Based Approach to Detect Clone Attacks in Wireless Sensor Networks”, IEEE Journal on Selected Areas in Communications, Volume 28, Issue 5, June 2010, Pages 677-691. Chien-Ming Chen, Yue-Hsun Lin, Ya-Ching Lin, and Hung-Min Sun, “RCDA: Recoverable Concealed Data Aggregation for Data Integrity in Wireless Sensor Networks”, IEEE Transactions on Parallel and Distributed Systems, Volume 23, Issue 4, April 2012, Pages 727-734. L. S. Sindhuja and G. Padmavathi, “Replica Node Detection Using Enhanced Single Hop Detection with Clonal Selection Algorithm in Mobile Wireless Sensor Networks”, Hindawi Publishing Corporation Journal of Computer Networks and Communications Volume 2016, Pages 1-14. Wazir Zada Khan, Mohammed Y. Aalsalem, Mohammed Naufal Bin Mohammed Saad, and Yang Xiang, “Detection and Mitigation of Node Replication Attacks in Wireless Sensor Networks: A Survey”, Hindawi Publishing Corporation, International Journal of Distributed Sensor Networks, Volume 2013, March 2013, Pages 1-23. Xiang-yi Chen, Li-xia Meng, and Yong-zhao Zhan, “Detecting and Defending against Replication Attacks in Wireless Sensor Networks”, Hindawi Publishing Corporation, International Journal of Distributed Sensor Networks, Volume 2013, May 2013, Pages 1-11. Wassim Znaidi, Marine Minier, and Stéphane Ubéda, “Hierarchical Node Replication Attacks Detection in Wireless Sensor Networks”, Hindawi Publishing Corporation, International Journal of Distributed Sensor Networks, Volume 2013, February 2013, Pages 1-13.
216
Dhanaraj et al. (2016). Asian Journal of Research in Social Sciences and Humanities, Vol. 6, No.11, pp. 201-217.
Mehdi Sookhak, Adnan Akhundzada, Alireza Sookhak, Mohammadreza Eslaminejad, Abdullah Gani, Muhammad Khurram Khan, Xiong Li, Xiaomin Wang, “Geographic Wormhole Detection in Wireless Sensor Networks”, PLoS ONE, Volume 10, Issue 1, January 2015, Pages 1-21. Wazir Zada Khan, Mohammed Y. Aalsalem, N. M. Saad, “Distributed Clone Detection in Static Wireless Sensor Networks: Random Walk with Network Division”, PLoS ONE, Volume 10, Issue 5, May 2015, Pages 1-22. Yuping Zhou, Zhenjie Huang, Juan Wang, Rufeng Huang and Dongmei Yu, “An energy-efficient random verification protocol for the detection of node clone attacks in wireless sensor networks”, Springer, EURASIP Journal on Wireless Communications and Networking, December 2014, Pages 1-12. Xiaoming Wang,Yaohuan Liao, “A Replication Detection scheme for Sensor Networks”, Elsevier, Procedia Engineering, Volume 29, 2012, Pages 21–26. Xuemei Sun, Bo Yan, Xinzhong Zhang, Chuitian Rong, “An Integrated Intrusion Detection Model of Cluster-Based Wireless Sensor Network”, PLoS ONE, Volume 10, Issue 10, September 2015, Pages 1-16. K. P. Naveen, and Anurag Kumar, “Relay Selection for Geographical Forwarding in Sleep-Wake Cycling Wireless Sensor Networks”, IEEE Transactions on Mobile Computing, Volume 12, Issue 3, March 2013, Pages 475-488. Eugene Y. Vasserman and Nicholas Hopper, “Vampire attacks:Draining life from wireless ad-hoc sensor networks”, IEEE Transactions on Mobile Computing, Volume 12, Issue 2, February 2013, Pages 318-332. Mingyan Li, Iordanis Koutsopoulos, and Radha Poovendran, “Optimal Jamming Attack Strategies and Network Defense Policies in Wireless Sensor Networks”, IEEE Transactions on Mobile Computing, Volume 9, Issue 8, August 2010, Pages 1119-1133. Suat Ozdemir, and Hasan Çam, “Integration of False Data Detection With Data Aggregation and Confidential Transmission in Wireless Sensor Networks”, IEEE/ACM Transactions on Networking, Volume 18, Issue 3, June 2010, Pages 1-14. Satyajayant Misra, Seung Don Hong, Guoliang (Larry) Xue, and Jian Tang, “Constrained Relay Node Placement in Wireless Sensor Networks: Formulation and Approximations”, IEEE/ACM Transactions on Networking, Volume 18, Issue 2, April 2010, Pages 434-447. Jun-Won Ho, Matthew Wright, and Sajal K. Das, “Fast Detection of Mobile Replica Node Attacks in Wireless Sensor Networks Using Sequential Hypothesis Testing”, IEEE Transactions on Mobile Computing, Volume 10, Issue 6, June 2011, Pages 767-782.
217