Evolutionary Ecology Research, 2003, 5: 571–587
Optimal resource allocation explains growth curve diversity in zebra mussels Marcin Czarnołe˛ski,1* Jan Kozłowski,1 Anna Stan´czykowska2 and Krzysztof Lewandowski2 1
Institute of Environmental Sciences, Jagiellonian University, Gronostajowa 3, 30-387 Kraków and 2Institute of Biology, University of Podlasie, Prusa 12, 08-110 Siedlce, Poland
ABSTRACT We analysed data on zebra mussels (Dreissena polymorpha) from 19 European populations characterized by diverse production and mortality conditions revealing remarkable spatial differences in the shape of Bertalanffy’s growth curves. An optimization approach to lifehistory evolution predicts that differences in the pattern of growth reflect shifts in resource allocation maximizing lifetime fitness under different production and mortality rates. We examine the relationships of Dreissena growth curves to the production and mortality rates in the populations, and then compare them with the life-history patterns predicted by a model of optimal resource allocation to growth and reproduction. In accord with the model, Bertalanffy’s growth rate parameter (k) increased and the asymptotic size (Lmax) decreased with rising mussel mortality rate. Contrary to expectations, the parameter k rose and the asymptote Lmax dropped with the increase in the production rate. The predictive power of the model increased after including consequences of fouling of older mussels by younger conspecifics. We assumed that overgrowth, intensifying with better food conditions in a habitat, alters the size specificity of biomass production and accelerates age-dependent mortality. The assumption is supported by the positive relation of mortality to the production rate index in the empirical data. The results indicate that zebra mussels optimally allocate resources under different mortality and production rates modified by overgrowth. We argue that the noticeable lifehistory polymorphism in this invasive species may be adaptive. Keywords: Bertalanffy’s growth curves, Beverton and Holt’s pattern, bioenergetic model, bivalves, body size, Dreissena polymorpha, fouling, growth, life-history evolution, mortality.
INTRODUCTION The spread of zebra mussels (Dreissena polymorpha, Pallas 1771) from Caspian and Black Sea regions throughout freshwaters in Europe and North America for the last two centuries has been followed by enormous diversification of their age and size at maturity, final size and especially the shape of their growth trajectories (Stan´czykowska, 1964, 1976, 1984;
* Author to whom all correspondence should be addressed. e-mail:
[email protected] Consult the copyright statement on the inside front cover for non-commercial copying policies. © 2003 Marcin Czarnołe˛ski
572
Czarnołe˛ ski et al.
Bij de Vaate, 1991; Nalepa and Schloesser, 1993; Stan´ czykowska and Lewandowski, 1995; Nichols, 1996; Karatayev et al., 1997; Lewandowski et al., 1997). Although the geographic polymorphism of life-history traits is well documented in zebra mussels, its ultimate causes remain unexplored. Differences in the growth patterns of indeterminate growers are usually viewed in terms of the growth rate’s direct dependence on physicochemical conditions of habitats, such as temperature, quality and amount of food, and oxygen availability (Stan´ czykowska, 1976, 1984; Bij de Vaate, 1991; Nalepa and Schloesser, 1993; Weinberg and Helser, 1996; Wilson, 1997; Dittman et al., 1998; Johnson and Brown, 1998; Morris and Corkum, 1999). Changes in body size with age, however, reflect the ways in which acquired resources are utilized for growth, reproduction and other functions. The schedule of allocation should be shaped by natural selection to maximize expected lifetime reproductive success. The optimization approach to life-history evolution predicts that organisms adjust their allocation schedule and the resulting shape of the growth trajectory to the interplay between the rates of biomass production and mortality (Roff, 1992; Stearns, 1992; Perrin and Sibly, 1993; Kozłowski, 1996; Heino and Kaitala, 1999). Here, we use data on European populations of zebra mussels to assess the diversity of Dreissena growth curves. We test whether the cross-population polymorphism can be explained by optimal resource allocation principles. After calculating indices for the mortality and production rates in the populations, we examine the relationship of those indices to growth curve parameters across zebra mussel populations and compare them with the life-history patterns predicted by a general model of optimal resource allocation in a seasonal environment, developed by Kozłowski and Theriokhin (1999). Because young zebra mussels foul adult conspecifics in nature, affecting specifically their mortality and production conditions, we add potential effects of overgrowth to the allocation model and again test its predictability. MATERIALS AND METHODS We used zebra mussel data from 19 different European locations (Table 1). They were collected in the summer seasons between 1960 and 1995 by A. Stan´ czykowska, K. Lewandowski and colleagues, and used for purposes other than this analysis (more information about the populations in: Wiktor, 1969; Stan´ czykowska, 1977; Nalepa and Schloesser, 1993). Those authors estimated the age of the clams from the annual growth increments according to the method of Wiktor (1969) and Lewandowski (1982); shell length, width and height were measured with a Vernier caliper to the nearest 0.1 mm. For each mussel we calculated the cube root of the product of the length, width and height of the shell; throughout this paper we use this as a measure of mussel size expressed in linear units (hereafter the index of body size). Growth curve parameters k, Lmax To mathematically describe the average shape of individual growth curves in the populations, we used Bertalanffy’s two-parameter formula (Bertalanffy, 1957): Lt = Lmax (1 − exp(− kt)), where Lt is body length at age t and k is the rate at which the asymptotic length Lmax is approached. This formula is equivalent to its three-parameter version with the third parameter (the hypothetical time at which the body size of an organism becomes zero)
Optimal resource allocation and Dreissena growth curves
573
set to zero. Such simplification seems justified for zebra mussels, since their larvae are of negligible size compared to adults. Although the original concept behind Bertalanffy’s formula appears unjustified, it can serve as a phenomenological description of an indeterminate growth pattern in most cases (Day and Taylor, 1997; Czarnołe˛ ski and Kozłowski, 1998; Kozłowski and Teriokhin, 1999). Bertalanffy’s curves were fitted to the data on age and body size index using the least squares method with the Simplex procedure (Nonlinear Regression module of Statistica’97). Mortality rate index, M As a measure of the average mortality rate in a population (M), we used 1/Tmax, where Tmax is the age of the oldest individual in a sample. Beverton (1963) showed that Tmax is a well-behaved statistic, highly correlated with the adult mortality rate in fishes (herring, anchovies and sardines). To reduce the confounding effect of different sample sizes in the data, 50 specimens were randomly chosen from each data set, and from these the oldest age-class was recorded. The procedure was repeated 100 times with replacement and Tmax was averaged across the repetitions. Biomass production rate index, L1 We did not have access to complete data on the trophic conditions that determined Dreissena biomass production rates in the periods in which our populations persisted. Instead, we use the average value of the body size index of survivors of the first winter L1 to measure the juvenile production rate. Because juveniles do not allocate resources to reproduction, their size should depend mainly on the environmental conditions directly affecting the growth rate. Despite the lack of direct evidence on the maturation age of the animals studied, it is reasonable to assume that almost always it occurred in the period after their first survived winter. European Dreissena usually mature at a shell length between 9 and 14 mm. This range can be attained at different ages, depending on growth rates affected by water temperature, season length or food availability (Morton, 1969; Stan´ czykowska, 1977; Walz, 1978b; Nalepa and Schloesser, 1993; Sprung, 1995a; Nichols, 1996; Jantz and Neumann, 1998). In America and Western Europe, zebra mussels tend to mature earlier, even in the first year of life (Walz, 1978b; Jantz and Neumann 1998); in Northern and Eastern Europe, this event may be delayed to even 2 years and more (Wlastov and Katchanova, 1959). Most of the populations considered in our work come from the eastern part of Europe, so we felt justified to assume that the size of young-of-the-year clams was only slightly or not at all affected by the reproductive effort. The median shell length of survivors of the first winter in the studied populations was 8.9 mm, a size just at the bottom of the reported maturation range. Kozłowski and Teriokhin’s model We use Kozłowski and Teriokhin’s (1999) optimization model to simulate life-history traits of organisms that are optimal under different production and mortality conditions. Briefly, this very general model concerns animals living more than one year in a seasonal environment, with summers when growth and/or reproduction are possible and winters when both functions are suspended. The biomass production rate expressed in energy units is
574
Czarnołe˛ ski et al.
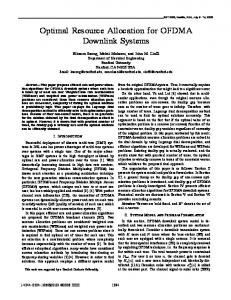
defined by a size-dependent function P(w). Survivorship is determined by season-dependent mortality rates (summer and winter components, qS and qW) with the age-dependent mortality component qA. The value of qA at age t is assumed to be equal to the ratio q0T/(T − t), where T is physiologically determined longevity and q0 is the rate at which mortality increases from the beginning (t = 0) to the end (t = T) of life. At each moment during the summer, imaginary organisms allocate excess energy P to growth or reproduction in a way that maximizes their lifetime reproductive output. The allocation decision is made on the basis of the production rate and yearly survivorship of the organisms, and it is found using the Pontryagin Maximum Principle (Pontryagin et al., 1962; see Kozłowski and Teriokhin, 1999, for the model details). Generally, the model predicts that animals should grow as long as each joule of energy invested currently in this process increases by more than one joule the expected amount of energy that will be deposited in future offspring; otherwise, the energy should be used exclusively for reproduction. Figure 1A represents the outcome of the model. The jagged line, called a ‘switching curve’, divides the age–body size plane in the graph into two sections. In the part below the line allocation to growth is optimal, whereas in the part above the line it is optimal to allocate energy to reproduction. In an aseasonal environment, the switching curve would be smooth. Seasonality splits the lifetime into productive and unproductive periods, making the switching curve jagged. At the end of the productive periods, the switching curve goes down because the expected allocation to reproduction drops with approaching winter. For those animals surviving the unproductive period, the switching curve again achieves a local maximum because the next winter is far away. The exact shape of the switching curve is determined by the body size- and season-dependence of the rates of production and mortality; this, in turn, sets the shape of the growth trajectory. As an animal grows only when its size is below the switching curve, the actual
Fig. 1. Growth trajectory resulting from optimal resource allocation to growth and reproduction in a seasonal environment, after Kozłowski and Teriokhin’s (1999) model. (A) The jagged line represents the switching curve whose exact shape is determined by the size- and season-dependent mortality and production rates. For convenience, winters are cut off the x-axis. The optimal allocation depends on the current relation of body size to the switching curve. If the size is below the switching curve, it is optimal for an organism to allocate all resources to growth. If the size exceeds the position of the curve, channelling resources to reproduction is optimal. The thin line represents the growth trajectory resulting from the sequence of optimal allocations. Because the target of the allocations changes regularly with seasons, the growth curve has a step-like shape. In practice, an investigator takes only one measure of body size per season (black dots); thus the growth trajectory resembles Bertalanffy’s growth curve as shown in (B).
Optimal resource allocation and Dreissena growth curves
575
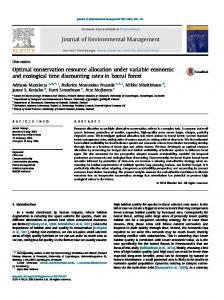
shape of its growth is step-like (thin line in Fig. 1A). If an investigator has only one measure of body size from each season, indeterminate growth resembles Bertalanffy’s curve, as shown in Fig. 1B. Bioenergetic effects of overgrowth Before including fouling in the computer simulations, we first develop a bioenergetic model of alteration of the production and mortality rates by overgrowth. As clams become more fouled with age, they suffer from increasing restriction of their closing and opening movements, and a gradual decrease in food and oxygen supply (Schloesser et al., 1996; Molloy et al., 1997); this makes living conditions a negative function of age directly and of body size indirectly (Fig. 2). To describe fouling effects mathematically, let us consider the following numerical example. The production rate P at a given body size w is the difference between the assimilation and respiration rates: P(w) = awb − cwd
(1)
The values of the coefficients for assimilation and respiration, a and c respectively, totally determine the rates for an organism at a hypothetical size equal to one. In suspension feeders, their values may depend on seston availability in a habitat. The weight exponents b and d indicate the rate at which the assimilation and respiration rates, respectively, increase with body size. For simplicity, we assume that, on average, overgrowth is equivalent to a gradual drop in food concentration with clam body size. In Fig. 3A, three sample functions
Fig. 2. Multilayered clump of self-overgrowing zebra mussels. Clams are constantly overgrown by younger conspecifics, leading to gradual deterioration of living conditions with age and on average with the size of the mussels. A = age, body size; B = food and oxygen concentrations.
576
Czarnołe˛ ski et al.
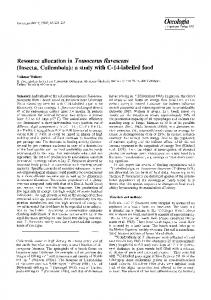
Fig. 3. Qualitative model of the reactions of the actual values of the weight exponents for assimilation, respiration and total production to different overgrowth intensities in Dreissena. Overgrowth is assumed to decrease food concentration F gradually with clam body size w, on average (see Fig. 2). Sample functions F(w) outlined in (A) reflect three different overgrowth intensities: 0, 1 and 2. For each overgrowth condition, the assimilation and respiration rates A and R were estimated at different sizes w with the formulas A(w, F) = 2.302F(w)w0.787 and R(w, F) = 0.5F(w)w0.8, respectively (B and C). The production rate P at each size was calculated as the difference between A and R (D). The model predicts that despite the assumed constancy of the physiologically determined assimilation and respiration exponents (0.787 and 0.8), their actual values and the production exponent (the slopes of the respective functions) fall with the increase in overgrowth.
of food concentration F with respect to body size w define the expected food conditions of clams not overgrown (indexed by 0) and overgrown at two different intensities (indexed by 1 and 2). After incorporating F(w) into equation (1) in the form of a variable weighting the coefficients a and c, it becomes P(w, F) = aF(w)wb − cF(w)wd
(2)
The assimilation component of this equation is equivalent to a simplified version of Walz’s formula (Walz, 1978a), originally developed to predict zebra mussel ingestion rates in different food and temperature conditions, with a control for body size. Because the increase in the assimilation rate is associated with the higher costs of getting, ingesting and digesting food, and higher costs of production (Sibly and Calow, 1986), in equation (2) the food conditions affect assimilation and respiration in the same direction. Note that this model holds within the limits imposed by some upper and lower food concentrations, beyond which filtration may cease due to valve closure (Jørgensen, 1990; Sprung, 1995b; Riisgård, 2001). Substituting a and b with Walz’s (1978a) estimates for these parameters, and c and d with arbitrary values, gives P(w, F) = 2.302F(w)w0.787 − 0.5F(w)w0.8.
Optimal resource allocation and Dreissena growth curves
577
The resulting functions for assimilation, respiration and production for the three overgrowth conditions (cases 0, 1, 2) are presented on a log–log scale in Fig. 3. Without overgrowth – that is, if F is independent of w – the functions for assimilation and respiration are linear on a log–log scale with a slope equal to the assumed exponents b and d (0.787 and 0.8). After adding overgrowth, the functions become non-linear but their semi-linear beginning is well approximated by a line whose slope may be treated as the actual weight exponent. The results in Fig. 3 indicate that overgrowth lowers the value of the assimilation and respiration exponents, leading to a slower increase in the production rate with body size. Because the maintenance needs of an organism usually increase faster with body size than the rate of assimilation does, there is a hypothetical size at which an organism would die due to unbalanced maintenance. It seems maladaptive to reach that point and even continue growth after reaching the size at which the production rate is at maximum (see Czarnołe˛ ski and Kozłowski, 1998). Nevertheless, in a stochastic environment fluctuating conditions must temporarily drive the assimilation function downward (drops in the assimilation coefficient a caused by lower food or oxygen availability), unbalancing the maintenance requirements at some body size. In zebra mussels, such drops can result from temporary blooms of algae, for example Ceratium hirundinella clotting the filtering apparatus (Stan´ czykowska, 1977), or Stephanodiscus with low nutritional value (Walz, 1978c). Consequently, as mussels grow they have an increasingly higher chance of unbalancing their maintenance and dying during drops in assimilation. Given that in principle overgrowth lowers the weight exponent for assimilation (Fig. 3B), the risk of unbalancing maintenance in fouled mussels will rise quicker with body size; this should not only shorten the life perspective, but also increase the rate at which mortality rises with age. Intensity of overgrowth is said to depend on substrate and food availability (see Strayer et al., 1996). Better food conditions intensify overgrowth by increasing the rates of clam growth and larvae recruitment, as suggested by Molloy et al. (1997) for Dreissena polymorpha and Corbicula fluminea. Habitats with higher productivity are also poorer in hard and mud-free substrata, which intensifies overgrowth by increasing competition for settlement, even though the increased mortality associated with hypoxia reduces mussel abundance. If so, sessile organisms from more productive sites should foul themselves more intensely and, consequently, according to the expectations of our bioenergetic model, they should have lower values of the weight exponents for assimilation and respiration rates, and higher age-specific mortality. Computer simulations Using a program written in Microsoft Visual Basic 5 language, we generated populations with different mortality and production rates by assigning random production and mortality parameters to each population. In the simulations, the biomass production function P(w) was defined by the parameters a, b, c, d according to equation (1), and survivorship was determined by Kozłowski and Teriokhin’s (1999) formula described in the subsection presenting their model. We produced 100 populations without overgrowth and a set of 100 populations with different overgrowth intensities. To generate populations without overgrowth, values for the production and mortality parameters were sampled from normal distributions with assumed means and coefficients
578
Czarnołe˛ ski et al.
of variation as follows: 5 (20%) for a, 0.67 (0.5%) for b, 0.1 (20%) for c, 0.7 (0.5%) for d, 0.2 (30%) for qW and qS; the age-specific component of mortality qA was set at zero. Only cases with d > b were taken into account (see Sibly and Calow, 1986). Because we intended to make only qualitative predictions about the directions in which growth curves respond to the mortality and production rates, we chose arbitrary values for the parameters. The values for the weight exponents for assimilation and respiration were kept within the ranges reported in the literature for Dreissena (0.49–1.0 for b and 0.63–0.82 for d; Kryger and Riisgård, 1988; Sprung, 1995b; McMahon, 1996). To generate populations with overgrowth, summer mortality qS was set at zero, assuming for simplicity that summer survivorship is totally determined by age-specific mortality qA driven by overgrowing. In the formula for qA, physiological longevity T was set arbitrarily at 12 years. We used qualitative predictions of our bioenergetic model to change the procedure of sampling parameters. Now, only the values of the assimilation coefficient a and winter mortality qW were sampled directly from normal distributions with means 5 and 0.2 and coefficients of variation 20% and 30%, respectively. The values of the other parameters (b, c, d and q0 in the formula for qA) were also derived from normal distributions, but their means were first functionally related to the sampled value of the assimilation coefficient a. Because overgrowth intensity is expected to be higher in populations with better food supply, the values of the food-related coefficients a and c in the formula for biomass production (equation 1) were negatively related to the mean assimilation and respiration exponents b and d and positively related to the mean coefficient q0 of age-specific mortality (qualitative consequences of overgrowth inferred from our bioenergetic model). In particular, the mean coefficient for respiration was positively linked to a by the simple equation c = 0.1a; the mean values of the weight exponents were related to a by the formulas b = 0.8 – 0.03a and d = 0.7 − 0.005a; and the mean q0 in the formula for qA was positively linked to a by q0 = −0.08 + 0.0036a2. The actual values of the parameters were then derived from the distributions with the so-covaried means and the coefficients of variation for b and d equal to 0.1%, for c equal to 1% and for q0 equal to 20%. Such a sampling procedure generated populations with different levels of overgrowth proportional to the random value of a. The equations were constructed in such a way that, for each sampled value of a, the values of related parameters varied approximately within the parameter ranges obtained in the simulation without overgrowth. The values of b and d agree with the reported speciesspecific ranges. The generated values of q0 allow the model to be kept stable for the sampled values of a. We stress that the functional relationships were chosen arbitrarily but that the qualitative results of the simulations are independent of the parameter values in their broad range. With the help of Kozłowski and Teriokhin’s (1999) optimization procedure implemented in the program, we found the optimal age-specific allocation schedule for organisms from each population (for the set of sampled parameters). We recorded the optimal age and size at first reproduction and calculated the parameters of Bertalanffy’s growth curves and the indices of the mortality and production rates M = 1/Tmax and L1. In our simulations, Tmax was defined as the age at which the probability of surviving from the beginning of life dropped below the arbitrary level 0.001. Before fitting the growth curves, the sizes of computer-born organisms expressed in energy units were transformed to linear units by cube roots. Using regression analysis (Statistica’97), we examined the relations of the growth curve parameters k and Lmax to the indices of production L1 and mortality rate M across Dreissena
Optimal resource allocation and Dreissena growth curves
579
Fig. 4. Bertalanffy’s growth curves fitted to data on age and body size index from 19 zebra mussel populations (specified in Table 1). The index is the cube root of the product of shell length, width and height.
populations and compared their directions with the regressions obtained from the computer simulations with and without overgrowth. RESULTS Figure 4 outlines the variation in the shape of Bertalanffy’s growth curves across 19 zebra mussel populations; Table 1 provides estimates of their parameters k and Lmax. As indicated in Table 2 (column A), zebra mussel asymptotic size Lmax decreases and Bertalanffy’s growth rate parameter k increases with an increase in the mortality rate M in the populations. Both growth curve parameters react in the same direction to an increase of the production rate index L1 (size of young-of-the-year mussels). Analysis of partial regression coefficients shows that despite the positive correlation between the measures of mortality and production rates, both indices independently affect the parameters of the growth curves. Bertalanffy’s parameters of optimal growth curves obtained from Kozłowski and Teriokhin’s model without overgrowth taken into account react to the mortality rate in the same direction as in zebra mussels (Table 2, column B). The optimal growth curves change shape with the production rate in a different direction than observed in Dreissena polymorpha – that is, the asymptotic size increases and Bertalanffy’s growth rate parameter decreases with an increase of the production rate index. Note that, contrary to the pattern detected in zebra mussels, the indices of the mortality and production rates (M, L1) are independent of each other. In addition, the model predicts that higher mortality selects for earlier maturation at smaller size, whereas the conditions that enhance the biomass production rate postpone maturation to larger sizes. The optimal growth curves derived from Kozłowski and Teriokhin’s model with added overgrowth react to mortality and production rates in the same directions as in zebra mussels (Table 2, columns A and C); the asymptotic size decreases and Bertalanffy’s growth rate parameter increases with the rise in mortality and production rates. In this version of the model, the indices of mortality and production rates M and L1 are positively correlated, as was also found in Dreissena populations. Recall that this pattern between the indices
580
Czarnołe˛ ski et al.
Table 1. List of European populations of Dreissena polymorpha from which data were used in this paper to estimate Bertalanffy’s growth curve parameters (last two columns); k is the rate at which asymptotic size Lmax is approached Lake
Location
Balaton Boczne Geneva Inulec Jagodne Lichen´ skie Majcz Mamry Mikołajskie Niegocin Pa˛ tnowskie S´ lesin´ skie S´ niardwy Stre˛ giel Firth of Szczecin Tałtowisko Tałty ˙ abinka Z Zürich
Hungary Northeastern Poland, Masurian Lakes Switzerland Northeastern Poland, Masurian Lakes Northeastern Poland, Masurian Lakes Central Poland, heated lake Northeastern Poland, Masurian Lakes Northeastern Poland, Masurian Lakes Northeastern Poland, Masurian Lakes Northeastern Poland, Masurian Lakes Central Poland, heated lake Central Poland, heated lake Northeastern Poland, Masurian Lakes Northeastern Poland, Masurian Lakes Northwestern Poland, mouth of Odra River Northeastern Poland, Masurian Lakes Northeastern Poland, Masurian Lakes Northeastern Poland, Masurian Lakes Switzerland
Study period
k
Lmax
1974 1960 1975 1994 1962 1973 1990 1960 1967 1962 1973 1973 1995 1960 1969 1970 1972 1972 1975
0.677 0.11 0.137 0.742 0.765 0.966 0.176 0.177 0.541 0.632 0.875 1.198 0.989 0.295 0.151 0.496 0.175 0.304 0.138
13.37 31.01 31.24 16.46 11.27 12.66 29.43 19.93 14.04 12.7 10.98 10.5 15.45 19.4 31.16 17.43 23.33 21.71 33.81
stems from the nature of overgrowth assumed in this version of the model. As indicated in Table 2, column C, in the presence of overgrowth an increase in the rate of mortality selects for earlier maturation at smaller size, the reaction also predicted by the model without overgrowth (column B). Contrary to the model neglecting fouling, enhancement of biomass production conditions drives optimal organisms into earlier maturation at smaller size (columns B and C). This is because a higher rate of production intensifies overgrowth. DISCUSSION The shapes of Bertalanffy’s growth curves differ remarkably across the 19 European populations of Dreissena polymorpha under study (Table 1, Fig. 4). According to the theory of life-history evolution, such polymorphism should have an ultimate explanation. The shape of a growth trajectory reflects the schedule of resource allocation to growth, reproduction and other functions, which the organisms adjust to the mortality and production rates in a way that maximizes expected lifetime reproductive output (Fig. 1) (Roff, 1992; Stearns, 1992; Charnov, 1993; Perrin and Sibly, 1993; Czarnołe¸ ski and Kozłowski, 1998; Heino and Kaitala, 1999; Kozłowski and Teriokhin, 1999). While the production parameters set the upper limits for the rate of resource conversion into offspring tissues, the mortality level decides the time perspective of this process. Generally, a determinate growth pattern is expected in an aseasonal environment as a result of the optimal strategy of switching abruptly and irreversibly to reproduction after some years of growth (Kozłowski and Wiegert, 1987; Perrin and Sibly, 1993). If the mortality and production rates vary regularly
Optimal resource allocation and Dreissena growth curves
581
Table 2. Relationship of growth curve parameters to indices of mortality and production rates in zebra mussels and optimal model organisms
A Variables (log-transformed)
Dependent
Zebra mussels (n = 19)
Independent
Ordinary regression Lmax M L1
Standard regression coefficient −0.62 −0.57
B
C
Optimal organisms from simulations without overgrowth (n = 100)
Optimal organisms from simulations with overgrowth (n = 100)
P
Standard regression coefficient
P
Standard regression coefficient
P
< 0.005 < 0.02
−0.20 0.95
< 0.0001 < 0.0001
−0.94 −0.93
< 0.0001 < 0.0001
0.39 −0.81
< 0.0001 < 0.0001
0.95 0.96
< 0.0001 < 0.0001
0.81
0.92
< 0.0001
k
M L1
0.63 0.78
< 0.004 < 0.0001
M
L1
0.48
< 0.04
0.02
Partial regression Lmax M L1
−0.46 −0.35
< 0.05 0.1
−0.22 0.95
< 0.0001 < 0.0001
−0.58 −0.39
< 0.0001 < 0.0001
k
M L1
0.34 0.62
< 0.05 < 0.002
0.41 −0.82
< 0.0001 < 0.0001
0.42 0.57
< 0.0001 < 0.0001
Tmat
M L1
— —
— —
−0.56 0.38
< 0.0001 < 0.0001
−0.59 − 0.37
< 0.0001 < 0.0001
Lmat
M L1
— —
— —
−0.25 0.92
< 0.0001 < 0.0001
−0.73 −0.21
< 0.0001 < 0.0001
Note: k and Lmax are Bertalanffy’s growth curve parameters; M is the measure of the average yearly mortality rate; L1 is the average size of young-of-the-year, the measure of the habitat-specific production rate; Tmat and Lmat are age and size at maturity. Regressions were fitted to data from 19 populations of zebra mussels (specified in Table 1) and two sets of 100 populations of optimal organisms generated with the help of Kozłowski and Teriokhin’s (1999) optimal resource allocation model in simulations ignoring overgrowth (column B) or incorporating overgrowth (column C). The unshaded cells in columns B and C indicate optimal patterns with different directions than the relationships found in zebra mussels shown in column A. — , data unavailable.
with time (seasonality), gradual switching from growth to reproduction in consecutive years of life should evolve, phenotypically manifested in an indeterminate growth pattern (Kozłowski and Uchman´ ski, 1987; Kozłowski and Teriokhin, 1999). In a seasonal environment, the interplay between the two rates determines not only the timing of the first reproduction, as in aseasonal conditions, but also the channelling of resources to growth and reproduction throughout the remainder of life. With our data, we cannot test directly whether optimal allocation underlies the growth curve polymorphism outlined in Fig. 4. We overcame this problem, however, by applying Kozłowski and Teriokhin’s (1999) optimization procedure to simulate optimal reactions of growth curves to mortality and production and comparing them with the patterns observed
582
Czarnołe˛ ski et al.
in Dreissena polymorpha. We found that the rise in the mortality rate M in actual populations was followed by an increase in Bertalanffy’s growth curve parameter k and a decrease in the asymptotic length Lmax (Table 2, column A). Optimal organisms from the model responded to increased mortality by maturing earlier and at a smaller size, and later by increasing the proportion of resources allocated to reproduction. This resulted in a decrease in Lmax and an increase in k with the index M, as in the zebra mussels (Table 2, column B). Such life-history responses to mortality are in accordance with previously documented reactions of life histories to increased predation or parasitism in other species (e.g. Trinidadian guppies: Reznick et al., 1990; the Biomphalaria–Schistosoma system: Minchella and Loverde, 1981; Minchella, 1985). They also resemble the interspecific patterns detected for fish and reptiles (Beverton and Holt, 1959; Charnov, 1993), which have been explained by optimal resource allocation principles (Kozłowski, 1996). Kozłowski and Teriokhin’s (1999) model fails to account for the effects of the production rate on Dreissena growth curves. Against the expectation that the increase in the production rate should postpone the first reproduction to larger sizes, raising the asymptotic length Lmax and decreasing Bertalanffy’s parameter k (Table 2, column B), we found that the production rate index (mean size of young-of-the-year L1) correlated negatively with asymptotic length and positively with parameter k across zebra mussel populations (Table 2, column A). This finding does not conform to the widely accepted view that production conditions have a positive effect on the final size of indeterminate growers (see Ernsting, 1995), a phenomenon documented, for example, in marine scallops (MacDonald and Bourne, 1987). The inconsistency between the simulation results and the data implies that the optimization model does not accommodate all forces important in shaping Dreissena life histories. This in itself may say something important about the system studied; the predictiveness of the model should improve after dimensions that do exist in nature are incorporated (see Maynard Smith, 1978; Kozłowski, 1999). The positive relationship between the mortality and production rates visible in the data for Dreissena polymorpha (Table 2, column A) but absent in the model (Table 2, column B) may provide an important clue. We suggest that it results from continuous overgrowing of older zebra mussels by younger conspecifics, and the dependence of overgrowth intensity on trophic conditions in the environment. Selfovergrowing is a well-known phenomenon in many sessile organisms such as zebra mussels, blue mussels and barnacles (Hughes and Griffiths, 1988; Guiñez and Castilla, 1999). The aggregating zebra mussels form multilayered clumps of up to 10,000 individuals packed together (Schloesser et al., 1996), or beds 12 cm thick (Wiktor, 1969; Nalepa and Schloesser, 1993) with a four-layer structure (Chase and Bailey, 1999). Overgrowth intensity in zebra mussels rarely has been assessed directly, but it appears to vary greatly across populations (Stan´ czykowska, 1964; Nalepa and Schloesser, 1993; Chase and Bailey, 1999) with substrate and food availability (see Strayer et al., 1996). Constant fouling deteriorates living conditions progressively with age, gradually decreasing the assimilation and respiration rates of overgrown mussels and increasing their maintenance needs (Fig. 2). Consequently, as suggested by the results of our bioenergetic model (Fig. 3), the weight exponents for the production components in overgrowing organisms (b and d in equation 1) are expected to attain lower values, and between populations they should be more variable than would be expected from scaling laws based on the physiology of a single organism. The reaction of the exponents to overgrowth should also increase the rate at which mortality rises with age. Incorporating the production and
Optimal resource allocation and Dreissena growth curves
583
mortality effects of overgrowth into Kozłowski and Teriokhin’s model and accounting for their dependence on trophic conditions produces a positive relation between the mortality index M and the production rate index L1, which resembles the correlation between the indices across zebra mussel populations (Table 2, column A vs column C). In optimal organisms exposed to overgrowing, the increased mortality rate and the higher biomass production rate promote earlier maturation at smaller size, followed by a decrease in the asymptotic length Lmax and an increase in Bertalanffy’s parameter k (Table 2, column C). Dreissena growth curves react to the rates of mortality and production in the directions predicted by the model accounting for the effects of overgrowth (Table 2, column A vs column C). Since overgrowth positively links the rates of production and mortality and both of them select for qualitatively similar life-history responses, it should be difficult to discern the independent effect of each factor in nature. Nonetheless, analysis of the partial regressions shows that to some extent the two factors independently shape the growth trajectories in zebra mussels as well as in optimal organisms (Table 2, columns A and C). Of course, overgrowth is not the only determinant of zebra mussel mortality. The influence of other agents not necessarily connected with food conditions, such as parasites and predators, was implicitly taken into account in the optimization model in the form of a winter mortality component. With our data, we cannot test whether Dreissena age and size at maturity reacted optimally to the mortality and production rates, but there is circumstantial evidence from other populations. In accordance with the predictions (Table 2, column C), in North America, where overgrowth was reported to be intense and lifespan short (approximately 2 years), zebra mussels tend to mature earlier and at a smaller size than in Eastern Europe, where overgrowth is relatively less severe and lifespan extends to 5–7 years (Nalepa and Schloesser, 1993). These observations, however, need statistical confirmation and a formal assessment of overgrowth intensity. The predicted optimal reactions of the growth pattern to overgrowth-driven changes in the mortality and production rates agree with the commonly observed reduction of the growth rate of fouled organisms (Okamura, 1986). Occasionally, this phenomenon is looked at from the resource allocation perspective. Wahl (1997), for example, attributed the slower growth of Littorina littorea snails fouled by epibionts to changes in allocation of resources to pedal activity, growth and reproduction. In most cases, however, growth retardation is treated as a direct result of the deterioration of living conditions associated with overgrowth. Overall, our results support the view that resource allocation in zebra mussels responds optimally to the mortality and biomass production rates. They point to the importance of biofouling in shaping both rates and, consequently, in the evolution of resource allocation in zebra mussels and other organisms exposed to overgrowing. The optimal-like reactions of Dreissena growth curves suggest that their diversification during invasions of zebra mussels to novel habitats in Europe and America resulted from adaptive processes. Certainly, our data cannot arbitrate whether this variation originated from genetic microevolution or reflects adaptive phenotypic plasticity. Although little is known about the genetic background of life-history polymorphism in Dreissena polymorpha, the evidence from other molluscs suggests its possible genetic determination (Ribi and Gebhardt, 1986; Lam and Calow, 1989; Dupont-Nivet et al., 1997). Among populations of freshwater clams, for example, Jokela and Mutikainen (1995) reported genetic differences in the relative resource allocations to different functions. On the other hand, the production of pelagic, mobile larvae by zebra mussels appears to mix genotypes and make them encounter different types
584
Czarnołe˛ ski et al.
of habitats, predisposing them to develop adaptive phenotypic plasticity (Newman, 1992; Stearns, 1992; Kawecki and Stearns, 1993). Our data’s correspondence to optimal reactions of overgrown organisms does not rule out alternative scenarios. Any factor that lowers expected fitness by reducing survival or biomass production later in life might select for faster growth before maturity and an abrupt switch to reproduction afterwards (Abrams et al., 1996). If growth rate increases at the expense of the efficiency of somatic damage repair, the optimal reactions resemble the patterns observed in zebra mussels (see Cichon´ , 1997). Alternatively, the influence of crosshabitat differences in temperature on growth curves cannot be ignored. Although from the perspective of optimization theory the phenomenon still awaits explanation, decreased temperature is reported to reduce the growth rate and delay maturity, increasing the asymptotic length (Atkinson, 1995; Ernsting, 1995). Further work should verify which of the scenarios account for life-history polymorphism in zebra mussels. The shaping of mortality and production by overgrowing was only posited in the explanation proposed here; future research on self-overgrowers should test explicitly the expected response of their life histories to overgrowth-driven changes in the mortality and production rates.
ACKNOWLEDGEMENTS This work was supported by the Polish State Committee for Scientific Research, grant no. 6P04C05015. M. Cichon´ and M. Konarzewski made helpful comments on drafts of the manuscript; M. Jacobs helped edit it.
REFERENCES Abrams, P.A., Leimar, O., Nylin, S. and Wilklund, C. 1996. The effect of flexible growth rates on optimal sizes and development times in a seasonal environment. Am. Nat., 147: 381–395. Atkinson, D. 1995. Effects of temperature on the size of aquatic ectotherms: exceptions to the general rule. J. Therm. Biol., 20: 61–74. Bertalanffy, L. 1957. Quantitative laws in metabolism and growth. Quart. Rev. Biol., 32: 217–231. Beverton, R.J.H. 1963. Maturation, growth and mortality of clupeid and engraulid stocks in relation to fishing. Rapp. P.-V. Reun. Cons. Int. Explor. Mer., 154: 44–67. Beverton, R.J.H. and Holt, S.J. 1959. A review of the lifespans and mortality rates of fish in nature and the relation to growth and other physiological characteristics. In Ciba Foundation Colloquia in Ageing. V. The Lifespan of Animals, pp. 142–147. London: Churchill. Bij de Vaate, A. 1991. Distribution and aspects of population dynamics of the zebra mussel, Dreissena polymorpha (Pallas, 1771), in the lake Ijsselmeer area (The Netherlands). Oecologia, 86: 40–50. Charnov, E.L. 1993. Life History Invariants: Some Explorations of Symmetry in Evolutionary Ecology. Oxford: Oxford University Press. Chase, M.E. and Bailey, R.C. 1999. The ecology of the zebra mussel (Dreissena polymorpha) in the Lower Great Lakes of North America: I. Population dynamics and growth. J. Great Lakes Res., 25: 107–121. Cichón, M. 1997. Evolution of longevity through optimal resource allocation. Proc. R. Soc. Lond. B, 264: 1383–1388. Czarnołe˛ ski, M. and Kozłowski, J. 1998. Do Bertalanffy’s growth curves result from optimal resource allocation? Ecol. Lett., 1: 5–7.
Optimal resource allocation and Dreissena growth curves
585
Day, T. and Taylor, P.D. 1997. Von Bertalanffy’s growth equation should not be used to model age and size at maturity. Am. Nat., 149: 381–393. Dittman, D.E., Ford, S.E. and Haskin, H.H. 1998. Growth pattern in oysters, Crassostrea virginica, from different estuaries. Mar. Biol., 132: 461–469. Dupont-Nivet, M., Mallard, J., Bonnet, J.C. and Blanc, J.M. 1997. Quantitative genetics of growth trait in the edible snail, Helix aspersa Müller. Genet. Sel. Evol., 29: 571–587. Ernsting, G. 1995. Ectotherms, time and temperature: reaction norms for age and size at maturity. Oikos, 72: 444–445. Guiñez, R. and Castilla, J.C. 1999. A tridimensional self-thinning model for multilayered intertidal mussels. Am. Nat., 154: 341–357. Heino, M. and Kaitala, V. 1999. Evolution of resource allocation between growth and reproduction in animals with indeterminate growth. J. Evol. Biol., 12: 423–429. Hughes, R.N. and Griffiths, C.L. 1988. Self-thinning in barnacles and mussels: the geometry of packing. Am. Nat., 132: 484–491. Jantz, B. and Neumann, D. 1998. Growth and reproductive cycle of the zebra mussel in the River Rhine as studied in a river bypass. Oecologia, 114: 213–225. Johnson, P.D. and Brown, K.M. 1998. Intraspecific life history variation in the threatened Louisiana pearlshell mussel, Margaritifera hembeli. Freshwater Biol., 40: 317–329. Jokela, J. and Mutikainen, P. 1995. Phenotypic plasticity and priority rules for energy allocation in a freshwater clam: a field experiment. Oecologia, 104: 122–132. Jørgensen, C.B. 1990. Bivalve Filter Feeding: Hydrodynamics, Bioenergetics, Physiology and Ecology. Fredensborg: Olsen & Olsen. Karatayev, A.Y., Burlakova, L.E. and Padilla, D.K. 1997. The effects of Dreissena polymorpha (Pallas) invasion on aquatic communities in Eastern Europe. J. Shellfish Res., 16: 187–203. Kawecki, T.J. and Stearns, S.C. 1993. The evolution of life histories in spatially heterogeneous environments: optimal reaction norm revised. Evol. Ecol., 7: 155–174. Kozłowski, J. 1996. Optimal allocation of resources explains interspecific life-history patterns in animals with indeterminate growth. Proc. R. Soc. Lond. B, 263: 559–566. Kozłowski, J. 1999. Adaptation: a life history perspective. Oikos, 86: 185–194. Kozłowski, J. and Uchman´ ski, J. 1987. Optimal individual growth and reproduction in perennial species with indeterminate growth. Evol. Ecol., 1: 214–230. Kozłowski, J. and Wiegert, R.G. 1987. Optimal age and size at maturity in annuals and perennials with determinate growth. Evol. Ecol., 1: 231–244. Kozłowski, J. and Teriokhin, A.T. 1999. Allocation of energy between growth and reproduction: the Pontryagin Maximum Principle solution for the case of age- and season-dependent mortality. Evol. Ecol. Res., 1: 423–441. Kryger, J. and Riisgård, H.U. 1988. Filtration rate capacities in 6 species of European freshwater bivalves. Oecologia, 77: 34–38. Lam, P.K.S. and Calow, P. 1989. Intraspecific life-history variation in Lymnaea peregra (Gastropoda: Pulmonata). II. Environmental or genetic variance? J. Anim. Ecol., 58: 589–602. Lewandowski, K. 1982. The role of early developmental stages in the dynamics of Dreissena polymorpha (Pall.) (Bivalvia) populations in lakes. II. Settling of larvae and the dynamics of numbers of settled individuals. Ekol. Pol., 30: 223–286. Lewandowski, K., Stoczkowski, R. and Stan´ czykowska, A. 1997. Distribution of Dreissena polymorpha (Pall.) in lakes of the Jorka river watershed. Pol. Arch. Hydrobiol., 44: 431–443. MacDonald, B.A. and Bourne, N.F. 1987. Growth, reproductive output, and energy partitioning in weathervane scallops, Patinopecten caurinus, from British Columbia. Can. J. Fish. Aquat. Sci., 44: 152–160. Maynard Smith, J. 1978. Optimization theory in evolution. Annu. Rev. Ecol. Syst., 9: 31–56. McMahon, R.F. 1996. The physiological ecology of the zebra mussel, Dreissena polymorpha, in North America and Europe. Am. Zool., 36: 339–363.
586
Czarnołe˛ ski et al.
Minchella, D.J. 1985. Host life-history variation in response to parasitism. Parasitology, 90: 205–216. Minchella, D.J. and Loverde, P.T. 1981. A cost of increased early reproductive effort in the snail Biomphalaria glabrata. Am. Nat., 118: 876–881. Molloy, D.P., Karatayev, Y., Burlakova, L.E., Kurandina, D.P. and Laruelle, F. 1997. Natural enemies of zebra mussels: predators, parasites, and ecological competitors. Rev. Fish. Sci., 5: 27–97. Morris, T.J. and Corkum, L.D. 1999. Unionid growth patterns in rivers of differing riparian vegetation. Freshwater Biol., 42: 59–68. Morton, B.S. 1969. Studies on the biology of Dreissena polymorpha Pall. III. Population dynamics. Proc. Malacol. Soc. Lond., 38: 471–482. Nalepa, T.F. and Schloesser, D.W. 1993. Zebra Mussels: Biology, Impacts, and Control. Boca Raton, FL: Lewis Publishers/CRC Press. Newman, R.A. 1992. Adaptive plasticity in amphibian metamorphosis. BioScience, 42: 671–678. Nichols, S.J. 1996. Variations in the reproductive cycle of Dreissena polymorpha in Europe, Russia, and North America. Am. Zool., 36: 311–325. Okamura, B. 1986. Group living and the effects of spatial position in aggregations of Mytilus edulis. Oecologia, 69: 341–347. Perrin, N. and Sibly, R.M. 1993. Dynamic models of energy allocation and investment. Annu. Rev. Ecol. Syst., 24: 379–410. Pontryagin, L.S., Boltyanskii, V.G., Gamkrelidze, R.V. and Mishchenko, E.F. 1962. Mathematical Theory of Optimal Processes. New York: Wiley. Reznick, D.N., Bryga, H. and Endler, J.A. 1990. Experimentally induced life-history evolution in a natural population. Nature, 346: 357–359. Ribi, G. and Gebhardt, M. 1986. Age-specific fecundity and size of offspring in the prosobranch snail Viviparus ater. Oecologia, 71: 18–24. Riisgård, H.U. 2001. Physiological regulation versus autonomous filtration in filter-feeding bivalves: starting points for progress. Ophelia, 54: 193–209. Roff, D.A. 1992. The Evolution of Life Histories: Theory and Analysis. New York: Chapman & Hall. Schloesser, D.W., Nalepa, T.F. and Mackie, G.L. 1996. Zebra mussel infestation of unionid bivalves (Unionidae) in North America. Am. Zool., 36: 300–310. Sibly, R.M. and Calow, P. 1986. Physiological Ecology of Animals: An Evolutionary Approach. Oxford: Blackwell Scientific. Sprung, M. 1995a. Physiological energetics of the zebra mussel Dreissena polymorpha in lakes I. Growth and reproductive effort. Hydrobiologia, 304: 117–132. Sprung, M. 1995b. Physiological energetics of the zebra mussel Dreissena polymorpha in lakes II. Food uptake and gross growth efficiency. Hydrobiologia, 304: 133–146. Stan´ czykowska, A. 1964. On the relationship between abundance aggregations and ‘condition’ of Dreissena polymorpha Pall. in 36 Mazurian lakes. Ekol. Pol. Ser. A, 12: 653–690. Stan´ czykowska, A. 1976. Occurrence and growth of Dreissena polymorpha Pall. in lakes included in a cooling system. Rocz. Nauk Rol., 97-H-3: 109–122. Stan´ czykowska, A. 1977. Ecology of Dreissena polymorpha (Pall.) (Bivalvia) in lakes. Pol. Arch. Hydrobiol., 24: 461–530. Stan´ czykowska, A. 1984. The effect of various phosphorus loadings on the occurrence of Dreissena polymorpha (Pall.). Limnologica, 15: 535–539. Stan´ czykowska, A. and Lewandowski, K. 1995. Individual growth of the fresh water mussel Dreissena polymorpha (Pall.) in Mikołajskie Lake; estimates in situ. Ecol. Pol., 43: 267–276. Stearns, S.C. 1992. The Evolution of Life Histories. Oxford: Oxford University Press. Strayer, D.L., Powell, J., Ambrose, P., Smith, L.C., Pace, M.L. and Fischer, D.T. 1996. Arrival, spread, and early dynamics of a zebra mussel (Dreissena polymorpha) population in the Hudson estuary. Can. J. Fish. Aqut. Sci., 53: 1143–1149.
Optimal resource allocation and Dreissena growth curves
587
Wahl, M. 1997. Increased drag reduces growth of snails: comparison of flume and in situ experiments. Mar. Ecol. Progr. Ser., 151: 291–293. Walz, N.W. 1978a. The energy balance of the freshwater mussel Dreissena polymorpha Pallas in laboratory experiments and in Lake Constance. I. Pattern of activity, feeding and assimilation efficiency. Arch. Hydrobiol., 55(suppl.): 83–105. Walz, N.W. 1978b. The energy balance of the freshwater mussel Dreissena polymorpha Pallas in laboratory experiments and in Lake Constance. II. Reproduction. Arch. Hydrobiol., 55(suppl.): 106–119. Walz, N.W. 1978c. The energy balance of the freshwater mussel Dreissena polymorpha Pallas in laboratory experiments and in Lake Constance. IV. Growth in Lake Constance. Arch. Hydrobiol., 55(suppl.): 142–156. Weinberg, J.R. and Helser, T.E. 1996. Growth of the Atlantic surfclam, Spisula solidissima, from Georges Bank to the Delmarva Peninsula, USA. Mar. Biol., 126: 663–674. Wiktor, J. 1969. Biologia Dreissen polymorpha (Pall.) i jej ekologiczne znaczenie w Zalewie Szczecinskim. Studia i Materiały (seria A nr 5). Gdynia: Morski Instytut Rybacki. Wilson, J.G. 1997. Long-term changes in density, population structure and growth rate of Tellina tenuis population from Dublin Bay, Ireland. Oceanol. Acta, 20: 267–274. Wlastov, B.V. and Katchanova, A.A. 1959. Establishment of sex in living Dreissensia and some data on the reproduction cycle of this mollusk. Zool. Zhurn., 38: 991–1006.