Optimal self-referenced sensing using long- and short- range surface plasmons J. T. Hastings,1 J. Guo,1 P. D. Keathley,1 P. B. Kumaresh,1 Y. Wei,2 S. Law,2 and L. G. Bachas2 1
Department of Electrical and Computer Engineering and 2Department of Chemistry, University of Kentucky, Lexington, KY 40506
[email protected]
Abstract: Dual-mode surface-plasmon resonance (SPR) sensors use both long- and short- range surface plasmon waves to differentiate surface binding interactions from interfering bulk effects. We have optimized the design of these sensors for minimum surface limit of detection (LOD) using a Cramer-Rao lower bound for spectral shift estimation. Despite trade-offs between resonance width, minimum reflectivity, and sensitivity for the two modes, a range of reasonable design parameters provides nearly optimal performance. Experimental verification using biotin-streptavidin binding as a model system reveals that sensitivity and LOD for dual-mode sensors remains competitive with single-mode sensors while compensating for bulk effects. ©2007 Optical Society of America OCIS codes: (240.6680) Optics at surfaces.Surface plasmons; (280.4788) Remote sensing and sensors.optical sensing and sensors.
References and links 1. 2. 3. 4. 5. 6. 7. 8. 9. 10. 11. 12. 13. 14. 15. 16.
R. Slavik, J. Homola, and H. Vaisocherova, "Advanced biosensing using simultaneous excitation of short and long range surface plasmons," Meas. Sci. Technol. 17, 932-938 (2006). R. Donipudi, S. Pochiraju, and J. T. Hastings, "Self-referenced SPR sensing via simultaneous excitation of long- and short-range surface plasmons," Proceedings of the 2006 Conference on Lasers and Electrooptics (2006). G. G. Nenninger, J. B. Clendenning, C. E. Furlong, and S. S. Yee, "Reference-compensated biosensing using a dual-channel surface plasmon resonance sensor system based on a planar lightpipe configuration," Sens. Actuators B 51, 38-45 (1998). J. Homola, "Present and future of surface plasmon resonance biosensors," Anal. Bioanal. Chem. 377, 528539 (2003). J. Homola, H. B. Lu, and S. S. Yee, "Dual-channel surface plasmon resonance sensor with spectral discrimination of sensing channels using dielectric overlayer," Electron. Lett. 35, 1105-1106 (1999). J. Homola, H. B. Lu, G. G. Nenninger, J. Dostalek, and S. S. Yee, "A novel multichannel surface plasmon resonance biosensor," Sens. Actuators B 76, 403-410 (2001). C. Boozer, Q. M. Yu, S. F. Chen, C. Y. Lee, J. Homola, S. S. Yee, and S. Y. Jiang, "Surface functionalization for self-referencing surface plasmon resonance (SPR) biosensors by multi-step selfassembly," Sens. Actuators B 90, 22-30 (2003). J. T. Hastings, "Optimizing Surface-Plasmon Resonance Sensors for Limit of Detection based on a CramerRao Bound," IEEE Sensors J. (to be published) (2007). W. C. Karl and H. H. Pien, "High-resolution biosensor spectral peak shift estimation," IEEE Trans. Signal Process 53, 4631-4639 (2005). E. N. Economou, "Surface Plasmons in Thin Films," Phys. Rev. 182, 539-554 (1969). J. J. Burke, G. I. Stegeman, and T. Tamir, "Surface-polariton-like waves guided by thin, lossy metal-films," Phys Rev B 33, 5186-5201 (1986). G. G. Nenninger, P. Tobiska, J. Homola, and S. S. Yee, "Long-range surface plasmons for high-resolution surface plasmon resonance sensors," Sens. Actuators B 74, 145-151 (2001). J. H. Lowry, J. S. Mendlowitz, and N. S. Subramanian, "Optical characteristics of Teflon Af(R) Fluoroplastic Materials," Opt. Eng. 31, 1982-1985 (1992). G. M. Hale and M. R. Querry, "Optical constants of water in the 200-nm to 200-µ m wavelength region," Appl. Opt. 12, 555 (1973). P. B. Johnson and R. W. Christy, "Optical-constants of noble-metals," Phys Rev B 6, 4370-4379 (1972). J. A. Woollam Co., "Optical Properties of Gold from 250nm to 1000nm," (1996).
#89188 - $15.00 USD
(C) 2007 OSA
Received 31 Oct 2007; revised 29 Nov 2007; accepted 1 Dec 2007; published 12 Dec 2007
24 December 2007 / Vol. 15, No. 26 / OPTICS EXPRESS 17661
17. "Data sheet for N-BK7," (Schott North America Inc., 2001). 18. N. H. Kim, T. J. Baek, H. G. Park, and G. H. Seong, "Highly sensitive biomolecule detection on a quartz crystal microbalance using gold nanoparticles as signal amplification probes," Anal. Sci. 23, 177-181 (2007). 19. W. M. Shu, E. D. Laue, and A. A. Seshia, "Investigation of biotin-streptavidin binding interactions using microcantilever sensors," Biosens. Bioelectron. 22, 2003-2009 (2007).
1. Introduction Surface-plasmon resonance (SPR) has become a widely accepted and commercialized optical technique for studying biological and chemical interactions. Nevertheless, detecting small changes in analyte concentration in complex solutions remains challenging because of the difficulty in distinguishing the interaction of interest from interfering effects. These effects, non-specific binding and background refractive index changes, are particularly problematic in the multi-component solutions commonly encountered in food safety, environmental, medical, and defense applications. In these cases the background index is often unknown and time varying due to changes in temperature and concentration of components other than the target analyte. One promising solution to this problem is to use multiple surface plasmon waves to sense different effects. With regard to background index compensation, both Homola et al.[1] and our group[2] have recently developed wavelength interrogated SPR sensors that exploit two surface plasmon waves to differentiate surface binding interactions from bulk refractive index changes. Both designs employ the long- and short- range surface plasmon modes of multilayer structures with approximately symmetric refractive indices. The long- and short- range modes can be excited simultaneously, but at two different wavelengths, in a Kretchman-Raether prism coupling geometry as shown in Fig. 1. In contrast to other reference compensation approaches [3-7] the dual-mode technique senses exactly the same location on the substrate, uses only a single beam, and uses two surface plasmon waves whose characteristics can be tuned to optimally distinguish background index changes and surface binding. In addition, the sensor surface is composed of only one material; therefore, a straightforward calibration can be performed when a uniform layer adsorbs over the entire sensor surface. Despite these advantages, designing dual-mode sensors presents a challenging optimization problem. Specifically, an optimal design must minimize limit-of-detection for surface interactions in the presence of bulk index changes. Determining limit-of-detection requires knowledge of both the sensor’s sensitivity and the accuracy with which one can estimate a change in resonance wavelength. Estimation accuracy intern depends on the depth and width of the spectral feature of interest.[1, 8] In addition, one cannot simply optimize one surface-plasmon mode based on these criteria; rather, one must trade-off the sensitivities and estimation accuracies for two surface-plasmon modes. Homola, et al. addressed this design problem by minimizing cross-sensitivity between the two channels. As they noted, this approach is especially effective when calibration errors dominate errors in sensor response.[1] However, this approach does not consider the impact of noise nor does it fully optimize the design using limit-of-detection as the figure of merit. In this paper we address the problem based on the Cramer-Rao bound (CRB) for spectral shift estimation in Poisson noise as derived by Karl and Pien.[9] The CRB provides a theoretical lower limit on the uncertainty with which a given parameter, e.g. surface concentration of an analyte, can be estimated in the presence of noise. The existence of an estimation algorithm that reaches the CRB, a so called efficient estimator, is not guaranteed. However, Karl and Pien showed that efficient algorithms do exist for spectral shift estimation. As we recently reported, combining the Cramer-Rao bound with transmission matrix calculations of sensitivity allows one to directly optimize sensor design using surface limit-of-detection[8] as a criterion. Here we apply this technique to dual mode sensors, and we experimentally demonstrate this approach by monitoring biotin-streptavidin binding in solutions of varying refractive index.
#89188 - $15.00 USD
(C) 2007 OSA
Received 31 Oct 2007; revised 29 Nov 2007; accepted 1 Dec 2007; published 12 Dec 2007
24 December 2007 / Vol. 15, No. 26 / OPTICS EXPRESS 17662
2. Principles of operation It is well known that thin metal films with negative real permittivity support two surface plasmon modes.[10, 11] These modes can be viewed as the coupling of the plasmon modes associated with each metal-dielectric interface. If the refractive index of the dielectric on either side of the metal is identical, then the two modes have symmetric and anti-symmetric principle field components. If there is asymmetry in the refractive index profile, then the field profiles are no longer strictly symmetric or anti-symmetric; however, this terminology is often retained, and we use it here for convenience. The symmetric mode exhibits lower absorption loss, and is termed the long-range surface plasmon (LRSP). Conversely, the anti-symmetric mode exhibits higher absorption loss and is referred to as the short-range surface plasmon (SRSP). The fields of the symmetric surfaceplasmon mode penetrate more deeply into the dielectric while the fields of the anti-symmetric mode are concentrated at the metal surfaces. As a result, surface binding influences the propagation constant of the short-range mode more strongly than the propagation constant of the long-range mode. This key difference forms the foundation for the self-referencing SPR sensor. Most SPR sensors have highly asymmetric refractive index profiles and use the surfaceplasmon mode whose fields are concentrated near the solution-metal interface. However, SPR sensors supporting both short and long range modes can be fabricated using a gold thin film on a low refractive index buffer layer.[1, 2, 12] The buffer layer is typically composed of Teflon AF, an amorphous fluoropolymer with excellent optical properties and a refractive index close to that of water.[13] If we consider the spectral interrogation of a dual mode sensor then we are interested in the wavelengths at which the long- and short-range modes are excited. The excitation wavelength is given by the standard phase matching condition k sp ( λ ) =
2π n p ( λ )
λ
sin θ
(1)
where k sp is the propagation constant of the surface plasmon wave, λ is the wavelength of
Fig. 1. Schematic diagram of a self-referencing surface-plasmon resonance sensor. The sensor consists of a gold thin film on a buffer layer (Teflon-AF) that closely matches the refractive index of the solution of interest. The structure supports two surface plasmon modes excited at different wavelengths: a symmetric (long-range, LRSP) mode whose fields extend deeper into the solution and an anti-symmetric mode (short-range, SRSP) whose fields are concentrated near the surface of the metal.
#89188 - $15.00 USD
(C) 2007 OSA
Received 31 Oct 2007; revised 29 Nov 2007; accepted 1 Dec 2007; published 12 Dec 2007
24 December 2007 / Vol. 15, No. 26 / OPTICS EXPRESS 17663
light, n p is the refractive index of the prism, and θ is the angle of incidence. For most sensor designs the higher wavenumber short-range mode will be excited at longer wavelengths and the long-range mode will be excited at shorter wavelengths. Figure 2 shows an example reflection spectrum from a self-referencing sensor with each resonance labeled. If the sensors operate in a regime where the response to both surface binding and bulkindex change are linear, then the long-range (LR) and short-range (SR) surface-plasmon resonance shifts, ΔλLR and ΔλSR respectively, are given by ΔλLR = SS-LR Δd + S B-LR ΔnB , and
(2)
ΔλSR = SS-SR Δd + S B-SR ΔnB ,
(3)
where SS-LR and SS-SR are the surface sensitivities in nm-wavelength/nm-thickness, and S B-LR and S B-SR are the bulk refractive index sensitivities in nm/refractive index unit (RIU). The subscripts indicate whether the sensitivity applies to the long or short-range resonance. Δd and ΔnB are the adsorbed layer thickness change and the bulk refractive index change respectively. If one knows the sensitivities and measures resonance wavelength shifts, these equations can be used to find the surface layer thickness and bulk index changes as follows Δd =
ΔλLR S B-LR − ΔλSR SB-SR , and SS-LR SB-LR − SS-SR SB-SR
(4)
ΔλLR SS-LR − ΔλSR SS-SR . SB-LR SS-LR − SB-SR SS-SR
(5)
ΔnB =
Thus, by measuring two different resonances we can separately determine the two unknowns of interest: surface layer thickness change, or equivalently fractional coverage, and bulk index change.
#89188 - $15.00 USD
(C) 2007 OSA
Received 31 Oct 2007; revised 29 Nov 2007; accepted 1 Dec 2007; published 12 Dec 2007
24 December 2007 / Vol. 15, No. 26 / OPTICS EXPRESS 17664
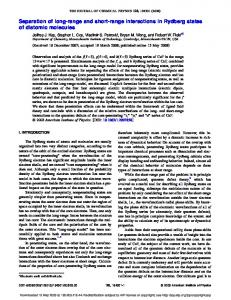
1.0 measured fit 1 fit 2
0.8
RTM/RTE
LRSP
SRSP
0.6
0.4
0.2
0
500
600
700 800 900 wav e le n g t h (n m )
1000
Fig. 2. Experimental reflection spectra from a BK7, Teflon AF (430 nm), Au (56 nm) SPR sensor in deionized water with an angle of incidence of approximately 65.5° (inside BK7 prism). The two reflection minima correspond to coupling to the long-range (LRSP) and the short-range (SRSP) surface plasmons. Also shown are theoretical fits to the spectrum using two different data sets for the dielectric constant of gold. Fit 1 uses Johnson and Christy’s values and fit 2 uses values provided by J.A. Woollam Co.
Because we measure two resonance shifts to estimate Δd and ΔnB , predicting limits of detection is slightly more involved than for a standard SPR sensor. If we assume the measurement noise for ΔλLR and ΔλSR is not correlated, then we can add the variances of the terms in the numerators of Eqs. (4) and (5). The resulting LOD at three standard deviations are given by ⎡ var
LOD ( Δd ) = 3 sqrt ⎢ ⎢⎣
LOD ( ΔnB ) = 3
2 2 ⎤ + var ( ΔλSR ) SB-SR ( ΔλLR ) SB-LR ⎥ , and 2 ⎥⎦ ( SS-LR SB-LR − SS-SR SB-SR )
⎡ var sqrt ⎢ ⎢⎣
2 2 ⎤ + var ( ΔλSR ) SS-SR ( ΔλLR ) SS-LR ⎥. 2 ⎥⎦ ( SB-LR SS-LR − SB-SR SS-SR )
(6)
(7)
In this paper we optimize for surface LOD because this is the parameter of greater interest in biochemical detection systems. As noted in the experimental section, the dependence of the resonance wavelengths on the product of the bound layer and the background index changes can be significant. In this case we must consider the more complicated relationships ΔλLR = SS-LR Δd + SB-LR ΔnB + SSB-LR Δd ΔnB , and
(8)
ΔλSR = SS-SR Δd + S B-SR ΔnB + SSB-SR Δd ΔnB .
(9)
We have introduced SSB-LR and SSB-SR to describe the product dependence for the long- and short-range resonances respectively. One must numerically solve a set of nonlinear equations to determine Δd and ΔnB from measurements of ΔλLR and ΔλSR ; however, this is a small price to pay for the improved accuracy provided by including the product term. It should also #89188 - $15.00 USD
(C) 2007 OSA
Received 31 Oct 2007; revised 29 Nov 2007; accepted 1 Dec 2007; published 12 Dec 2007
24 December 2007 / Vol. 15, No. 26 / OPTICS EXPRESS 17665
8 0
Imag{ εr}
Real{εr}
6 -20
-40
4
Johnson and Christy 2 Fit for optimization
-60
500
600
(a)
700 800 Wavelength (nm)
900
1000
0 (b)
500
600
700 800 Wavelength (nm)
900
1000
Fig. 3. Optical properties of gold used for optimization. Shown are Johnson and Christies’ data and the fit to this data used for optimization.
be noted that the surface and bulk sensitivities in Eqs. (8) and (9) will not be exactly the same as those found for the linear model because the basis functions ( Δd , ΔnB , and Δd ΔnB ) are not orthogonal. 3. Optimization of dual-mode SPR sensors We optimized the sensor configuration used for previous dual-mode SPR sensors[1, 2] and shown in Fig. 1. This sensor consists of a BK7 glass prism, a low-refractive index amorphous Teflon-AF (Dupont, Inc.) buffer layer, and a thin gold film. The variable parameters in the optimization are the angle of illumination, the Teflon-AF thickness, and the gold thickness. Water, described by the optical constants determined by Hale and Querry[14], was used for the solution. Optical constants for gold were obtained from Johnson and Christy[15] and a simple cubic polynomial fit was used to describe the wavelength dependence of the real and imaginary parts of the index. This fit was found to better approximate the experimental data over this narrow wavelength range than a Loretz-Drude model. As shown in Fig. 2, alternative values for the properties of gold from J.A. Woollam Co[16]. also provide a good fit to the experimentally observed reflection spectrum. Optical constants for BK7 were established by Sellmeier dispersion coefficients supplied by Schott North America Inc.[17], and optical constants for Teflon-AF were taken from a Cauchy dispersion formula fit to the measurements of Lowry et al.[13] To optimize for surface limit-of-detection as specified by Eq. (6), we need to determine all four sensitivity parameters and the variance of each resonance wavelength shift estimate. To determine sensitivities we calculated reflection spectra for candidate sensor designs using the transmission matrix approach and Fresnel formulae. The ratio of the TM to TE reflectivity was taken as the measured spectrum. The reflection minima were identified using an iterative search as implemented in MATLAB’s (Mathworks Inc.) fminbnd function. To determine the surface sensitivities, a uniform layer with refractive index of 1.45 was added to the surface of the gold and the shift in wavelength for minimum reflectivity was calculated. The bulk sensitivity was determined by increasing the solution index by 0.001 refractive index units (RIU) and determining the resulting resonance wavelength shifts. Fig. 4 maps the sensitivities of the short range and long range surface-plasmons to bulk and surface changes. Figure 5 shows the resonance wavelengths and minimum reflectivity associated with each mode for each design. All maps were generated with an incident angle of 65.5° (inside the BK7 prism). With regard to bulk sensitivities there is a clear tradeoff between the sensitivity of the short- and long- range modes. Thin buffer layers provide high short-range sensitivity and thicker buffer layers provide high long-range sensitivity. #89188 - $15.00 USD
(C) 2007 OSA
Received 31 Oct 2007; revised 29 Nov 2007; accepted 1 Dec 2007; published 12 Dec 2007
24 December 2007 / Vol. 15, No. 26 / OPTICS EXPRESS 17666
However, the short range sensitivity varies by only 20% over the entire design space while the long range sensitivity becomes very small for thin buffer layers. Likewise surface sensitivities are relatively constant for the short range mode (again varying by approximately 20%) while the long range sensitivity falls to very small values where the short range sensitivity is highest. This suggests that operating at a point of high long-range sensitivity is likely to offer better performance, despite the slight sacrifice in short-range sensitivity. To determine the variance with which we can estimate the resonance wavelength shift we turn to the Cramer-Rao bound for the shift of a known spectrum. This is equivalent to assuming that a well established baseline exists before any sensing event occurs. Karl and Pien recently derived the Cramer-Rao bound for the shift of discretely sampled spectrum, and we have previously used this result in the optimization of standard SPR sensors.[8] Here we reformulate Karl and Pien’s result to take into account the wavelength dependence of the light source and detector. We find that the variance of the spectrum shift estimate is given by
var ( Δλ0 )
⎛ ⎜ ⎜ ≥⎜ ⎜ ⎜ ⎝
⎞ ⎡ dR ( λ ) ⎤ ⎟ ⎢ ⎥ ⎟ ⎣ d λ λ = λ − Δλ0 ⎦ ⎟ R λi − Δλ0 ⎟ ⎟ ⎠
−1
2
∑ P (λ ) N
i
i =1
i
(
.
(10)
)
where R ( λi ) is the noise free reflectivity of the sensor and P ( λi ) is the number of detected photons at a given wavelength. To separately quantify the variance for the short and long range modes we divide the summation at the inflection point between the resonance dips.
1
0.8
0.9
1.05
550 500
0. 7
450 400
1
0 .9 45
0.8
50 55 60 Gold Thickness (nm)
0.6 65
0 680
0
670 0
660 0 650 45
69 00
400
00 0 70 710 50 55 60 65 Gold Thickness (nm)
SRSP Surface Sensitivity
600
3
600
650
450
65
LRSP Surface Sensitivity
650
00 65
550 500 450 400 45
3.4 3. 5 3. 6
0 90
500
3.3
0 0 1300 110 100 0 120 50 55 60 Gold Thickness (nm)
550
3.1
400
600
3 .2
450
Buffer Layer Thickness (nm)
500
650
Buffer Layer Thickness (nm)
1200
14 00
550
45
Buffer Layer Thickness (nm)
SRSP Bulk Sensitivity
1300
600
1400
Buffer Layer Thickness (nm)
LRSP Bulk Sensitivity 650
7 3. 3.8 50 55 60 65 Gold Thickness (nm)
Fig. 4. Calculated surface and bulk sensitivities for the long- and short- range surface-plasmon modes of a BK7-Teflon AF-Au sensor illuminated with white light at 65.5° incident angle (inside BK7). Bulk sensitivity is in nm/RIU and surface sensitivity is in nm(wavelength)/nm(thickness).
#89188 - $15.00 USD
(C) 2007 OSA
Received 31 Oct 2007; revised 29 Nov 2007; accepted 1 Dec 2007; published 12 Dec 2007
24 December 2007 / Vol. 15, No. 26 / OPTICS EXPRESS 17667
0.6
0. 4
0.2 0.1
550 500
0.2 450 0.1
400 0.1
45
0.2 50 55 60 Gold Thickness (nm)
45
65
550
920
50 55 60 Gold Thickness (nm)
65
SRSP Rmin
650 600
88 0
400
65
LRSP Rmin
650 600
50 55 60 Gold Thickness (nm)
Buffer Layer Thickness (nm)
Buffer Layer Thickness (nm)
45
450
90 0
400
500
940
450
550
980 960
680
670
660
650
640
630
620
610 600
500
600
1020
550
SRSP λ0 (nm)
650
1000
600
Buffer Layer Thickness (nm)
LRSP λ0 (nm)
650
0.1
0.05
0.3 0.2
0.1 0. 0 5
500 450 400
0.05 45
50 55 60 Gold Thickness (nm)
65
Fig. 5. Calculated surface and bulk resonance wavelengths, λ0, and minimum reflectivities, Rmin, for the long-range (LRSP) and short-range (SRSP) surface-plasmon modes of a BK7-Teflon AF-Au sensor illuminated at a 65.5° incident angle (inside BK7).
Let us first consider optimization for an illumination and detection system with a constant spectral power density. Fig. 6(a) and 6(b) maps the surface and bulk limits of detection based on calculated sensitivity and variance using Eqs. (6) and (10) as a function of Teflon-AF thickness and gold thickness at 65.5°. Moving to smaller angles and longer wavelengths holds the potential for even better performance, but places the short-range resonance beyond the detection limit of a Si detector array. Fig. 6(c) and 6(d) shows the limits of detection with experimentally determined spectra from a tungsten-halogen fiber coupled light source (Ocean Optics DH-2000 with the deuterium source disabled) and a silicon CCD based spectrometer (Ocean Optics HR-4000). In this case, the characteristics of the interrogation system establish an optimal angle between 65.5° and 66.0°. As expected, this angle places the short-range resonance well within the efficient detection region for the silicon detector. For a 65.5° incident angle, the optimum sensor design consisted of a 400nm thick Teflon layer with a 52nm thick gold layer. As shown in Fig. 5 the long- and short- range resonances fall at 625nm and 897nm respectively for lowest limit-of-detection. Importantly, the optimal design based on limit of detection is reasonably close, though not exactly the same as, Homola’s optimal design (45 nm gold layer and 355 nm thick Teflon AF layer) based on minimizing cross-sensitivity.[1] The analysis here is appropriate when the sensor is accurately calibrated and noise is the dominant source of error. If errors in the calibration coefficients are the dominant source of measurement error, then minimization of cross-sensitivity may be more appropriate. However, either criterion results in a similar final sensor design.
#89188 - $15.00 USD
(C) 2007 OSA
Received 31 Oct 2007; revised 29 Nov 2007; accepted 1 Dec 2007; published 12 Dec 2007
24 December 2007 / Vol. 15, No. 26 / OPTICS EXPRESS 17668
Constant Power Spectral Density 1/2
1/2
Surface LOD*P (nm)
0.8
1 0.8
600
0.6
0.6
550 500 450 400
1 4 . 1 2
0.6 0.8
0.3
45
(a)
50 55 60 Gold Thickness (nm)
65
Buffer Layer Thickness (nm)
650
0. 3
Buffer Layer Thickness (nm)
Bulk LOD*P (RIU) 650 600
00 15
550
00 10
100 0
500 600
450
00 10
400
(b)
0 60 45
0 150 0 0 20 0 0 30
50 55 60 Gold Thickness (nm)
65
Tungsten-Halogen Lamp with Si Detector 1/2
1/2
450
0.4
5
0.4
400 45
(c)
50 55 60 Gold Thickness (nm)
5 0 .6 0.8 1 1.4 65
20 0 15 0 00
600
1000
550 500 450
00 10 0 1502000
400 45
(d)
650
500
0.6
550
0.6
650
10 00
1. 4
0 .8
1
600
Buffer Layer Thickness (nm)
Surface LOD*P (nm)
650
0 .8
Buffer Layer Thickness (nm)
Bulk LOD*P (RIU)
50 55 60 Gold Thickness (nm)
65
Fig. 6. Bulk (a) and surface (b) limits of detection for the dual mode SPR sensor as a function of buffer (Teflon AF) thickness and gold thickness for a source/detector combination with constant power spectral density. (c,d) LODs for the dual mode sensor when interrogated with a tungsten-halogen lamp and Si CCD detector. The angle of incidence is 65.5° inside the BK7 prism. LODs are normalized to the square root of the number of detected photons. Note that the optimal design clearly depends on the illumination and detection system and that the design for optimal surface LOD is almost identical to design for optimal bulk LOD.
4. Self-referenced biosensing experiments In order to validate the effectiveness of our sensor we monitored the well characterized biotinstreptavidin binding interaction. The sensors were fabricated using a series of thin-film deposition processes. We prepared a solution containing 2% by weight fluorosilane adhesion promoter, 1H, 1H, 2H 2H-perfluorodecyltriethoxy silane (Lancaster Synthesis, Inc.), in 19:1 ethanol:water. This solution was spin coated on a BK7 glass substrate (Fisher Scientific) at 2000 RPM, and the sample was heated to 110°C on a hotplate for 12 minutes to ensure the evaporation of the solvent. Subsequently, the sensors were spin coated with Teflon-AF 1600 (Dupont, Inc.) in a Fluorinert FC-40 solution (3M) and heated to 165°C for 20 minutes. The thickness of the Teflon-AF layer was confirmed to be approximately 450nm using a Dektak 6M surface profiler (Veeco, Inc.) after scratching away a small area. An approximately 50 nm thick layer of gold was deposited onto the Teflon AF using an Anatech Hummer turbo pumped sputtering system with a quartz crystal thickness monitor. Biotin labeling of the gold surface was performed as described by Kim, et al.[18] Briefly, the sensor was immersed in a solution containing 200 μM of N-(6-[biotinamido]hexyl)-3’-(2’pyridyldithio)propionamide (biotin-HPDP, Pierce Biotechnology) in a 20 mM phosphate buffer, pH 7.4. The reaction was incubated at the room temperature for overnight (~16 hours).
#89188 - $15.00 USD
(C) 2007 OSA
Received 31 Oct 2007; revised 29 Nov 2007; accepted 1 Dec 2007; published 12 Dec 2007
24 December 2007 / Vol. 15, No. 26 / OPTICS EXPRESS 17669
Next the sensor was removed, rinsed with de-ionized water and air dried. The biotin labeled probe was kept dry in a clean container until use. As shown in Fig. 1, we placed the sensor substrate in contact with a BK7 equilateral prism (Esco Products, Inc.) using a BK7 specific index matching fluid (Cargille, Inc.). The prism and sensor were clamped in a custom made acrylic flow cell with fluorinated ethylene propylene (FEP) coated channels. Liquids were introduced to the sensor surface through polytetrafluoroethylene (PTFE) tubing using low-pulsation peristaltic pump (Isamatec). The sensor was illuminated with light from a halogen lamp (Model DH-2000, Ocean Optics, Inc.) using a 200 μm core multi-mode optical fiber and a collimating lens. The polarization of the incident light was controlled by a calcite Glan-Taylor polarizer (ThorLabs, Inc.). The reflected light was collected by another lens and coupled to a multimode fiber which routed it to a CCD based spectrometer (Ocean Optics model HR-4000). Spectrum analysis was performed by custom software developed in LabView (National Instruments). A single measurement of the TE reflection spectrum was used as a reference. Sensing experiments were carried out in 50mM Tris buffer (Sigma-Aldrich) with pH 8.0. We prepared a second buffer solution with 1% glycerol (Sigma-Aldrich) by weight to provide a known bulk refractive index change of 0.00113. Streptavidin binding was carried out in a solution of 0.05mg/mL streptavidin (Invitrogen) in 50mM Tris buffer. As can be seen in Figs. 7(a) and 7(b) both the LRSP and SRSP resonance wavelengths shift as the bulk solution 676
930
920 2
1
1
910
λLR (nm)
λSR (nm)
2
674 1
672 1
1
900 0 (a)
1
3
200 400 600 800 1000 time (s)
2 1
2
670
0
(b)
1
3
200 400 600 800 1000 time (s)
-4
1.5 Δ CS (arb. units)
Δ nB (RIU)
x 10 15 10 5 0
1
-5
0
(c)
2
1
3
1
1.0 0.5 0 1
2 1
200 400 600 800 1000 time (s)
-0.5 0 (d)
2
1
3
1
2 1
200 400 600 800 1000 time (s)
Fig. 7. Self-referenced measurement of streptavidin binding to a biotin functionalized gold surface. This experiment illustrates sensor performance for large changes in surface concentration. (a,b) SRSP and LRSP wavelengths vs. time. (c) bulk index change calculated from non-linear model (d) change in surface concentration calculed from nonlinear model. Experiments were conducted in 50mM Tris buffer (1) with 1% glycerol (2) or streptavidin (3) added. (c) and (d) clearly indicate that the dual-mode sensor compensates for changes in bulk index.
#89188 - $15.00 USD
(C) 2007 OSA
Received 31 Oct 2007; revised 29 Nov 2007; accepted 1 Dec 2007; published 12 Dec 2007
24 December 2007 / Vol. 15, No. 26 / OPTICS EXPRESS 17670
changes and as the streptavidin binds with the biotin. After calibrating based on the change in bulk index and the steady state surface concentration, one can separately determine the bulk index change and the surface concentration. Figures 7(c) and 7(d) shows the calculated surface and bulk changes based on the nonlinear model [Eqs. (8) and (9)]. The non-linear model is necessary in this case because of the large change in surface index resulting from streptavidin binding. The dual mode sensor compensates for the background index change and allows the surface concentration change to be measured separately. A 10mM HCl solution was introduced to remove some of the bound streptavidin, and the experiment was repeated on the same sensor surface. In this case, most of the streptavidin remained and the change in surface concentration was considerably smaller. Figures 8(a) and 8(b) shows the change in resonance wavelength for this experiment while Figs. 8(c) and 8(d) shows the calculated surface and bulk changes based on the linear model [Eqs. (4) and (5)]. In this case we find the linear model effectively distinguishes surface and bulk changes; however, some residual cross talk can be observed that likely arises from small non-linearity or errors in the calibration coefficients. The linear sensitivities for the short and long range modes were found to be 6300 nm/RIU and 1300 nm/RIU respectively. This is in excellent agreement with the theoretical predictions shown in Fig. 4, and the short range bulk sensitivity is competitive with traditional SPR sensors. Although it is difficult to estimate absolute surface sensitivity based on a streptavidin-biotin experiment, we can compare the surface and bulk sensitivity ratios for each mode. These ratios were measured to be S B-SR SB-LR = 4.8 and SS-SR SS-LR = 3.4 which are also in good agreement with the theoretical predictions from Fig. 4
676 2
2
2
915 3
0
Δ nB (RIU)
2
400 time (s)
600
1
(b)
0
200
400 time (s)
600
2 2
2 1
-1 0
1
3 1
672 1
-3 x 10
0 1
(c)
200
2
674
1
1
1
910 1 (a)
λLR (nm)
920
3
1
1
1
200
400 time (s)
Δ CS (arb. units)
λSR (nm)
925
600 (d)
1
1
1 3
2 0
2
1
1
-1 0
200
400 time (s)
600
Fig. 8. Self-referenced measurement of streptavidin binding to a biotin functionalized gold surface with a large surface concentration of streptavidin already present. This experiment illustrates sensor performance for small changes in surface concentration analyzed using the linear model. (a,b) Resonance wavelength vs. time for the long- and short-range surface plasmon modes. (c,d) Bulk refractive index and relative surface concentration change calculated from (a). Solutions are based on 50mM Tris buffer (1) with 1% glycerol (2) or streptavidin (3) added.
#89188 - $15.00 USD
(C) 2007 OSA
Received 31 Oct 2007; revised 29 Nov 2007; accepted 1 Dec 2007; published 12 Dec 2007
24 December 2007 / Vol. 15, No. 26 / OPTICS EXPRESS 17671
( S B-SR SB-LR = 5.1 and SS-SR SS-LR = 3.7 ). The minor discrepancies between the predicted and measured sensitivities are likely the result of uncertainty in the optical properties of gold as noted in Fig. 2. In order to determine the bulk LOD we recognize that Eq. (6) depends only on the ratio SS-SR SS-LR and not the absolute values of the surface sensitivity. Based on the variance of the resonance wavelengths in flowing Tris buffer we find the bulk LOD is 2.3×10⁻⁵ RIU for 1 second sampling. The surface limit of detection, in terms of relative surface concentration change, was determined to be 0.012. If we assume a surface density of 1 protein/100nm2 for streptavidin[19] we estimate a mass LOD of 11pg/mm2. It should be noted that the variance used to calculate this LOD includes the effects of pump pulsation and represents the performance of a high-noise, CCD-based spectrometer. Even with these considerations, and despite the inherent tradeoffs in optimizing self-referencing sensors, these LODS remain competitive with typical SPR sensors while allowing operation in solutions with varying refractive index. 5. Conclusions We conclude that spectrally interrogated SPR sensors supporting both long- and short-range surface-plasmon modes can differentiate between background refractive index changes and surface-binding of a target analyte. Sensitivities of dual mode sensors can be adequately predicted based on bulk-optical properties and Fresnel reflection calculations. However, optimal sensor design requires consideration of minimum reflectivity, FWHM of the spectral feature, and the power spectral density of the interrogation system in addition to surface and bulk sensitivities. When these factors are considered, good performance can be obtained over a range of metal and buffer layer thicknesses; however, for a given interrogation system a clearly optimum sensor design exists. When properly optimized, dual-mode SPR sensors can be competitive with traditional SPR sensors in terms of sensitivity and LOD for surface effects while compensating for bulk index changes. Acknowledgments This material is based upon work supported by the National Science Foundation under Grant No. 0601351. Facilities and technical assistance for this work were provided by the University of Kentucky Center for Nanoscale Science and Engineering (CeNSE) which is supported by National Science Foundation EPSCoR Grant No. 0447479.
#89188 - $15.00 USD
(C) 2007 OSA
Received 31 Oct 2007; revised 29 Nov 2007; accepted 1 Dec 2007; published 12 Dec 2007
24 December 2007 / Vol. 15, No. 26 / OPTICS EXPRESS 17672