Optimism without illusion: The impact of experience on expectations. Ron Kaniel
... Early work on positive illusions asked about unobserved events (Weinstein ...
Optimism without illusion 1
Running head: OPTIMISM WITHOUT ILLUSION
Optimism without illusion: The impact of experience on expectations
Ron Kaniel Fuqua School of Business Duke University Cade Massey School of Management Yale University David T. Robinson Fuqua School of Business Duke University
Authorship order is alphabetical. Comments Welcome.
Optimism without illusion 2 Abstract Whether judgment and decision-making biases improve with experience remains an important and contentious question. Positive illusions, for example, have been documented extensively, but virtually always in single-shot settings. To what extent do these illusions persist over time? And what factors influence their persistence? We suggest that dispositional optimism plays an important but surprising role. Building on the link between optimism and positive coping, we suggest that, given experience, dispositional optimists have fewer positive illusions than pessimists. We test this hypothesis in a longitudinal study of graduate students. Initially we find that optimists’ expectations about their grades are more positively biased than pessimists’. However, the impact of experience is quite different for optimists than pessimists—optimists’ positive illusions decline over time while pessimists’ increase. Consequently, by year’s end the pattern is fully reversed: optimists have fewer positive illusions than do pessimists.
Optimism without illusion 3 Optimism without illusion: The impact of experience on expectations Positive illusion is a pervasive feature of the human condition, impacting beliefs in a wide range of decision-making environments (Taylor & Brown, 1988; Chambers & Windschitl, 2004). Yet in many situations where positive illusion arises, knowledge is gained with additional experience. And experience is a well prescribed antidote for psychological biases. Do positive illusions persist in the face of this experience? If so, how? These questions are particularly salient when we consider that life’s most important decisions often share two features. First, people have a strong preference for the way in which uncertainty is resolved (e.g., marriages that last, investments that grow, health that is robust). Second, they have the opportunity to learn over time about the likelihood of that preferred outcome. Hence, many critical judgments come with both the fuel for positive illusions as well as the feedback necessary to mitigate them. Which of these prevails? This combination of fuel and feedback limits our ability to draw from existing research to answer these questions. Early work on positive illusions asked about unobserved events (Weinstein, 1980). More recent studies focus on beliefs about observable behavior—for example, test performance, (Kruger & Dunning, 1999; Moore & Small, 2007)—but typically are limited to single-shot trials in which there is little if any opportunity to learn. Likewise, there is an extensive literature on belief revision (Edwards, 1968; Kahneman & Tversky, 1973), but it is focused exclusively on uncertainties about which individuals are indifferent. Research on the revision of beliefs about uncertainties in which a person has a vested interest is
Optimism without illusion 4 almost non-existent (cf. Shepperd, Ouellette, & Fernandez, 1996; Gilovich, Kerr, & Medvec, 1993). We theorize that the impact of experience on positive illusions in these situations depends on dispositional optimism, though in a surprising direction. Optimists learn. That is, they abandon unrealistically positive beliefs more readily than do pessimists. This follows from three sets of behaviors strongly associated with dispositional optimism. One of the strongest correlates of dispositional optimism is positive coping (Scheier, Carver, & Bridges, 1994): optimists are more likely to actively engage problems, positively reframe situations, plan a course of action, and rely on social support (Scheier, Weintraub, & Carver, 1986). These behaviors should increase the likelihood of abandoning positive illusions. Conversely, pessimists are more apt to display negative coping strategies such as avoiding feedback and withdrawal. Optimists also pay more attention to threatening information when that information is personally relevant (Aspinwall and Brunhart (1996); Radcliffe and Klein (2002); but see Isaacowitz (2005)), a necessary condition for appropriate belief revision. Finally, optimists are more likely to disengage from unrealistic goals (Aspinwall & Richter, 1999) and re-engage in new ones (Rasmussen, Wrosch, Scheier, & Carver, 2006). This flexibility provides an alternative to the perseverance of positive illusions in the face of negative feedback. The combination of these behaviors—positive coping, attention to feedback, and flexibility in the pursuit of goals—leave optimists better equipped to learn over time, hence moderating the relationship between positive illusions and experience. The few studies investigating the relation between positive illusions and dispositional optimism have found a weakly positive relationship (Armor & Taylor,
Optimism without illusion 5 1998; Radcliffe & Klein, 2002). However, by not considering experience, this research has constrained the impact of dispositional optimism. As detailed above, it is precisely over time that optimism has been shown to exert its greatest influence. Indeed, it seems likely that one cannot observe the influence of optimism on positive illusions without considering the impact of experience. We develop an empirical framework for studying positive illusion that allows us to explore the role of optimism and experience in shaping beliefs when individuals have vested interests over outcomes. We do this by evaluating academic performance in an MBA program, comparing student expectations with actual outcomes. While this is an almost-canonical positive illusion paradigm, we extend it in two directions. First, we take repeated measurements of positive illusion in an otherwise stable learning environment, allowing us to measure the role of experience on positive illusion in an situation in which participants have strong motivations and receive diagnostic feedback. Second, we consider the role of dispositional optimism and how it interacts with experience to shape positive illusion. This provides an additional perspective on the impact of experience on positive illusions, as well as insights into how specific behaviors affect this relationship. Method Participants A total of 232 first-year M.B.A. students (53% response rate) at a mid-Atlantic university participated. Participants were recruited via email, directed to the entire first-year class, asking for participation in a brief on-line study in exchange for the prizes detailed below. Participant demographics closely match the
Optimism without illusion 6 student population: 22% female (vs. 22% in the population), 48.7% white (vs. 44.7%), 28.9 years old (mean, vs. 29.1), and 705 GMAT (mean, vs. 700). Procedure Students completed four on-line surveys during the school year. The first occurred during orientation (“Time 0”), and the others at the start of the Fall-1 (“Time 1”), Spring-1 (“Time 2”) and Spring-2 (“Time 3”) academic terms.1 Students who completed a survey received a $5 gift card to a national coffee chain, as well as entry into a drawing for a $100 gift certificate to a local restaurant. To create incentives for thoughtful predictions, we also entered participants into a lottery for a $1,000 gift certificate in proportion to the ex post accuracy of their predictions. Measures Dispositional optimism. The first survey consisted of the Life Orientation Test - Revised (LOT-R), commonly used for assessing dispositional optimism (Scheier et al., 1994). This measure of generalized outcome expectancies consists of 6 items (e.g., “In uncertain times, I tend to expect the best”), each of which is rated on a scale ranging from “strongly disagree” to “strongly agree”, plus 4 filler items. Each item is scored on a 0-to-4 scale, giving a theoretical range of 0-24. Expectations. Surveys 2-4 contained questions about expectations for future academic performance. At the beginning of each term we asked students to predict the decile of their grade-point average (GPA) in that term. We provided the historical GPA range for each decile (e.g., “Top decile (3.88-4.00)”), so that student predictions reflect both relative and absolute performance levels.
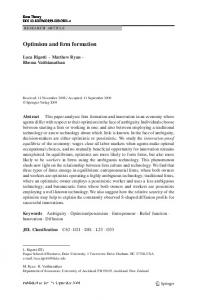
Optimism without illusion 7 Performance. Following each term we collected actual grades, computing GPAs and deciles for each student. We then compared these archival data with survey responses to assess the accuracy of participants’ expectations.2 Results Perhaps unsurprisingly, MBA students are a relatively optimistic bunch. The mean LOT-R score is 16.1 (SD=4.0), slightly higher than the norms reported by Scheier et al. (1994), (Ms 14.28-15.24, SDs 3.97-4.33). For ease of exposition, and following convention, we refer to those in the bottom half of the distribution as “pessimists” (M=13.7, SD=3.1) and those in the top as “optimists” (M=19.2, SD=1.9), though technically this categorization indicates only their relative optimism in our sample. Students’ initial expectations exceeded their performance. At Time 1, the average student predicted a GPA 0.88 deciles better than it actually was (SD=3.14, t(231)=4.27, prep > .999). More predictions turned out to be optimistic than pessimistic (49% vs. 35%, F(1, 196)=4.34, prep = .894), while only 16% were accurate. In addition to being inflated, these predictions were not strongly correlated to outcomes (ρ = 0.33, prep > .999). Figure 1 shows the relationship between predicted and actual GPAs. The “Time 1” line reveals positive illusions (more predictions are above the identity line than below it) and weak calibration (the line is relatively flat). The relationship is also slightly convex, suggesting better calibration by those students with better GPAs (Burson, Larrick, & Klayman, 2006). This pattern is strikingly similar to that found in previous research on positive illusions by Kruger and Dunning (1999).
Optimism without illusion 8 Our comparison to previous work is simply a point of departure: our main goal is to investigate the impact of experience on the predictive task at hand, and how that impact is moderated by optimism. Additional lines in Figure 1 depict this impact. Compared to the initial curve, the “Time 2” curve is higher on average (meaning positive illusions increase), steeper (calibration improves), and more linear (calibration is more consistent throughout the performance range). Note that these effects have two origins – improved calibration by those in the lower performance percentiles, and a general elevation. In sum, though the judgment of the worst performers improves, the aggregate increase in expectations leads to more positive illusions overall. At Time 3, positive illusions retreat, lying between those from Times 1 and 2. Overall, this better-calibrated-but-more-biased pattern parallels that seen in judgments about the self compared to those about other people (Epley & Dunning, 2006). Next we consider positive illusions directly. In Figure 2 we graph forecast accuracy each period. Importantly, the bias is positive each period (all three prep > .999). Positive illusions are reliably higher at Time 2 than at Time 1 (M=0.54, SD=3.97, t(462)=2.07, prep = .893). The other differences between periods are insignificant (Times 2 to 3: M=-0.29, SD=3.62, t(462)=-1.20, prep = .69; Times 1 to 3: M=0.25, SD=4.13, t(462)=0.93, prep = .602).3 Finally we consider how this pattern varies with dispositional optimism. Figure 3 relates positive illusion and experience separately for optimists and pessimists. Note first that we again observe positive illusions throughout: on average, prediction exceeds performance in both time periods and both sub-samples (all prep > .95 except pessimists in term1; prep = .63). We subject forecast accuracy
Optimism without illusion 9 to an Experience (Time 1 / Time 2 / Time 3) X Optimism (LOT-R) repeated-measures analysis of covariance (ANCOVA). We find a main effect of experience - participants showed greater positive illusions over time (F(2,460)=4.25, prep = .942). Importantly, this was qualified by a significant interaction between experience and optimism (F(2,460)=3.5, prep = .91). Follow up analyses revealed that optimists exhibit significantly more positive illusions than do pessimists at Time 1 (M=1.11, SD=4.38, t(230)=2.74, prep > .956). However, no difference between groups appears at Time 2 (M=.014, SD=3.45, ns), and the difference reverses at Time 3, with pessimists showing more positive illusions than optimists (M=0.84, SD=3.76, t(230)=2.41, prep = .931). To ensure the robustness of these findings, we considered alternative ANCOVA specifications. We replaced estimated grade deciles with estimated grade ranges.4 The experience measure was highly significant here also (F(1,231) = 5.9, prep = .98), as was the interaction of optimism and experience (F(2,460)=3.34, prep = .90). In addition, we determined that these results are robust to the inclusion of a wide range of demographic variables, including sex, ethnicity, GMAT scores, and salary before graduate school. We also checked whether our dispositional optimism measure was stable over time by collecting additional LOT-R measurements on all subjects approximately 18 months after the initial LOT-R measurement was conducted. The within-subject correlation of the two measures was ρ = 0.72 (prep > .99). The mean LOT-R score was statistically indistinguishable across the two measurements (Ms 22.20 vs. 21.86, SDs 3.90 vs. 3.86), and, in a multiple regression model, none of the events we observed—such as academic performance and job-market outcomes—had any impact on changes in LOT-R over time.
Optimism without illusion 10 Discussion Two broad themes emerge from these findings. The first concerns the robustness of positive illusion. Experience does not mitigate positive illusions—in aggregate, they are as strong near the end of the academic year as in the beginning. Moreover, initial experience actually exacerbates positive illusions. This challenges the view that positive illusions are an artifact of laboratory settings and/or single-shot experiences. In this regard, the results are sobering: even in such an accommodating environment, experience does not hold the antidote for psychological biases that is often suggested (List, 2003; Coursey, Hovis, & Schulze, 1987). The second theme is the surprising role of optimism in moderating the robustness of positive illusion. Optimists’ positive illusions diminish with experience, while pessimists’ grow. This pattern highlights an important difference in how optimism is operationalized in the psychology literature: generalized expectancies versus situation-specific expectancies (as Peterson (2000) puts it, “big optimism” versus “little optimism”). Not only are these distinct constructs, they do not appear to relate in the way that intuition would suggest. While some evidence suggests that optimists are more prone to positive illusions (Armor & Taylor, 1998; Radcliffe & Klein, 2002), we find that with experience the relation is actually negative. Clarifying the relation between optimism and positive illusion raises new questions. In particular, what specific behaviors promote learning from experience? The role of optimism in this process implicates a handful of behaviors, including positive coping, attention to feedback and goal disengagement. Better understanding which of these behaviors are critical would inform burgeoning
Optimism without illusion 11 research on the prescriptive implications of judgment and decision-making biases (Thaler & Sunstein, 2008). It would also complement the growing body of work in finance and economics concerned with optimism (Puri & Robinson, 2007), cognitive bias (Baker, Ruback, & Wurgler, 2004), and “optimally miscalibrated” expectations (Brunnermeier & Parker, 2005). Our study is limited to the first year of graduate school. While students receive substantial feedback in this period, what happens if and when they receive more? With enough of the right kind of feedback, positive illusions might diminish for everyone. But how much experience is necessary, and of what type? This is an important and under-explored question. After all, in how many domains does one receive the frequency and quality of feedback received in graduate school? Researchers have suggested that, despite whatever short-term benefits positive illusions might offer, its long-term consequences are severe (Robins & Beer, 2001; Colvin, Block, & Funder, 1995). Our results suggest that dispositional optimists might have the best of both worlds, enjoying the short-term benefits of positive illusions yet learning enough from experience to navigate the long-term costs. As George Orwell famously noted (Orwell, 1949), “The secret of rulership is to combine a belief in one’s own infallibility with the power to learn from past mistakes.” Perhaps Orwell’s secret rings true of life even more broadly.
Optimism without illusion 12 References Armor, D., & Taylor, S. (1998). Situated optimism: Specific outcome expectancies and self-regulation. In Advances in experimental social psychology (Vol. 30, p. 309-379). Princeton, NJ: Princeton University Press. Aspinwall, L., & Richter, L. (1999). Optimism and self-mastery predict more rapid disengagement from unsolvable tasks in the presence of alternatives. Motivation and Emotion, 23 (3), 221-245. Aspinwall, L. G., & Brunhart, S. (1996). Distinguishing optimism from denial: Optimistic beliefs predict attention to health threats. Personality and Social Psychology Bulletin, 22 (10), 993-1003. Baker, M. P., Ruback, R. S., & Wurgler, J. A. (2004). Behavioral Corporate Finance: A Survey [Working Paper Series]. SSRN eLibrary. Brunnermeier, M., & Parker, J. (2005). Optimal expectations. American Economic Review, 95, 1092-1118. Burson, K. A., Larrick, R., & Klayman, J. (2006). Skilled or unskilled, but still unaware of it: How perceptions of difficulty drive miscalibration in relative comparisons. Journal of Personality and Social Psychology, 90 (1), 60-77. Chambers, J. R., & Windschitl, P. (2004). Biases in social comparative judgments: The role of nonmotivated factors in above-average and comparative-optimism effects. Psychological Bulletin, 130 (5), 813-838. Colvin, R. C., Block, J., & Funder, D. C. (1995). Overly positive self-evaluations and personality: Negative implications for mental health. Journal of Personality and Social Psychology, 68 (6), 1152-1162. Coursey, D. L., Hovis, J. L., & Schulze, W. D. (1987). The disparity between
Optimism without illusion 13 willingness to accept and willingness to pay measures of value. Quarterly Journal of Economics, 102 (3), 679-690. Edwards, W. (1968). Conservatism in human information processing. In B. Kleinmuntz (Ed.), (p. 17-52). New York: Wiley. Epley, N., & Dunning, D. (2006). The mixed blessings of self-knowledge in behavioral prediction: Enhanced discrimination but exacerbated bias. Personality and Social Psychology Bulletin, 32, 641. Gilovich, T., Kerr, A., & Medvec, J. (1993). Effect of temporal perspective on subjective confidence. Journal of Personality and Social Psychology, 64 (4), 552-560. Isaacowitz, D. (2005). The gaze of the optimist. Personality and Social Psychology Bulletin, 31 (3), 407-415. Kahneman, D., & Tversky, A. (1973). On the psychology of prediction. Psychological Review, 80, 237-251. Kruger, J., & Dunning, D. (1999). Unskilled and unaware of it: How difficulties in recognizing one’s own incompetence lead to inflated self-assessments. Journal of Personality and Social Psychology, 77 (6), 1121-1134. List, J. A. (2003). Does market experience eliminate market anomalies? Quarterly Journal of Economics, 118 (1), 41-71. Moore, D., & Small, D. (2007). Error and bias in comparative judgment: On being both better and worse than we think we are. Journal of Personality and Social Psychology, 92 (6), 972-989. Orwell, G. (1949). Nineteen eighty-four. a novel. London: Secker and Warburg. Peterson, C. (2000). The future of optimism. American Psychologist, 55 (1), 44-55.
Optimism without illusion 14 Puri, M., & Robinson, D. T. (2007). Optimism and economic choice. Journal of Financial Economics, 86 (1), 71-99. Radcliffe, N., & Klein, W. (2002). Dispositional, unrealistic, and comparative optimism: Differential relations with the knowledge and processing of risk information and beliefs about personal risk. Personality and Social Psychology Bulletin, 28 (6), 836-846. Rasmussen, H., Wrosch, C., Scheier, M., & Carver, C. (2006). Self-regulation processes and health: The importance of optimism and goal adjustment. Journal of Personality, 74 (6), 1721-1747. Robins, R. W., & Beer, J. S. (2001). Positive illusions about the self: Short-term benefits and long-term costs. Journal of Personality and Social Psychology, 80 (2), 340-352. Scheier, M., Carver, C., & Bridges, M. (1994). Distinguishing optimism from neuroticism (and trait anxiety, self-mastery, and self-esteem) - a reevaluation of the life orientation test. Journal of Personality and Social Psychology, 67 (6), 1063-1078. Scheier, M., Weintraub, J., & Carver, C. (1986). Coping with stress - divergent strategies of optimists and pessimists. Journal of Personality and Social Psychology, 51 (6), 1257-1264. Shepperd, J., Ouellette, J. A., & Fernandez, J. K. (1996). Abandoning unrealistic optimism: Performance estimates and the temporal proximity of self-relevant feedback. Journal of Personality and Social Psychology, 70 (4), 844-855. Taylor, S., & Brown, J. (1988). Illusion of well-being: a social psychological perspective on mental health. Psychological Bulletin, 103 (2), 193-210.
Optimism without illusion 15 Thaler, R., & Sunstein, C. (2008). Nudge. New Haven: Yale University Press. Weinstein, N. D. (1980). Unrealistic optimism about future life events. Journal of Personality and Social Psychology, 39 (5), 806-820.
Optimism without illusion 16 Footnotes 1 No survey occurred in Term 2 because one of the authors taught a substantial
number of the students during that term. 2 For this framework to capture the impact of experience, students must receive
feedback that is diagnostic of future performance. This requires grades to be correlated over time. This holds in our sample: the minimum pairwise correlation of student GPAs across any two terms is 0.58 (prep > .999). Hence, there is at least the potential to learn in this environment. 3 The bias reflects revisions in both performance and expectations. Neither is
statistically discernible alone. 4 In principle, the measures could depend on whether predictions are coded as
deciles or ranges, because historical and realized distributions do not always match.
Optimism without illusion 17 Figure Captions Figure 1. Calibration Curves Over Time Figure 2. Positive Illusion Over Time Figure 3. Positive Illusion Over Time by Optimist vs. Pessimist
100 Predicted Percentile 40 60 80 20 0 0
20 Time 1
40 60 Actual Percentile Time 2
80
100 Time 3
2)3',$ 2)3',4
6'17 2)3',5
89
!!"
%&'()*+'(,-'*).',!,/*+01.,-'*).' # !" $ $!"
0
.5
1
1.5
Optimists
−.5
Predicted Decile − Actual Decile
Pessimists
Time 1
Time 2
Time 3
Mean
Time 1
Time 2
SE
Time 3