International Journal of Computer Science and Communication
Vol. 2, No. 2, July-December 2011, pp. 411-413
OPTIMIZATION OF QUESTIONNAIRE FOR DETERMINING AYURVEDIC IMBALANCES Mandeep Singh1 and Anil Anand2 Department of Electrical & Instrumentation Engineering, Thapar University, Patiala, India. E-mails:
[email protected],
[email protected] 1,2
ABSTRACT Any disease in human body is primarily on account of some type of imbalance. This imbalance may be in chemicals or hormones or in vital energy and is detected by various healthcare systems. In Ayurveda this imbalance is characterized by three doshas i.e. Vata, Pitta and Kapha. It is required that an optimized questionnaire be designed to determine three doshas. This work reports the use of Principal Component Analysis (PCA) in determining the relevant questions to be framed in the questionnaire of the 83 questions possible, from which 31 questions are selected based on result of PCA. Questions within the sub-group that have maximum correlation are selected and the results are compared with 83-weighted-questions questionnaire. We get encouraging proportionate errors in this research method. Keywords: Doshas, Questionnaire, Principal Component Analysis (PCA).
1. INTRODUCTION Determination of Ayurveda doshas is traditionally done by quizzing the subject. Several questionnaires are employed to this effect. However there is a significant difference in the results obtained by using these questionnaires [1,5]. To reduce this ambiguity in the method to be followed, different questions of all possible questionnaires are combined to form an enhanced questionnaire containing 83 questions. This questionnaire is filled by 100 subjects and the results are analyzed using Principal Component Analysis (PCA) [6, 7]. An earlier study has revealed that out of 83 questions only 31 questions are mutually orthogonal. The present work focuses on selection of these 31 questions. 2. PROBLEM DEFINITION In absence of any standard questionnaire available, the 83-questions questionnaire is analyzed for its principal component and 31 sub-groups are found. Weightage of the question in each sub-group is determined as 1 divided by number of questions in sub-group i.e. if subgroup has two questions then each question is given weightage of 0.5, incase the sub-group has 4 questions then each questions carries a weightage of 0.25 and so on. This method may be treated as gold standard. Further an equal weightage 83-questions questionnaire give results as compared to this gold standard with Root Mean Square Deviation (RMSD) less than 4% as determined in earlier studies. It is practically very tedious and boring job for the subject to fill in 83 questions. It is therefore required that the questionnaire be reduced from 83 questions to 31 questions. The problem here is to select the 31 relevant questions to optimize the questionnaire. A suitable mathematical technique is therefore required.
3. METHOD 31 sub-groups are formed as per the PCA done in earlier studies and each sub-group contains the questions having maximum correlation amongst themselves within the sub-group. In this investigation it is proposed that 1 question each from 31 sub-groups be selected. The formula to find correlation is given as:
rxy =
∑ xi y i – nx y n ∑ xi y i – ∑ xi ∑ y i = 2 (n – 1)sx sy n ∑ xi – ( ∑ xi )2 n ∑ y i2 – ( ∑ y i )2
Where x and y are the sample means of X and Y, sx and sy are the sample standard deviations of X and Y, n is number of pairs of measurement, ∑ xi yi is the sum of product of paired variables, ∑ x i sum of X variable, ∑ y i sum of Y variable, ∑ x i2 sum of squared X variable, ∑ y i2 sum of squared Y variable. The base of this selection is taken as the total sum of correlation with other questions within that sub-group. This questionnaire containing 31 questions is to be used for determining Vata, Pitta and Kapha in 12 subjects and the results are to be compared with the gold standard using RMSD [8]. The Root Mean Square Difference (RMSD) is defined as below: RMSD( θ1 , θ 2 ) = MSD( θ1 , θ 2 ) = D(( θ1 – θ 2 )2 )
=
∑
n i =1
( x1, i – x 2 , i )2 n
International Journal of Computer Science and Communication (IJCSC)
412
x1,1 x2 ,1 x x 1,2 2 ,2 θ1 = : and θ2 = : : : x1,n x2 , n x = Observed value; n = Range of observed value; MSD = Mean Square Difference; D = Difference; A parallel alternate study is made independent of formulation of subgroups by choosing 31 questions as suggested by PCA, that are mutually orthogonal to all other components, on the basis of minimum absolute correlation taken with the all questions in the group. While the former method is thereafter referred to as subgroup method, the latter is referred as minimum correlation method. 4. RESULT AND DISCUSSION Before discussing the numerical results obtained by this method, it is relevant that we understand the concept of proportionate error. Suppose a survey is conducted by asking 10 questions from the respondents, than the percent error that creeps in on account of one wrongly filled or wrongly recorded answer is 10%. Suppose the same survey is conducted by asking 25 questions from the respondents than the error that creeps in on account of one wrongly filled or recorded answer is only 4%. This is on the lines of least count principal of measuring instruments. Thus we may safely conclude that 10% error in 10-question questionnaire is equivalent to 4% proportionate error in 25-questions questionnaire. The results and discussions that follow thereafter shall be in terms of proportionate error rather than in absolute error.
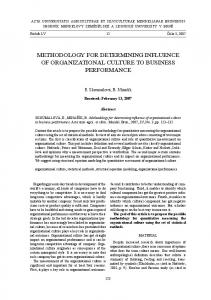
Step 3: Vata, Pitta and Kapha of these 12 subjects are determined using the gold standard method containing 83 questions of different weightage as described above. Step 4: Vata, Pitta and Kapha of these 12 subjects are determined using sub-group method containing 31 questions. Step 5: Vata, Pitta and Kapha of these 12 subjects are determined using minimum correlation method containing 31 questions. Step 6: RMSD for Vata, Pitta and Kapha in 12 subjects is calculated between the results obtained in step 2 and step 3. Step 7: Expected proportionate error for 31 questions sub-group method as well as 31 questions minimum correlation method is calculated, simply by multiplying the RMSD calculated in step 6 by factor (83/31). Step 8: RMSD of Vata, Pitta and Kapha is calculated for the results obtained in step 4 and step 3. Step 9: RMSD of Vata, Pitta and Kapha is calculated for the results obtained in step 5 and step 3. Step 10: Tabulate and Plot the results in Table 1 and Fig1 for interpretation. Table 1 Actual and Expected Proportionate Percentage RMSD for Different Techniques
Dosha
RMSD(%) Expected for 83proportionate question RMSD(%) and gold for 31 standard question method method
To check the efficiency of sub-group method and minimum correlation method following steps are used:
Actual RMSD(%) for 31 questions sub-group and gold standard method
Actual RMSD(%) for 31 questions minimum correlation and gold standard method
Step 1: 12 subjects are chosen randomly.
Vata
3.38
9.04
5.24
4.59
Step 2: Their Vata, Pitta and Kapha is determined by 83-questions questionnaire each questions carrying a weightage of 1.
Pitta
3.31
8.84
4.79
6.12
Kapha
3.92
10.48
3.46
5.36
Figure 1: Actual and Expected Proportionate Percentage RMSD for Different Techniques
Optimization of Questionnaire for Determining Ayurvedic Imbalances
5. CONCLUSION It is clear from Table1 that RMSD of 31-question subgroup method with gold standard method is appreciably lower than its expected proportionate error. Further, the same argument holds good for 31-question minimum correlation method. It is therefore safely concluded that both of these methods are equally acceptable, even though the two questionnaires contain only 13 common questions out of total of 31 questions. It is proposed that further investigation can be made for determining Ayurvedic imbalances using a small questionnaire containing 13 questions. REFERENCES [1] The Basic Principles of Ayurveda, Available at http:// www.kimayaayurveda.com/ page_attachments/0000/0086/ The_Basic_Principles.pdf. [2] R.R. Joshi, “A Biostatistical Approach to Ayurveda: Quantifying the Tridosha”, The Journal of Alternative and Complementary Medicine, 10, No. 5, pp. 879–889, 2004.
413
[3] Discovering Your Constitution (Prakriti), Available at http://www.hummingbirds.co.za/objects/bodytype.pdf. [4] Ayurvedic Concepts of Nutrition and Dietary Guidelines for Promoting/Preserving Health and Longevity, Available at http://www.nutritionfoundationofindia.res.in/ FetchSchriptpdf/festschrift%20%20for%20%20Dr%20 Gopalan/Section%201scientific%20papers/Satyavati% 204.11.pdf. [5] Index of /resources: constitution_Form.pdf, Available at http://www.somactr.com/resources. [6] D.S.K. Mendis, A.S. Karunananda and U. Samarathunga, “A Computer Model for Diagnosis of Human Constituents”, International Conference on Information and Automation, pp. 13-16, Colombo, 2006. [7] Principal Components and Factor Analysis, Available at http://www.statsoft.com/ textbook/ principal-componentsfactor-analysis. [8] Root Mean Square Deviation, Wikipedia, the Free Encyclopedia Available at http:// en.wikipedia.org/ wiki/ Root_mean_square_deviation.