smoothing. The project management software MS-Projects is adopted hereto ..... the project. There are two types of Network Scheduling AOA and AON. The.
REPUBLIC OF IRAQ MINISTRY OF HIGHER EDUCATION AND SCIENTIFIC RESEARCH UNIVERSITY OF BAGHDAD COLLEGE OF ENGINEERING DEPARTMENT OF CIVIL ENGINEERING
Optimization of Resource Allocation and Leveling Using Genetic Algorithms A Thesis Submitted to the College of Engineering of the University of Baghdad in a Partial Fulfillment of the Requirements of the Degree of Master of Science in Civil Engineering (Construction Management)
By
Ameer Ahmed Abdul Ameer B.Sc.(2005)
May / 2009
Jamady Alolaa / 1430 i
CERTIFICATE
I certify that this thesis entitled (Optimization of
Resource
Allocation and Leveling Using Genetic Algorithm) is prepared by the
student Ameer Ahmed Abdul Ameer under my supervision in the University of Baghdad/College of Engineering/Department of Civil Engineering in partial fulfillment of the requirements of the degree of Maser for Science in Civil Engineering.
Signature: Name: Assist. Prof. Dr. Sawsan Rasheed Mohammed Date:
In view of the available recommendations, I forward this thesis for debate by the Examining Committee.
Signature: Name: Prof. Dr. Raafe H. Al-Suhaili (Head of the Department of Civil Engineering / University of Baghdad) Date:
ii
COMMITTEE CERTIFICATION We certify, as an examining committee, that we have read this thesis titled "Optimization of Resource Allocation and Leveling Using Genetic Algorithms", and examined the student " Ameer Ahmed Abdul Ameer " in its content and in what is connected with it, and that it meets the standard of a thesis for the degree of Master of Science in Civil Engineering.
Signature: Name: Dr.Sedki E. Razouki (Member) Date: / / 2009
Signature: Name: Asst.Prof.Dr.Sawsan R. Mohamed (Supervisor) Date: / / 2009
Signature: Signature: Name: Prof.Dr.Mohammed M. Salman Name: Prof. Dr. Raafe H. Al-Suhaili (Member) (Chairman) Date: / / 2009 Date: / / 2009
Approval of the College of Engineering
Signature: Name: Prof. Dr. Qasim Muhammad Doos`Al-Attaby (Acting Dean) Date / / 2009
iii
بسم هللا الرحمن الر حيم
وما أوتيتم من العلم إل ا قليال صدق اهلل العمي العظيم سورة االسراء – آية 58
iv
DEDICATION
To My Mother, My Family, & My Fiancée
v
جمهورية العراق وزارة التعليم العالي والبحث العلمي جامعة بغداد كلية الهندسة قسم الهندسة المدنية
أمثلية تسوية وتعيين المصادر باستخدام الخوارزميات الجينية اطروحة مقدمة الى
كمية الهندسة /قسم الهندسة المدنية /جامعة بغداد كجزء من متطمبات نيل شهادة ماجستير عموم في الهندسة المدنية (ادارة مشاريع)
من
أمير أحمد عبد األمير
بكالوريوس عموم الهندسة المدنية – جامعة بغداد 5008
جمادي األولى 0340/
آيار 5002 /
vi
الخالصة ان تعيين وتسوية الموارد ىي من اكثر التحديات في ادارة المشروع بسبب تعقيد المشاريع. ييدف ىذا البحث الى بناء نموذج امثل لتسوية الموارد .حيث ان تسوية الموارد تحاول من تقميل المتطمبات القصوى والتذبذبات بالموارد من فترة واخرى مع وفرة الموارد بدون تغيير مدة المشروع وان اليدف من عممية التسوية ىو لجدولة فعاليات المشروع. لقد تم بناء النموذج المقترح باستخدام برنامج C++لتسوية الموارد وكما تم اعتماد برنامج الدارة المشاريع ) (MS-Projectالجراء تسوية الموارد لتسييل الوصول الى الحل االمثل .يعتمد النموذج المقترح عمى اسموب الخوارميات الجينية حيث تم بناؤه باستخدام برنامج ) (C++لمبحث عن الحل االمثل. توصل البحث الى امكانية تسوية الموارد باستخدام الخوارزميات الجينية ومقارنتيا مع برنامج MS-Projectولقد وجد ان نتائج الخوارزميات الجينية افضل من نتائج
MS-
Projectبسبب ان عزم الموارد واعمى قمة وعدد التغيرات والقمم تصبح اقل في الخوارزميات الجينية. طبقت نتائج البحث عمى ثالث حاالت درست وكانت نتائج التطبيق مطابقة لما ىدف اليو البحث حيث ان الحالة المدروسة االولى والثانية كانت افتراضية والثالثة كانت حقيقية وىي عبارة عن بناية مكونة من ثالث طوابق حيث ان عزم الموارد = 5463واعمى قمة = 62 وعدد التغيرات وعدد القمم = 2في نتائج MS-Projectوعزم الموارد = 5243
vii
واعمى
وتم التوصل الى عدد. في نتائج الخوارزميات الجينية5 = وعدد التغيرات وعدد القمم62 = قمة من االستنتاجات كما وضعت عدد من التوصيات والمقترحات بشان تبني نتائج البحث في حقل .التخطيط وادارة المشاريع كما وضعت عدد من المقترحات لبحوث الحقة ذات صمة بموضوع البحث
ACKNOWLEDGEMENTS I would like to express my thanks and gratitude to my supervision Assist. Prof. Dr. Sawsan Rasheed Mohammad, for her great efforts and guidance throughout the preparation of this research. I would also like to dedicate my special thanks to staff in the department of Civil Engineering (University of Baghdad) for their assistance to me throughout my years of study. My thanks extend also to all my mother, family , fiancée ,colleagues, and friends who never hesitated in supporting, encouraging and helping me with their full patience and endurance to fulfill this work.
viii
ABSTRACT
Resource allocation and leveling are of the top challenges in project management, due to the complexity of projects. This research aims to develop an optimization model for resource smoothing, resource smoothing attempts to reduce peak requirements and smooth out period to period in resource assignment without changing project duration. The objective of resource leveling procedures is to schedule project activities so that. The proposed model is formulated using C++ program for resource smoothing. The project management software MS-Projects is adopted hereto perform resource leveling to facilitate achieving the optimal solution. The proposed model utilizes a system that depends on Genetic Algorithms (GAs) procedure built in C++ program to find the optimum solution. This research reach concludes that it is possible to smooth resources using Genetic Algorithms program and compares then with MS-Project when the GA results are better than MS-Project because of the moment of resources (Mx), no. of changes, no. of peak and highest peak are less in GAs. Three case studies have been applied in this research and the application results come identical with research objectives, to form the conclusion. The first and second case study are hypothetical while the third case study is real which is a building consists of three floors where Mx = 3625, the highest peak = 24, no. of peak and no. of changes = 4 from Ms project results while Mx = 3465, the highest peak = 21, no. of peak and no. of changes = 3 from GA results. ix
Then comes the recommendations regarding adopting and using the research results in construction planning and project management. Further suggestions related to the research subject are proposed for future works.
x
LIST OF CONTENTS Title
Page No.
Acknowledgements
i
Abstract
ii
List of Contents
iv
List of Tables
viii
List of Figures
ix
List of Abbreviations
xi
Chapter One Introduction and Review of Previous Researches 1-1 Introduction
1
1-2 Research Objective and Justification
2
1-3 Research Methodology
2
1-4 Structure of the Thesis
3
1-5 Review of Previous Researches
4
1-5-1 Resource Allocation and Resource Leveling
4
1-5-2 Genetic Algorithms
6
Chapter Two Construction Project Scheduling and Optimization 2-1 Introduction
8
2-2 Scheduling Definition
8
2-3 Scheduling Objectives
8
2-4 Factors Affecting the Selection of Scheduling Method
9
2-5 Scheduling Techniques
10
2-5-1 Gantt Chart (Bar Chart)
10
2-5-2 Network Analysis
11
xi
Title
Page No.
2-5-3 Program Evolution and Review Technique (PERT)
12
2-5-4 Line of Balance
12
2-6 Optimization Scheduling Methods (Models)
13
2-6-1 Linear Programming Model
14
2-6-2 Simulation Model
14
2-6-3 Monte Carlo Simulation
14
2-6-4 Genetic Algorithms Techniques
15
2-7 Resource Allocation
15
2-8 Resource Smoothing
16
Chapter Three Genetic Algorithm Technique 3-1 Introduction
20
3-2 Genetic Algorithms Definitions
20
3-3 Genetic Algorithms Description
20
3-4 Goals of Optimization
22
3-5 The Work of GAs
23
3-6 Steps of GA System
24
3-6-1 Encoding the Application of GA
24
3-6-2 Generation an Initial Population Chromosomes
25
3-6-3
Deciding
the
Chromosome
(Objective Function)
Evolution
Criterion
26
3-6-4 Selection
26
3-6-5 Crossover
26
3-6-6 Mutation
27
3-7 Parameters of GAs
28
3-8 Genetic Algorithm Applications
29
xii
Title
Page No.
3-9 Benefits of GAs in Construction
29
3-10 Computer Implementation
30
3-11 Applicability of GA to Resource Leveling
30
Chapter Four Proposed Resource Smoothing System 4-1 Introduction
36
4-2 Input Project Activity Information in MS-Project
38
4-3 Resource Database Sheets
38
4-3-1 Labour Sheet
39
4-3-2 Equipment Sheet
39
4-3-3 Materials Sheet
40
4-4 Importing MS-Project Information
40
4-5 Optimization Process
40
4-5-1 Optimization Using C++
41
4-5-2 Inheritance
41
4-5-3 Improving Resource Smoothing Using C++
42
4-6 Minimizing Resource Moments
43
4-8 Opening and Using C++
45
Chapter Five Model Application and Evaluation 5-1 Introduction
47
5-2 Case Study1 of 7 activity (Description and Data)
47
5-3 Resource Smoothing Manual Solution
52
5-4 Performing Optimization Process
53
5-5 Performing Resource Smoothing
54
5-6 Case Study2 of 15 activity
57
xiii
Title
Page No.
5-7 Conclusion
61
Chapter Six Conclusions and Recommendations 6-1 Introduction
62
6-2 Conclusions
62
6-3 Recommendations
63
6-4 Proposals for Future Studies
63
References
65
Appendix
xiv
LIST OF TABLES Table No.
Title
Page No.
5-1
Case Study Data
47
5-2
Activity Information Before Smoothing
51
5-3 5-4 5-5
Activity Information After Smoothing in MS-Project Activity Information After Rescheduling Activity Information of Resource Smoothing in GA
51 53 54
5-6
Activity Information
57
A-1
Activity Information of Real Case Study
D
A-2
Users Input for GAs
H
A-3
GAs Process Control
I
A-4
Running GAs
K
A-5
Results Presentation
O
xv
LIST OF FIGURES Figure No.
Title
Page No.
3-1
Basic Cycle of GA Operations
24
3-2
Chromosome Structure
25
3-3
Crossover
27
3-4
Some Examples of Mutation in GA
27
3-5
Iterative Procedure for Improving Resources Allocation Heuristic
33
3-6
Chromosome Formation
34
3-7
Genetic Algorithm Procedure
35
4-1
Process Chart Diagram of the Proposed Model
37
4-2
CPM Scheduling Screen
38
4-3
Labour Sheet
39
4-4
Equipment Sheet
39
4-5
Materials Sheet
40
4-6
Optimization Process Chart of the Resource Smoothing
44
4-7
Operating C++
45
4-8
GA Input Screen
46
5-1
AON Network of 7 Activity Project
48
5-2
Bar Chart of 7 Activity Project
48
5-3
Resource Histogram Before Smoothing
49
5-4
Resource Histogram After Smoothing
50
5-5
Resource Histogram After Rescheduling
52
xvi
Figure No.
Title
Page No.
5-6
Bar Chart of 7 Activity After Smoothing in GA
55
5-7
Resource Histogram After Smoothing from GA Results
55
5-8
GA Output Screen
56
5-9
Resource Histogram Before Smoothing
58
5-10
5-11
Resource Histogram After Smoothing from MS- Project Results Resource Histogram After Smoothing from GA Results
59
60
A-1
Bar Chart of Building
A
A-2
Labour Sheet
C
A-3
Equipment Sheet
D
A-4
Resource Histogram from MS- Project Results
F
A-5
Resource Histogram from the Proposed Model
G
xvii
LIST OF ABBREVIATIONS Abbreviation
Description
GAs
Genetic Algorithms
CPM
Critical Path Method
RSM
Repetitive Scheduling Method
QC
Quality Control
ES
Early Start
LS
Late Start
TF
Total Float
AOA
Activity On Arrow
AON
Activity On Node
LOB
Line Of Balance
ELS
Earliest Late Start
LTF
Least Total Float
MX
Moment of Resource
PC
Crossover Probability
PM
Mutation Probability
MS
Microsoft
R
Resources
RS
Resource Smoothing
PDM
Precedence Diagram Method
CHAPTER ONE
xviii
INTRODUCTION AND REVIEW OF PREVIOUS RESEARCHES 1-1 Introduction Resource allocation and leveling have been dealt with as two distinct subproblems solved mainly using heuristic procedures that cannot guarantee optimum solutions. In this research, improvements are proposed to resource smoothing and leveling heuristics, and the Genetic Algorithms (GAs) technique is used to search for near-optimum solution. In practice, basic Program Evaluation and Review Technique (PERT) and Critical Path Method (CPM) scheduling techniques have proven to be helpful only when the project deadline is not fixed and the resources are not constrained by either availability or time. Since this is not practical even for small-sized projects, several techniques have been used to modify CPM results in account of practical considerations[1]. In dealing with project resources, two main types of techniques have been used: resource allocation and resource leveling. Resource allocation (sometimes referred to as Constrained-Resource Scheduling) attempts to schedule the project tasks so that a limited number of resources can be efficiently utilized while keeping the unavoidable extension of the project to a minimum. Resource leveling (often referred to as resource smoothing), on the other hand, attempts to reduce the sharp variations among the peaks and valleys in the resource demand histogram while maintaining the original project duration. These techniques, as such, deal with two distinct subproblems that can only be applied to a project one after the other rather than simultaneously. Accordingly, they are not guaranteed [2]. xix
In this research, an attempts is made to develop a practical procedure that seeks a near-optimum solution to resource allocation and leveling.
1-2 Research Objective and Justification The main objective of this research is to introduce alternative approach of using Genetic Algorithm for Resource Smoothing. This objective is to be justified through the following procedures: a. Gathering background information by reviewing the previous studies related to the project scheduling techniques and optimization tools; b. exploring the applications of GAs in Civil Engineering field; c. extending the capabilities of MS- Project Resource Leveling; d. using genetic algorithms as a resource smoothing optimization technique to provide optimal solutions; e. implementing of the developed optimal resource leveling model to examine its applicability and effectiveness; and f. evaluating the performance of the GA model through comparing the results of the GA model with other traditional methods described in the literature.
1-3 Research Methodology The research methodology is adopted through the following element of research.
1. Literature Survey: which is to review the development of the construction planning process, resource allocation and resource
xx
smoothing, the concept of the GA, types, structures, development and applications in civil engineering field, as reviewed through references, thesis, papers, books and web-sites related to the subject of research especially those related to construction industry. 2. GA which is the desired planning tool as the research assumes, is introduced and the reasons behind choosing it are explained. Then the research reviewes many of the existing GAs and chooses the most powerful one, which is believed to fulfill the requirements of the suitable resource smoothing. 3. A hypothesis project is defined and broken down into its activities. A bar chart, CPM network, resource allocation and smoothing are obtained from MS- Project. 4. GAs has been programmed to be adopted as a guide for the resource smoothing. 5. Evaluation and utilization of the proposed system: Evaluation of the proposed system is based on the compares between its results and MS-Project results, evolutionary interviews, etc. which are aimed to critical examination of the proposed developments for the purpose of further enhancement and refinement to serve the process of the resource smoothing.
1-4 Structure of the Thesis The Research consists of the following chapters: - Chapter One: Introduction and Review of Previous Research. This chapter gives an introduction, research methodology, research objectives and previous researches on resource leveling and genetic algorithms. xxi
-
Chapter Two: Construction Project Scheduling and Optimization. This chapter contains scheduling definitions, objectives, technique
and resource allocation and smoothing. -
Chapter Three: Genetic Algorithm Technique. This chapter describes the work of GA, parameters, applications and
applicability of GA to resource leveling. - Chapter Four: Proposed Resource Smoothing System. This chapter presents a description of the proposed model designed to perform resource smoothing. - Chapter Five: Model Application and Evaluation. This chapter explains the application of the proposed model in two case studies. - Chapter Six: Conclusions and Recommendations. The research conclusions, recommendations, proposal for further studies are presented in this chapter.
1-5 Review of Previous Researches 1-5-1 Resources Allocation and Resource Leveling Abraham and Mattila (1998) have used the vehicle of highway construction project to present an integer linear programming formulation to level the resources of linear projects. This research has indicated that critical path method (CPM) is ineffective for linear construction projects and are typified by activities that must be repeated in different locations such as highways, pipe lines, and tunnels.[3] Harris (1998) has described the repetitive scheduling method (RSM) and recognized the technical constraints of (CPM) and also an addition xxii
(resource continuity constraint to ensure continuous resource usage. RSM is a scheduling methodology that simplifies and generalizes various multiunit scheduling procedures previously proposed by authors and it is known by a number of different names. [4] Sou-sen (2001) has proposed an optimal repetitive scheduling model for precast production with the consideration of resource constraints and resource sharing. A repetitive schedule, like precast production, needs to take into consideration the impact of limited resource, including equipment (such as cranes and forms) and skilled labour, on production makes pan. A genetic algorithm-based searching technique is adopted to establish an optimal resource-constrained repetitive precast production scheduling system with the consideration of resource sharing.[5] Punk and Bijebdra (2004) have developed the problem of allocating resource to the different Quality Control QC stages, such that the optimal quality is obtained. They proposed a model for the cost of QC process and then view the resource allocation among different QC stages as an optimization problem and solved this optimization problem using non-linear optimization technique of sequential (Quadratic programming) and they have also given examples to show how a sub-optimal resource allocation can either increase the resource requirement or decrease it.[6] Chandy and Liang (2005) have considered resource allocation algorithms for processing streams of events on computational grids and they proposed two scheduling, resource allocation algorithms for processing, streams on computational grids to optimize economic value; one uses a centralized market and other decentralized markets.[7] Agrwal and Liang Chen (2005) have published the problem of resource allocation in the Grid-based Adaptive Execution on Streams xxiii
(GATES) system. They have presented a resource allocation algorithms that is based on minimal spamming trees. They have also evaluated the algorithm experimentally and demonstrated that it results in configurations that are very close to be optimal.[8]
1-5-2 Genetic Algorithms Hegazy (1999) has developed a genetic Algorithms program for optimization construction time cost tradd off analysis. The procedure is implemented using Microsoft Project (MS software) using its macro programming language (Visual Basic for applications). The genetic algorithms model minimizes the total project cost as an objective function.[9] Hegazy (1999) has published a paper in which improvements are proposed to resource allocation and smoothing heuristic and the genetic algorithms (GAS technique is used to find the optimum solution). One major advantage of the procedure is its simple applicability in MS-Project software to improve its performance.[10] Sou-Sen Lue and Yang (1999) have published a model that can effectively provide the optimal combination of construction durations, resource amounts, minimum direct project costs, and minimum project duration under the constraint of limited resources. A searching technique using genetic algorithms (GAS) is adopted in the model.[11] Naoum and Haidar (1999) have described a research undertaken in the South Bank University that has investigated the feasibility of applying artificial intelligence methodologies to the optimization of excavating, and haulage operations and the utilization of equipment in opencast mining. That research has been directed into the development of decision support system xxiv
(Xpert Rule) for the selection of the opencast mine equipment(XSone) which is designed using a hybrid knowledge-base system and genetic algorithms. The system is tested on four case studies to validate its accuracy.[12] Erashin (2001) has presented a practical approach for the modeling and optimization of construction time schedule considering cost and resources. Genetic algorithms are used to locate the globally optimal solution and the Resources are defined in the model without limitations.[13] Saad H. Al-Jiboury and Michael J. (2002) have described the general site layout problem from both a theoretical and a practical point of view. They have proposed genetic algorithms as a possible solution technique and includes a theoretical example of positioning facilities.[14] Snow (2005) has introduced the basics of genetic algorithms and developed one for drawing Hasse diagrams of ordered sets. The structure of a snall set with an order relation can often be completely described by drawing a diagram called a Hasse diagram.[15]
CHAPTER TWO
CONSTRUCTION PROJECT SCHEDULING AND OPTIMIZATION 2-1 Introduction This chapter presents a review of the existing Scheduling techniques and includes a discussion of resource allocation and resource smoothing. The optimization scheduling method is also described in this chapter.
xxv
2-2 Scheduling Definition Scheduling deals with time order in which project activities are to take place, and also the manpower, material machinery and money (the 4m’s) required at every stage of production that should be shown in the scheduling. [16] Schedule development means determining the start and finish dates for project activities. If the start and finish dates are not realistic, the project is unlikely to be finished as schedule. The schedule development process must be iterated (along with processes that provide inputs, especially duration estimating and cost estimating) prior to the determination of the project schedule. [17]
2-3 Scheduling Objectives The basic objectives of the scheduling process are as follows:[20] a. To find out how long the total project duration is. Timely completion of the project is particularly important when fails to complete within the time required by contract that carries a financial penalty or liquidated damages; b. evaluating the early and late times at which activities start and finish. c. Identifying the group of critical activities so that special care is taken to make sure they are not delayed; d. since the construction environment is always exposed to constraints and changes, it is important to be able to evaluate the implications of changes in start and/or finish times of activities on the overall project duration;
xxvi
e. the follow up execution of the project; f. to monitor the usage of Resources; g. to Expect the stoppage in the execution and reasons behind; h. to prepare the financial requirements and cost control of work;and i. to control the sub-contractors work and their interference.
2-4 Factors Affecting the Selection of Scheduling Method There are certain factors that affect the selection of the method of scheduling, that can briefed as follows: a. The availability of the resources. b. Importance of the project itself. c. Availability of financial support. d. Type of the operation in the project. e. Data available for planning from project resources.
xxvii
2-5 Scheduling Techniques There are many types of schedules which can be used for many construction project. The choice of which type of planning to be used depends on the characteristics of each project. Several tools and techniques assist in the planning development process.
2-5-1 Gantt Chart (Bar Chart) Gantt chart is a common tool for displaying project schedule information. It lists various activities involved in a construction job and the period of time during which each activity is planned to take place; it is indicated in the form of a horizontal bar plotted to a suitable time scale against activity. [18] Bar chart or Gantt chart is the simplest form that has been used for decades, named after the person who first used it; a Gantt chart is plotted using either early or late activity times. The early Gantt chart is drawn using the early start ES times of activities, while the late Gantt chart is drawn using the late start LS times. The Chart shows the following interesting details: [19] a. Float times of activities, thus informing practitioners the range of permissible changes to the schedule. b. Critical activities which can be shown in a different colour or pattern. c. The actual progress of the various activities which can be plotted and compared to its scheduled time via actual bar plotted at the bottom. d. Total daily resources which can be accumulated by Gantt chart.
xxviii
The totaling of the resources required for each activity is called resources aggregation, and The requirement of labour and equipment can be worked out from a bar chart very easily. So, The bar chart, though very helpful and popular for small projects, has got the following inherent limitations: [18] a. It does not depict the inter-relationship among the activities showing their interdependence. b. It does not consider the cost since it is a project controlling method which considers only time.
2-5-2 Network Analysis Network analysis embraces a set of logical and mathematical models that can be represented graphically in the form of a network. This network is really a project graph and a means of representing a plan so that it displays clearly the series of operations, which must be followed in order to complete the project. There are two types of Network Scheduling AOA and AON. The network scheduling process follows the critical path method (CPM) technique. In AOA networks, traditional CPM is used, and in AON networks, CPM with slight modifications (referred to as precedence diagram method PDM is used. The main factors affecting successful CPM scheduling are as follows: [18] a. Realistic estimation of the productivity of crews and adoption of a representative value for job-management efficiency factor. This factor can range from 50 to 90% of ideal productivity.
xxix
b. Inclusion of sufficient time buffers between dissimilar activities, this is to simulate actual field conditions which indicate delay in startup of new activities.
2-5-3 Program Evaluation and Review Technique PERT Program evaluation and review technique (PERT) uses sequential network logic and a weighted average duration estimate to calculate project duration. PERT differs from CPM primarily in that it uses the distributions mean (Expected Value) instead of the most likely estimated originally used in CPM. [17] The objective of this approach is to evaluate the risk in meeting the time goals of the execution of projects whose activities has some uncertainty in their duration estimates. [24] PERT is preferred when there are some uncertainties in the choice of methodology, availability of Materials, and the final answer which is not clearly known. On the other hand, CPM is applied when things are almost certain. PERT recognizes uncertainty using three time estimates which are reduced to one time estimate that is the expected time (et) for calculating critical path. [16]
2-5-4 Line of Balance Line of Balance is a technique for scheduling linear projects that involve a recognizable number of repetitive activities. Linear projects either involve several uniform units of work such as multiple houses or being geometrically linear such as highway, and pipelines. The objectives of the LOB technique are: [20]
xxx
a. It determines a balanced mix of resources and synchronize their work so that they are fully employed and not interrupted. b. It is possible to benefit from repetition, and the crews will likely be able to spend less time and money on later units once they develop a learning momentum. c. It is interesting representation of the schedule, giving the large amount of data for the repetitive units. This approach responds to some of the drawbacks of traditional project scheduling including: a. Excessive contingency-typically activity durations are estimated with a large safety factor. The large safety gives a false feeling of security and leads to late starts. b. No reward for early finishes—traditional method rarely reward early finishes. If a task is finished each, successor tasks might not be able to start earlier than originally planned [21].
2-6 Optimization Scheduling Methods (Models) Modeling can be defined as the process of producing a model; model is a representation of the construction and working of some system of interest. [22] Modeling is one of the most powerful tools that have ever been employed in various research disciplines. Often it’s the typical way and some times the only way to conduct experiments on a wide range of systems of various types.
xxxi
2-6-1 Linear Programming Model Linear programming is mathematical technique used to determine a level of operational activity in order to achieve an objective subject to restrictions. These constraints can be limited resources, such as time, labor, energy, materials and money. [23]
2-6-2 Simulation Model Simulation can be defined as the process of designing a model of a real system and conducting experiments with this model for the purpose of understanding the behavior of the system and/ or evaluating various for the operation of the system. [46]
2-6-3 Monte Carlo Simulation Monte Carlo Simulation for Project risk assessment was introduced in an effort to overcome the limitations of PERT. The method basically uses randomly generated numbers to determine possible activity duration. The technique essentially generates various scenarios associated with the Project each involving a random set of durations for the project activities. Each of these scenarios is then used to produce a CPM-type deterministic schedule. To generate the random project scenarios, the Monte Carlo Simulation technique requires information about the duration of activities and their distributions, including discrete values. It requires numerous calculations. The number of activity duration sets may vary from 40 to 1000. The outcome of the technique is an estimate of expected time and variance of project completion time. [46]
xxxii
2-6-4 Genetic Algorithms Techniques GAs are optimization search procedures inspired by the biological systems improved fitness through evolution. GAs employ a random yet directed search for locating the globally optimal solution.
2-7 Resource Allocation Basic PERT and PERT scheduling techniques have proven helpful only when the project deadline is not fixed and resources are not constrained by their availability or time. Since this is not practical even for small sized projects, Resource allocation and resource smoothing have been used to modify CPM results in account of practical considerations. Resource Allocation (sometimes referred to as constrained Resource Scheduling) attempts to reschedule the project tasks so that a limited number of resources can be efficiently utilized while keeping the unavoidable extension of the project to a minimum [25]. Shortage of resources is a major challenge for construction projects. scheduling under the following resources constraints becomes a complex problem particularly when more than one resource is limited. These Resource Constraints are: a. Number of skilled labour is limited. b. Expensive equipment is shared among several projects. c. Material quantity is limited and/or a limited space is available for storage. A Resource conflict occurs when, at any point in the schedule, several activities run in parallel and the total amount of the required resources exceeds the availability.
xxxiii
Linear Programming was the first proposed method for solving resource allocation problems since the 1960S. Various models have been developed, they were as curtained as feasible approaches only for small unrealistic problems. It is shown that a 55-activity project with four types of resources would generate 1600 variables that, in turn, would require more than 6000 equations to produce a solution. [20] Alternatively, heuristic approaches have been proposed for solving the resource allocation problem. These approaches apply selected heuristic rules that are based on activity characteristics, such as the least total float (LTF) rule to prioritize the activities that compete for the limited resource. The scheduling process, such as, starts from the projects start time, identifies eligible activities according to the network logic and resolve the over requirements of resources using the selected set of heuristic rules. The process, such as, ensure relationships or the resource constraint. [26] Another heuristic rule, which is effective and commonly used, is the earliest late start (ELS) rules are advantageous compared to the (LTF) rules. This is because the value of the late start derived from the original CPM calculations, unlike the total float values, need not be changed every time an activity is rescheduled due to insufficient resource availability. As such, the ELS rule can be applied with much less computational effort than the LTF rule. But LTF discovered statistically is included to generate shorter project duration. All heuristic rules have the advantage of being simple and easy to apply and can be used for large size projects. [27]
2-8 Resource Smoothing Resource smoothing attempts to reduce peak requirements and smooth out period-to-period fluctuations in resource assignment without changing xxxiv
project duration. The objective of resource leveling procedures is to schedule project activities so that the project duration does not exceed a specific limit and the variation in the projects demand for a resource from one time period to another is held to a minimum. [24] The problem of resource fluctuation appears after the initial CPM or PD analysis is conducted and a bar chart is drawn. The peak demand and fluctuations of resources are undesirable for the contractor because they can cause the following problems: [28] a. It is expensive to hire labour on a short term basis to satisfy fluctuating Resource requirements. b. Resources can not be managed efficiently, if the schedule demands resources per time unit more than possible with availability. The project managers' objective to hire the minimum number of resources, to reduce resource fluctuation and to ensure better utilization of resources. Typical situations include full utilization of a rented piece of equipment that needs to be returned early, also reducing the number of skilled workers who need to be hired for the job. Project managers have desired resource profiles that they try to get their resource profiles to match. Mathematical Programming has been used to obtain optimal solutions for resources smoothing problem. Optimal solutions that use mathematical programming such as the simplex method could only work for small sized construction projects heuristic algorithms based on rules of thumb and experience are therefore needed. [24] A well-known heuristic algorithm is the minimum moment algorithm that assumes limited project duration and unlimited resources [29]. The objective in this algorithm is to minimize daily fluctuations in resource use while keeping the total project duration unchanged. As a proxy to this xxxv
objective the Algorithm minimizes the moment of the resource histogram around the horizontal axis. [30] The moment Mx is calculated by summing the daily moments as follows: [41] Mx = ∑ [1*Resource Demandi)*1/2Resource Demand1] Mx = 1/2 ∑ (Resource Demandi)2
….(1)
Where n is the working day number of the projects finish date. Equation – to be a minimum becomes: Mx = ∑ (Resource Demandi)2
….(2)
To accomplish this objective, the algorithm starts from an early start schedule and shifts non critical activities within their float times so as to cause no project delay. At each time step the shift that yields the maximum reduction in the histogram moment is selected. [30] The Minimum Moment (Mx) method does not take into consideration the resource utilization period [10]. The latter is very important to minimize, particularly for equipment resources that are started among projects or rented sources. The single Moment Mx, therefore, is not considered for the extended assignment of the resource. To overcome that, the moment (My) (around the vertical axis) is computed as follows: My = ∑ [(1*Resource Demandi)*i]
….(3)
Accordingly, (My) can be used as a good indicator of the resource release date in the project. Also a simple modification to Equation 3 can be used to calculate the moment (My) around Y-axis that corresponds to the first day the resource is employed in the project.
xxxvi
The value of (My) represents the resource utilization period, irrespective of when the resource is employed or released as follows. [17] My = ∑ [(1*Resource Demandi)*(i-J)]
….(4)
CHAPTER THREE
GENETIC ALGORITHM TECHNIQUE 3-1 Introduction This chapter introduces Genetic Algorithm (GA) concept as a nontraditional optimization technique and its applicability to obtain optimal solutions to construction management problems. This chapter handles in detail the applicability of genetic algorithms to resource leveling as a tool to optimize schedule individually.
3-2 Genetic Algorithms Definitions Genetic Algorithms (GAs) are search procedures that combine an artificial survival of the fittest strategy with genetic operators abstracted from nature [35]. GAs are optimization search procedures inspired by the biological system improved fitness through evolution. GAs employ a random yet directed search for locating the globally optimal solution. [36] Recently, GAs have been successfully adopted to solve many science and engineering problems especially in construction management searching problems. [37]
3-3 Genetic Algorithms Description xxxvii
Genetic Algorithms are search algorithms based on the mechanics of natural selection and natural genetics. They combine survival of the fittest among string structures with a structured yet randomized information exchange to form a search algorithm with some of the innovative flair of human search. In every generation, a new set of artificial creatures (strings) is created using bits and pieces of the fittest of the old; an occasional new part is tried for good measure. While randomized, genetic algorithms are no simple random walk. They efficiently exploit historical information to speculate on new search points with expected improved performance. Genetic Algorithms have been developed by John Holland, and his colleagues, and his students at the University of Michigan. The goals of their research have been twofold: (1) to abstract and rigorously explain the adaptive processes of natural systems, and (2) to design artificial systems software that retains the important mechanisms of natural systems. This approach has led to important discoveries in both natural and artificial systems science. [31] The central theme of research on genetic algorithms has been robustness, the balance between efficiency and efficacy necessary for survival in many different environments. The implications of robustness for artificial systems are manifold. If artificial systems can be made more robust, costly redesigns can be reduced or eliminated. If the higher levels of adaptation can be achieved, existing systems can perform their functions longer and better. Designers of artificial systems – both Software and hardware, whether Engineering Systems, Computer systems, or Business systems – can only marvel at the robustness, the efficiency, and the flexibility of biological systems. Features for self-repair, self-guidance, and
xxxviii
reproduction are the rule in Biological systems, whereas they barely exist in most sophisticated artificial systems. Thus, there comes an interesting conclusion: where robust performance is desired (and where is it not?), nature does it better; the secrets of adaptation and survival are best learned from the careful study of biological example. Yet it doesn’t accept the genetic algorithm method by appeal to this beauty-of-nature argument alone. Genetic Algorithms are theoretically and empirically proven to provide robust search in complex spaces. The primary monograph on the topic is Holland’s (1975) Adaptation in Natural and Artificial Systems. Many thesis’s and dissertations establish the validity of the technique in function optimization and control applications. Having been established as a valid approach to problems requiring efficient search, Genetic Algorithms are now finding more widespread application in Business, Scientific, and Engineering circles. The reasons behind the growing numbers of applications are clear. These algorithms are computationally simple yet powerful in their improvement. Furthermore, they are not fundamentally limited by restrictive assumptions about the search space (assumptions concerning continuity, existence of derivatives, unimodality, and other matters). It will be investigated the reasons behind these attractive qualities; but before this, it will be need to explore the robustness of more widely accepted search procedures.
3-4 Goals of Optimization Optimization seeks to improve performance toward some optimal point or points. This definition has two parts: (1) seeking improvement to approach some (2) optimal point. There is a clear distinction between the process of improvement and the destination or optimum itself. Yet, in xxxix
judging optimization procedures the focus commonly goes solely upon convergence (does the method reach the optimum?) and forgets entirely about interim performance. This emphasis stems from the origins of optimization in the calculus. It is not, however, a natural emphasis. [33] A decision maker for example, a businessman. How does it have judged his decisions? What criteria do its use to decide whether he has done a good or bad job? Usually its say he has done well when he makes adequate selections within the time and resources allotted. Goodness is judged relative to his competition. Does he produce a better widget? Does he get it to market more efficiently? With better promotion? It’s never judged a businessman by an attainment-of-the-best criterion; perfection is all too stern a taskmaster. As result, it’s concluded that convergence to the best is not an issue in business or in most walks of life; it’s only concerned with doing better relative to others. Thus, if wanted more humanlike Optimization tools, its led to a reordering of the priorities of Optimization. The most important goal of Optimization is improvement. Can get some good, ―satisficing‖ level of performance quickly? Attainment of the optimum is much less important for complex systems. It would be nice to perfect: meanwhile, it could be only strive to improve.
3-5 The Work of GAs GAs work with a family of solutions, known as the "current population" from which the "next generation" of solutions is obtained, better solutions from one generation to the next are progressively obtained [38]. GAs procedure begins by generating an initial collection (referred to as population) of random solutions that are encoded in the form of strings called Chromosomes. xl
Each individual Chromosome represents one solution that is better or worse than others in the population. The fitness of each solution is determined by evaluating its performance with respect to an objective function. To stimulated the natural survival of the fittest process, best Chromosomes (potential solutions) exchange information to produce offspring that are evaluated and can replace less fir members in the population. Usually, these solutions replace unfit solutions), until criterion is met (e.g. one solution becomes satisfactory). At the end of the process, the member of the population with the best performance becomes the optimum solution [9]. Figure (3-1) illustrates the basic cycle of genetic algorithm operations.
New Population
Initial Population
Mutation
Selection
Crossover
Figure (3-1) Basic Cycle of GA Operations [9]
3-6 Steps of Genetic Algorithm System The following points illustrate the principle work of genetic algorithm:
xli
3-6-1 Encoding the Application of GA GAs require a representation scheme to encode feasible solutions to the Optimization problem. Each Chromosome represents one member, i.e., one solution, which is better or worse than other members in a population. A Chromosome represents a sequence of genes that require Optimization. There are two basic chromosome formats in GAs, a. Binary Coding. b. Ordinary Coding. Figure (3-2) illustrates the Ordinary Coding: [39]
1
2
3
3
10
22
4
5 14
6 5
P 9
4
Legend: X
Gene position
Y
Gene Value
Figure (3-2) Chromosome Structure [39]
3-6-2 Generating an Initial Population of Chromosomes The process of genetic algorithms starts with a randomly created first generation of population. Every individual in a generation represents one solution and consists of one Chromosome with a number of genes. [40]
xlii
xliii
3-6-3 Deciding the Chromosome Evolution Criterion (Objective Function) The performance of the strings is often called fitness, and the fitness of each string (Chromosome) in the population is evaluated with respect to an Objective Function and accordingly its relative merit is calculated as the Chromosome's fitness divided by the total fitness of all Chromosomes. 3-6-4 Selection A pair of parent Chromosome from the current population is selected. Each of the two parent Chromosomes is randomly selected in a manner such that its probability of being selected is proportional to its relative merit. The aim is to give good individuals (solution) with a higher chance of passing their Chromosomes to the next generation than the bad ones [41]. The same Chromosome could be selected more than once to become a parent.
3-6-5 Crossover Crossover is the process of combing the chromosomes of two potentially good solutions to form two offsprings [42]. Crossover is performed by randomly selecting two members from the Population and exchanging their chromosomal information. Crossover occurs only with some probability (Pc), and when solutions are not subject to Crossover they remain unmodified. It is stated that the power of GAs arises from Crossover where a randomized exchange of genetic material is executed with a possibility that (good) solutions can generate (better) ones. [36] Figure (3-3) illustrates that two Chromosomes (parents 1 and 2) are randomly selected and broken at a random point (at gen 5), and after the exchange at genetic material two new Chromosomes (Offspring 1 and 2) are generated. xliv
A1
A2
A3
A4
A6
A5
A7
A8
A9
A10
Parent 1 B1
A1
B1
B2
A2
B3
A3
B2
B4
A4
B3
B4
B6
B5
B7
B8
B9
B10
A5
B6
B7
B8
B9
B10
Offspring 1
B5
A6
A7
A8
A9
A10
Offspring 2
Parent 2
Figure (3-3) Crossover [42]
3-6-6 Mutation Mutation is a rare process that resembles the process of a sudden generation of an odd offspring that turns out to be a genius. This can be done by randomly selecting one Chromosome from the population and then randomly changing some of its information. The benefit of the mutation process is that it can break any stagnation in the evolutionary process and avoid sub optimal solutions. Figure (3-4) displays some forms of mutation [36]. In this figure characters have mutation operation. 1100110101
100111101
ABDACE
GBDANE
4 5 1 8 11 1 7 3
4 20 1 8 2 1 7 3
Figure (3-4) Some Examples of Mutation in GA [36]
xlv
Once, on offspring is generated by either method, it is evaluated in turn and can be retained only if its fitness is higher than others in the population. Usually, the process is continued for a large number of Offspring generations until an Optimum Chromosome is arrived at.
3-7 Parameters of GAs To implement GAs, its Parameters must be set having: [35] a. Population Size: is the number of population to be generated randomly. Population size is an important factor that affects the solution and processing time it takes. Large Population size (in the order of hundreds) increases the likelihood of obtaining a Global Optimum solution, however, it substantially increases processing time. b. Chromosome Length: A solution is represented as a linear string called a Chromosome whose length varies with each application. c. Crossover Probability (Pc): A rate to perform Crossover between any pairs of two selected Chromosomes (strings). Pc is real number from 0 to 1. [44] d. Mutation Probability (Pm): A rate to randomly alter one or more genes of a selected string (Pm) is real number from 0 to 0.1 and the mostly used values of mutation probability are from 0.001 to 0.1. [44] e. Stopping Criteria: There are two types of stopping criteria included in GAs. The first one is in state of meaning the value of objective function, and the second is the number of Offspring generations. The two types above can be used as a termination criterion for the GA process. [9]
xlvi
3-8 Genetic Algorithms Applications Successful application of GAs was applied in Resource Plans, structural design, Resource Allocation and Transportation. [36] GAs are different from traditional Optimization methods in the following aspects: a. Genetic Algorithms operate with a coding of the Parameter set, not the Parameters themselves. b. They search for a Population of solutions rather than improving a single solution, the idea is to efficiently find a solution to a problem in a large of candidate solutions. c. They use objective function information, not derivatives or another auxiliary knowledge.
3-9 Benefits of GAs in Construction GAs are particularly suited for Optimization problems in Construction Scheduling because: a. They do not experience combinatorial explosion: [43] GAs perform well on problems whose complexity increases exponentially with the number of input Parameters. Such problems are called NP-Complete. The Resource Leveling problem could be defined as a (NP-Complete) problem. That is computational time which grows exponentially as the size of the problem increases. [28] b. They are Robust: GA has the feature of robustness because of its ability to evaluate many possible solutions simultaneously and use the Chromosome fitness to direct the search.
xlvii
3-10 Computer Implementation GAs procedure can be implemented on a Visual C++ Program. C++ is more faster than any Programming languages to reach the Optimal solution because it is deeply treat with computer and upon of this feature it is object oriented. Instructions of it must be supposed by using the inscription # include this meant that our program included this library (86 lib. at C++) and use some of this Functions to implement the program, after declare every thing to the compiler to deals with it seriously and then have the main program, (void main) this lead to manage the program and then enter all of variables to deal with it (about our program). Every function it will be used in void main we must build its body to be verified to main program and this style of programming is more rigidly and more sophisticated to implement our problem and solve it this version of programming is nominated by Modulating i.e. any function work like module and the results some of modules and the final form of main program is modularity. [45]
3-11 Applicability of Genetic Algorithms to Resource Leveling An Optimization model for resource allocation and resource smoothing problems in construction project using genetic algorithms was developed in 1996 [25]. The objectives of the model are to assign multiple resources to activities of a project using a serial mode of allocation with the objectives of minimizing: a. The difference between resource availability and utilization. b. The project Duration subjected to resource constraint.
xlviii
The model performs scheduling by determining the optimal order of activities with each gene in the chromosome representing the scheduling priority and delay in the start time of each activity. Applying genetic algorithms to scheduling problems presents the challenge of not violating the schedule precedence logic among the activities due to Genetic Algorithms procedures, such as the crossover operation. A commercially available GA package was used to construct valid schedule in accordance with constraints of the application. The scheduling approach maintains the logic of the schedule precedence during the process of the optimization by the virtue of predefined hard and soft constraints stated as follows: a. Hard Constraints: These Constraints can never be violated or relaxed at any cost. Precedence relationships between project activities are prime examples of hard constraints. b. Soft constraints: These Constraints can be relaxed to a certain extent but with a penalty on performance. The model treats project duration and Resource availability as soft constraints. [46] An Optimization model was developed in 1999 considering resource allocation and resource smoothing simultaneously [10]. The model performs a multi objective optimization that searches for an optimal combination of activities priorities resulting in a shorter project duration and smoother resource profiles. The minimum resource moment algorithm developed by Harris (1978) was improved using both Mx and My resource moments. The moment Mx (Moment of the resource histogram about the x-axis) represents the resource fluctuation and the moment My (Moment of the resource histogram about yaxis) represents the resource utilization. The minimum value of these two xlix
combined moments serves as a good indicator of efficiently utilized resources where fluctuations from period to another are avoided. The random activity priorities and the combined moments approach form the basis of the optimization process. [10] Most commercial scheduling software systems allow users to specify priority levels to activities. MS Project implements this in a direct manner by allowing users to select among eight priority leveling ("highest", "high", …etc to "lowest"), and assign them in a simple spreadsheet form. The software also provides a set of heuristic rules for resource allocation in which activity priority takes precedence over its "standard" set of heuristic rules. It is possible, therefore, to introduce some bias into some activities and consequently monitor the impact on the time schedule. For example, consider the case when only one activity is given "Highest" priority while all others are set to "lowest". With this limited change to the approach schedule, the project duration substantially decreases. This simple approach is proven to provide better results than existing heuristics without introducing new rules or changing the mechanism of heuristic procedures. Since it is not possible to readily identify, from a given network, which activities to assign higher priorities than others to improve the schedule, a simple iterative procedure may be used. [10] A Flow Chart of such procedure is presented in Figure (3-5).
l
START
Initialize Software
Set all activities priorities to "lowest" and get initial project duration
I=1
Set initial project duration = new project duration
Consider activity 1, change its priority to "highest" and get the new project duration
i=i+1
Is new project duration less than initial project duration?
Yes
No No Are all activities considered?
Return the priority of activity I to the "lowest"
Yes END
Figure (3-5) Iterative Procedure for Improving Resources Allocation Heuristic [10]
li
Despite its perceived benefit, the main shortcoming of this procedure is its inability to identify an optimum set of activity priorities that reduce project duration the most. The chromosome Structure was set as a string of elements, each corresponds to a priority level assigned to an activity, Figure (3-6). As such each chromosome represents one possible solution to the problem. To evaluate chromosome, an objective Function can be constructed by eliciting the user's preference (or weights) among the multi objectives containing duration and combined moments. [10]
1
2
7
4
3
4
0
5 3
6 5
X
Activity number
Y
Activity priority
P 2
0 = Highest; 1 = Higher; 2 = V.High; 3 = High; 4 = Mediun; 5 = Low; 6 = V.Low; 7 = Lower; 8 = Lowest Figure (3-6) Chromosome Formation [10]
lii
6
The detailed GA Procedure is outlined in Figure 3-7 START
1 User input of evaluation criteria (wts) for project duration & moments), population size, & No. of offspring
2 Initialize Scheduling Software
3 Save Initial Project Duration and moment
4 Generate population of random chromosome; each chromosome has a value for the priority of each project task
5 For each chromosome in the population: Input its data to the software Get project Duration & moments; & Calculate the Chromosome's fitness
6 Evaluate the relative merit of each Chromosome in the population and determine the worst Chromosome
END
14
Yes Is this the last Offspring
END
12
yes 7
No
Pick 2 Chromosomes at random with probability of being picked proportional to their relative merits
Is this the last Offspring
No
11
8
13
Perform Crossover or mutation to generate an Offspring
Discard the Offspring
9
Replace the worst chromosome with the Offspring
Determine the fitness of the Offspring chromosome, as in step 5
No
10
Yes
Is Offspring better than the worst Chromosome in the population?
Figure (3-7) Genetic Algorithm Procedure [10] liii
CHAPTER FOUR
PROPOSED RESOURCE SMOOTHING SYSTEM 4-1 Introduction This chapter presents a description of the proposed model designed to perform resources smoothing. The proposed model comprises two main sections: processing project data in MS and optimizing resource leveling using genetic algorithms program. These sections provide detailed descriptions of the individual sheets included in the resource database and time schedule sheets and resource smoothing. Figure (4-1) illustrates process chart diagram of the proposed model.
liv
Start
Start MS project
Input resources information manually Labour sheet Equipment sheet Materials sheet
Performing Time Schedule sheet
Performing Resources allocation Histogram of limited time
Performing Resources smoothing Histogram
Setting up genetic algorithms program (visual stiduo C++ but in time schedule sheet and resources information sheet
Performing activities ES, Project Duration and resources smoothing sheet
Input activities information get from MS project manually in GA program
Performing resources smoothing of limited time
Compare result with Mx to the two histogram
End
Figure (4-1) Process Chart Diagram of the Proposed Model [researcher] lv
4-2 Input Project Activities Information in MS Project The project activity information is input manually in commercial project management Software (Microsoft Project 2003). In this way, the user will be allowed to graphically define the relationships among the activities of the project in the standard Gant chart view. Further the user will utilize the commercial program’s interface features to perform Resource Smoothing and Resource Allocation. Project activity information includes activity name, duration, predecessor activities, and assigning resources. This part of ―Time Schedule‖ sheet accounts for CPM Scheduling calculation and comprises a list of the activities with their respective durations, CPM scheduling data and information as illustrated in figure (4-2) The CPM scheduling data includes predecessors, early start (ES), early finish (EF), late start (LS), late finish (LF) and total float (TF) for each activity. ID
Name
Activity Duration
P
ES
EF
LS
LF
TF
Figure (4-2) CPM Scheduling Screen
4-3 Resource Database Sheets The resource database consists of three sheets allocated to Labour, equipment, materials. The coding system used is combined coding system type (alphabetical and numerical) in which the first character points to type of resource and the second to the number of resource (e.g. L1, E4, M1…..etc). these sheets will be described in the following subsections:
lvi
4-3-1 Labour Sheet The ―Labour‖ sheet consists of four fields: ―Code‖, ―Description‖, ―Rate/hr‖ and ―Rate/d‖ as shown in Figure (4-3). The ―Code‖ field provides entry for a unique code to distinguish each labor included in the list. The second field allows for the description of resource type associated with the code. The ―Rate/hr‖ field provides the hourly rate of each resource. The ―Rate/d‖ field provides the daily rate of each resource. Code
Description
IDRate/hr
IDRate/d
Figure (4-3) Labour Sheet
4-3-2 Equipment Sheet The ―Equipment‖ sheet is comprised of the same four fields ―Code‖. ―Description‖, ―Rate/hr‖ and ―Rate/d‖ shown in figure (4-4). The equipment hourly rate and daily rate include equipment operating cost such as fuel consumption and maintenance, in addition to other costs.
Code
Description
IDRate/hr
Figure (4-4) Equipment Sheet
lvii
IDRate/d
4-3-3 Materials Sheet The ―Materials‖ sheet as shown in Figure (4-5) also comprises ―Code‖. ―Description‖, and ―IDCost/unit‖ fields. In addition to those fields the ―Materials‖ sheets also includes a field for material unit input ―Unit‖. The ―IDCost/unit‖ field includes the delivery cost of getting the respective materials on site.
Code
Description
IDCost/Unit
Unit
Figure (4-5) Materials Sheet
4-4 Importing MS Project Information The purpose of importing MS Project information is to provide (ES), (TF), (DU), and Resource number for each activity from the ―Time schedule‖ sheet. These information can be obtained from Microsoft project after applying resource smoothing and resource allocation. The bar chart of the time schedule sheet is adjusted to display the project time schedule from the MS Project file.
4-5 Optimization Process The proposed GA model uses software program based on Genetic Algorithms to perform the optimization process of resource leveling. This program is called (Microsoft Visual Studio) Version 6 which has many software under it. Research program is built under (C++) language.
lviii
4-5-1 Optimization by Using C++ Always C++ depends on specifying the object to get a specific class (or specific character) then create other target (object) from that specific character which have the same characters of that class. Each class should have some functions, each of it do special work depend on that variables. For example a function named (mental ability) for a human, this function depends on the ability of brain, getting practice… etc. therefore in a program we write the code of the class as below: Class human { Function ability (ability)
}; And so far that we can limit many classes which founded in a programming work and solve many problems.
4-5-2 Inheritance Inheritance is the best sample of programming characteristics which added to the programming world, because of the code which has been written 20 year ago is still used till present. This means the current code is inheritance of some old specifications. Therefore Offspring have carried all characters of the Chromosome except some parts particular to Chromosome. Hereupon all former programs and works is made use depending on that correct programmatic principle. [researcher]
lix
Polymorphism: C++ has performed the polymorphism is the best and better sample which proved one sample can appears in many forms as purpose and required. 4-5-3 Improving Resource Smoothing using C++ The objective of our program of C++ is getting the minimum of MX, are equal ∑R2 whereas R is the resource of each activity. The target of that is getting specific project. The aim of this project is to get knowledge the optimum resources to get the minimum ∑R2 for each project and the early start of each activity which only has TF. This work does not happen by isolated the activity from the other one because the activities is interfusion, therefore ∑R2 is cumulative. Any programmer sees this idea thought to move the first activity and calculate ∑R2 and then the second activity, this way is correct and it is long. But in the event of using Genetic Algorithm we will adapt this concept and make the movement which depend on correct programming grammars used in our program which is called cumulative test procedure and relation movement.
The Activities Features are as Follows: a. Each activity has duration. b. Each activity has early start that is important. c. Each activity has total float that is more important. Then we will make the permutation and calculate the fitness function (∑R2).
lx
d. Its noted there are critical activities without movement and uncompatible with the permutation because of the total float is equal zero. Every time in our project we are keep generated the offsprings to get the best cumulative resources of each day of project duration. The visual C++ program illustrates the optimum solution.
4-6 Minimizing Resource Moments The
minimizing
resource
moments
objective
represents
the
optimization of the resource smoothing procedure. Which involves the process of optimally minimizing resource fluctuations and resource utilization moments. This process is executed under unlimited resources Figure (4-6) illustrates process chart of resource smoothing. The optimization parameters associated with this process are outlined as follows: a. Objective function which will minimize the fluctuation and/or utilization moments; b. optimization variables which consist of activity TF values, which range accepts integers between zero and the maximum TF value obtained from Microsoft project before applying resource smoothing; c. optimization constraints which state that the project duration should be equal to the project deadline.
lxi
Time schedule sheet from Ms project
Bar chart scheduling computation screen - Project duration - Activity duration - Activity resource - Activity ES - Activity TF
Resource planning screen
Setting up optimization program C++
-
Selecting objective function Minimum fluctuation moment Minimum utilization moment or Minimum total moment
Defining optimization options - Population size - Stopping conditions
Defining constraints - Project duration dead line - Critical activities
Running the optimization process
Evaluating each possible solution with respect to fluctuation and/or utilization moment and constraints
Selecting the best possible solution
Performing activities with their ES, TF, and Cumulative resource on unit time
Figure (4-6) Optimization Process Chart of the Resource smoothing [researcher] lxii
4-7 Opening and Using C++ If you want to use and operate the program C++6 follow these steps: a. Click Start b. Go to All Programs c. Go to Microsoft Visual Studio 6.0 d. Go to Microsoft Visual C++ 6.0 These steps illustrate in Figure (4-7)
Figure (4-7) Operating C++
lxiii
And when C++ screen appears follows these steps: 1. File 2. Open 3. Write the file name contains the code 4. Press F7 5. Press Yes 6. Press Ctrl+F5 After the above steps GA input screen which we will input the number of activity, duration of project, for each activity input we will input: a. Duration b. Early start (ES) c. Total Float (TF) d. Resources (R) e. Is it critical or not f. When Click Enter the GAs is operate and give us Resource of each day and the minimum of (Mx) These steps illustrate in Figure (4-8) that input the data of one activity
Figure (4-8) GA Input Screen lxiv
CHAPTER FIVE
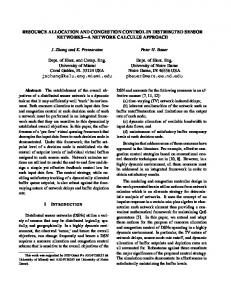
MODEL APPLICATION AND EVALUATION 5-1 Introduction This chapter represents the application of the proposed model to perform resource smoothing. Manual solution of case study is also included (performing resource smoothing in succession) to compare the model results with those of the manual solution. A construction Project consisting of 15 activities was considered as a second case study.
5-2 Case Study No.1 of Seven Activity (Description and Data) A summary of the case study data is demonstrated in Table (5-1)
Table (5-1) Case Study Data of 7 activity Activity
Duration
Labour (R)
Predecessors
A
2
2
-
B
6
4
A
C
3
3
A
D
1
1
B
E
6
3
B
F
3
3
C,D
G
2
2
E,F
lxv
From MS Project we get figure (5-1) and (5-2) show a hypothetical case study of 7 activities in the form of activity on node (AON) network and a bar chart representation respectively.
B
A
E
D C
G F
Figure (5-1) AON Network of 7 Activity Project
Figure (5-2) Bar Chart of 7 Activity Project
lxvi
Figure (5-3) illustrate the Resource Histogram before Smoothing where Mx = 353
Figure (5-3) Resource Histogram Before Smoothing
lxvii
Figure (5-4) illustrate resource Histogram after Smoothing in MS Project where Mx = 353
Figure (5-4) Resource Histogram After Smoothing
lxviii
Table (5-2) show the information needed to GA Resource Smoothing System which get it from MS Project before Smoothing and Table (5-3) show the information after Smoothing.
Table (5-2) Activity Information Before Smoothing Act
Dur
E.S
T.F.
R
Prec.
Critical or not
A
2
0
0
2
-
Cri
B
6
2
0
4
A
Cri
C
3
2
6
3
A
Non-Cri
D
1
8
2
1
B
Non-Cri
E
6
8
0
3
B
Cri
F
3
9
2
3
C,D
Non-Cri
G
2
14
0
2
E,F
Cri
Table (5-3) Activity Information After Smoothing in MS-Project Act
Dur
E.S
T.F.
R
Prec.
Critical or not
A
2
0
0
2
-
Cri
B
6
2
0
4
A
Cri
C
3
2
6
3
A
Non-Cri
D
1
10
0
1
B+2day[FS]
Cri
E
6
8
0
3
B
Cri
F
3
11
0
3
C,D
Cri
G
2
14
0
2
E,F
Cri
lxix
It is noted that MS-Project after smoothing make the activity D,F is critical and the Total Float = 0 while the moment of resources (Mx) is not changed and equal (Mx = 353).
5-3 Resource Smoothing Manual Solution Manual solution of this case study is perform to compare the results of the proposed GA model with its results. Manual resource smoothing histogram is illustrate in Figure (5-5) where Mx = 341 and the summary of manual activities ES and TF are shown in table (5-4)
Figure (5-5) Resource Smoothing After Rescheduling
lxx
Table (5-4) Activity Information After Rescheduling Act
Dur
E.S
T.F.
R
Prec.
Critical or not
A
2
0
0
2
-
Cri
B
6
2
0
4
A
Cri
C
3
8
0
3
A,B
Cri
D
1
8
2
1
B
Non-Cri
E
6
8
0
3
B
Cri
F
3
11
0
3
C,D
Cri
G
2
14
0
2
E,F
Cri
It is noted that the activity C,F is critical but the early start is changed and the activity D is not critical and the early start is not changed and Mx = 341 and less than the Mx from MS Project after Smoothing but the MS Project is made the activity D,F is critical.
5-4 Performing Optimization Process This application is perform to compare the proposed model results with manual solution of the case study. Optimization options are set as follow: - Population size: After initial experimentation with different population size (chromosomes) = No. of duration of any project. - Crossover rate = No. of total float of each non-critical activity. - Stopping condition: as GA gives results that show no further improvements.
lxxi
5-5 Performing Resource Smoothing This application demonstrates the proposed model ability to optimize the process of resource smoothing to compare the results with MS-project program and manual results. The optimization parameters associated are as follows: - Objective function: minimizes fluctuation moment (Mx). - Change TF, ES to non-critical activities. - Constraints: Project duration = deadline duration (16) ES = early start to critical activity. The results of resource smoothing in GA are illustrated in table (5-5)
Table (5-5) Activity Information of Resource Smoothing in GA Act
Dur
E.S
T.F.
R
Prec.
Critical or not
A
2
0
0
2
-
Cri
B
6
2
0
4
A
Cri
C
3
8
0
3
A,B
Cri
D
1
8
2
1
B
Non-Cri
E
6
8
0
3
B
Cri
F
3
11
0
3
C,D
Cri
G
2
14
0
2
E,F
Cri
And the bar chart after smoothing in GA as shown in Figure (5-6)
lxxii
Figure (5-6) Bar Chart of 7 Activity After Smoothing in GA
Figure (5-7) show resource smoothing histogram from GA results where Mx = 341
Figure (5-7) Resource Histogram After Smoothing From GA Results
lxxiii
Figure (5-8) show the GA output screen from C++
Figure (5-8) GA Output Screen
lxxiv
We conclude from the above that the MS project made the activity D,F is critical where Mx = 353 but GA is made the activity C,F is critical and activity D is still non-critical where Mx = 341 and it is less than the calculated Mx from MS project and equal mx from manual solution and the Histogram because its small project where the Mx from GA equal Mx from manual solution.
5-6 Case Study No.2 of 15 activities Table (5-6) Activity Information Activity
Dur
E.S
T.F
R
A
3
0
0
2
B
2
0
1
3
C
2
3
5
1
D
3
3
0
1
E
1
5
5
4
F
1
6
3
3
G
4
6
5
6
H
4
6
0
3
I
2
7
6
1
J
5
6
4
2
K
2
10
0
4
L
3
12
0
3
M
2
5
8
1
N
4
7
3
6
O
1
11
3
2
lxxv
Figure (5-9) illustrate resource histogram before smoothing where Mx = 1467.
Figure (5-9) Resource Histogram Before Smoothing
lxxvi
Figure (5-10) are illustrate resource histogram after smoothing by using MS project program with Mx = 1253
Figure (5-10) Resource Histogram After Smoothing From MS Project Results
lxxvii
Figure (5-11) are illustrate resource histogram after smoothing by using GA results where Mx = 1193.
Figure (5-11) Resource Histogram After Smoothing From GA Results
It is noted that the activities B,C,E,F,G,I,J,M,N,O is non-critical and must be work on genetic and the operation is continued for (2.5 hours) to find the optimal solution of Mx = 1193 and it is less than the calculated Mx of MS project that is equal 1253. and the highest peak from Ms-Project = 16 while from GA results = 15 and number of change, number of peak = 3 from Ms while number of change and peak = 2 from GA where it’s the best. lxxviii
5-7 Conclusion Based on the Optimization Experiments conducted on a hypothetical and real case study. the Genetic Algorithms procedure is proven an efficient search mechanism that achieves solutions. The Scheduling Model has the capability to obtain optimum solution performing resource smoothing and presenting a solution identical to the manual solution in which resource smoothing is performed. Moreover RS can be applied adopting proposed model obtaining results identical (and improved furthermore) to that obtained by adopting MS project.
REFERENCES 1. Moselhi, A., and Lorterapong, P. 1993. ―Least Impact Algorithm for Resource Allocation.‖ ‖ Can. J. Civ. Engrg., CSCE, 20(2). 2. Karshenas, S., and Haber, D. 1990. ―Economic Optimization of Construction Project Scheduling.‖ J. Constr. Mgmt. and Economics, E&FN Spon, 8(2), 135-146. 3. Abraham M. Dulcw and Mattila G. Kris 1998, "Resources Leveling of Linear Schedules Using Integer Linear Programming" ASCE, Journal of Construction Engineering and Management, Vol. 24, No. 3. 4. Robert B. and Photios G. 1998, "Scheduling Projects with Repeating Activities" ASCE, Journal of Construction Engineering and Management, Vol. 124, No. 4, P. 264.
lxxix
5. Sou-Sen.L and Shao.T, 2001, "Optimal Repetitive Scheduling Model with Shareable Resource Constraint", ASCE, Journal of Construction Engineering and Management, Vol. 127, No. 4,
P. 270.
6. Punk J.J and Bijebdra. V 2004, "Optimal Resource Allocation for the Quality Control Process" Department of Computer Sc. And Engg. Indian Institute of Technology Kanpur, P. 288. 7. Lu Tian and K. Chandy 2005, "Resource Allocating in Streaming Environments" Computer Science 256-80 California Institute of Technology. 8. Liang Chen and Gagan. A 2005, "Resource Allocating in a Middleware for Streaming Data" Department of Computer Science and Engineering, ohio State University Columbus, P. 120-133. 9. Tarek, H, 1999 "Optimization of Construction Time-Cost Trade off Analysis Using Genetic Algorithms", Canadian Journal of Civil Engineer, Vol. 26, P. 165. 10.Tarek, H. 1999 "Optimization of Resource Allocation and Leveling Using Genetic Algorithms", ASCE, Journal of Construction Engineering and Management, Vol. 125, No. 3, P.167. 11.Sou-Sen Leu and Chung-Huei. Y, 1999 "GA-Based Multicritiria Optimal Model for Construction Scheduling "ASCE, Journal of Construction Engineering and Management, Vol. 125, No. 6, P. 420. 12.haider, S. Naoum and R. Howes, 1999 "Genetic Algorithms Application and Testing for Equipment Selection" ASCE, Journal of Construction Engineering and Management, Vol. 125, No. 1, 444.
lxxx
P.
13.Tolga, E and Tarek, H, 2001, ―Simplified Spread Sheet Solutions" ASCE, Journal of Construction Engineering Management, Vol. 127, No. 6,P. 67. 14.Michael J. Madwesley and Saad. H, 2002 "Genetic Algorithms for Construction Site Layout in Project Planning" ASCE, Journal of Construction Engineering and Management, Vol. 128, No. 5, P. 155. 15.Brian. L and John. S, 2005 "A Genetic Algorithm for Drawing Ordered Sets" Texas College Mathematics Journal. Vol. 3, No. 2. 16.Senupta, B. and Guha, H.,1995, "Construction
Management and
Planning", Tata Mc Gra-Hill. 17.Project Management Institute, 1996, " A guide to the Project Management Body of Knowledge" USA. 18.Jaufari, A., 1984, "Criticism of CPM for Project Planning Analysis" Journal of Construction Engineering and Management, vol. 110, No. 2. 19.Singl, H., 2000, "Construction Management and Accounts" Tata Mc Graw-Hill. 20.Callahan, M.
T., Enbush. D.G.Q. and Rowings, J.
E., 1992,
"Construction Project Scheduling", McGraw-Hill, Inc. 21.Leach, L.P., 2000, "Critical Chain Project Management Improves Project Performance" Advanced Project Institute. 22.Maria, A., 1997 "Introduction to Modeling and Simulation" Proceedings of the 1997 Winter Simulation Conference, Atlanta, Georgia, USA. 23.Moselhi, O., and El-Rayes, K., 1993 "Scheduling of Repetitive Projects with Cost Optimization". lxxxi
24.Harris, R.
B.,
1990, "Packing Method for Resource Leveling
(PACK)", Journal of Construction Engineering and Management, vol. 116, No. 2. 25.Chan, W., Chau, D., and Kannan, G., 1996, "Construction Resource Scheduling with Genetic Algorithms". Journal of Construction Engineering and Management ASCE, vol. 122, No. 2. 26.Weist, J. D., 1967, "A Heuristic Model for Scheduling Large Projects with Limited Resources", Management Science, 13(6). 27.Allam,
S.I.G.,
1988,
"Multi
Project
Scheduling:
A
New
Categorization for Heuristic and Economics, E & F.N Spon, 6(2). 28.Son, J. and Skibuiewski, M. J., 1999, "Multi Heuristic Approach for Resource Leveling Problem in Construction Engineering and Management", Journal of Construction Engineering and Management ASCE, vol. 125, No. 1. 29.Hiyassat, A.
M., 2001, "Applying Modified Minimum Moment
Method to Multiple Resource Leveling", ASCE, Journal of Construction Engineering and Management, vol. 127, No. 3. 30.Harris, R. B., 1978, "Precedence and Arrow Networking Techniques Press, London, England. 31.Baker, J.E. 1985. Adaptive Selection Methods for Genetic Algorithms. Proceedings of an International Conference on Genetic Algorithms and Their Applications, 101-111. 32.Holland, J. H. 1975. Adaptation in Natural and Artificial Systems. Ann Arbor: The University of Michigan Press. 33.Beightler, C.S., Phillips, D. T., & Wilde, D.J. (1979). Foundations of optimization (2nd. Ed.). Englewood Cliffs, NJ: Prentice-Hall.
lxxxii
34.Golberg, D. E., & Segrest, P. 1987. Finite Markov chain analysis of genetic algorithms. Genetic Algorithms and their applications: Proceedings of the Second International Conference on Genetic Algorithms, 1-8. 35.Michell,M.,1998,"An Introduction to Genetic Algorithms", MIT press, London, England. 36.GOLDberq, D. E., 1989, "Genetic Algorithms in search optimization and Machine Learning", Addision Wesley Publishing Co. 37.Li, H. and Love, P., 1997, "Using Improved Genetic Algorithms to Facilitate Time Cost Optimization", Journal of Construction Engineering and Management ASCE, vol. 123, No.3. 38.Harmanani, H., Zouein, P., Hajar, A., 2000, "An Evolutionary Site Layout" , ASCE, Journal of Construction Engineering and Management, vol. 128, No.6. 39.Leu, S. and Yang, C. H.,1999, "GA-Based Multicriteria in Optimal Model for Construction Scheduling", ASCE, Journal of Construction Engineering and Management, vol. 125, No. 6. 40.Haider, A., Naoum, S., Howes, R and Tah, J., 1999, "Genetic Algorithms Application and Testing for Equipment Selection", ASCE Journal of Construction Engineering and Management, vol. 125, No.1. 41.Li, H., Cao, J.N. and Love, P.E., 1999, "Using Machine Learning and Genetic Algorithms to solve Time Cost Trade of Problems", ASCE, journal of Construction and Management, vol. 125, No.5. 42.Kevin, P. and Tarek, H., 2003, "Genetic Optimization for Dynamic project Control", ASCE journal of Construction Engineering and Management, vol. 129, No.4.
lxxxiii
43.Que, B. C., 2002, "Incorporating Practicability into Genetic Algorithms-Based Time-Cost Optimization", Journal of Construction Engineering and Management. 44.Tarek, S. A., 2000, "conjugation and Controlled Mutations New Operatos in Genetic Algorithms", Ph. D. Thesis, Computer Science and Information System, University of Technology. 45.De Jon, K.A. (1980b). ―A Genetic-Based Global Function Optimization Technique‖ Pittsburgh: University of Pittsburgh. Department of Computer Science. 46.Ibtisam, M. A 2006 ―Developing an Optimal Scheduling Model for Combing Time-Cost Trade of and Resource Leveling‖ A thesis submitted to the College of Engineering of University of Technology in a partial fulfillment of the requirements of the degree of Doctor in Civil Engineering Ch. 2, P.21.
APPENDIX THE THIRD REAL CASE STUDY: BUILDING A-1 Introduction: A building construction project consists of three floors, each floor contains two apartments, and each apartment consists of two bedrooms, living room, bathroom, and small kitchen. The dimensions of the building =12X25m and the area =300m2. Figure (A-1) illustrates the Bar Chart of 30 Activity.
lxxxiv
lxxxv
Figure (A-1) Bar Chart of Building
A-2 Cost and Time Estimation: The Resources related to the case study are stored and shown in Figure (A-2) and (A-3) of two Labour and four Equipment.
Code
Description
ID/Rate/day
L1
Skilled Labour
50000
L2
Unskilled Labour
15000
Figure (A-2) Labour Sheet
lxxxvi
Code
Description
ID/Rate/day
E1
Shovel
200000
E2
Excavator
200000
E3
Mixer
300000
E4
Concrete Pump
750000
Figure (A-3) Equipment Sheet
A-3 Entering Project Data in Time Schedule Sheet: Table (A-1) show the time schedule and activity information (Duration, Resources, ES, TF) of 30 activities. Table (A-1) Activity Information of Real Case Study Activity
dur
Resources L1
L2
Cleaning and grabbing
3
1
Digging the foundation
2
1
Building foundation
8
2
6
Bearing walls (ground floor)
20
2
Mold work (ground floor)
10
Reinforcement slab (ground 10
E1
E2
E3
E4
1
ES
TF
0
0
3
0
5
0
6
13
0
2
8
33
146
2
8
33
0
43
0
1 2
1
floor) Concrete slab (ground floor)
1
1
2
Bearing walls (first floor)
20
2
6
44
0
Mold work (first floor)
10
2
8
64
115
(first 10
2
8
64
0
Reinforcement
slab
floor)
lxxxvii
2
1
Activity
dur
Resources L1
L2
Concrete slab (first floor)
1
1
2
Bearing walls (second floor)
20
2
Mold work (second floor)
10
Reinforcement slab (second 10
E1
E2
E3 2
E4 1
ES
TF
74
0
6
75
0
2
8
95
84
2
8
95
0
105
0
floor) Concrete slab (second floor)
1
1
2
2
1
Stair room (walls)
2
1
3
106
79
Stair room (roof)
2
1
2
108
79
Parapets
3
1
3
106
74
Installing asphalt layer for 3
1
2
106
80
bathroom Pluming system
15
2
6
106
0
Electric system
12
2
4
106
3
Windows and doors
6
2
6
106
77
Plastering
21
4
8
121
0
Tiles
24
2
4
142
0
Painting
15
2
6
166
0
Final fixture of electric system 8
1
4
181
0
Final
pluming 3
1
2
181
5
Installing asphalt layer for 3
1
3
109
74
fixture
of
system
roof Concrete tile for roof
3
1
3
112
74
Exterior architectural
7
1
4
121
61
lxxxviii
Figure (A-4) show the results of Resource Smoothing Histogram of Critical Resource (L2) in MS Project where Mx = 3625.
Figure (A-4) Resource Histogram from MS Project Results
lxxxix
And Figure (A-5) show the results of Resource Smoothing from GA where Mx = 3465 and we found GA decrease the moment of resources compared with MS Project results.
Figure (A-5) Resource Histogram from the Proposed Model
xc
A-4 The Resource Smoothing Model File Resource smoothing model code is introduced in this section. The researcher tries, while writing the model code, to qualify the model to be method study tool. That is, providing the model with capability of testing various Mx, My and Mx + My values and then choosing the best one. A-4-1 Decision Variables and Operation Parameters (User’s Inputs): This is the first part of the model file, this part requires inputs from modelers on users. These inputs will be programmed the variables, which will be used for processing GA and calculating the results. The descriptions for each variable are shown in table (A-2)
Table (A-2) Users Inputs For GAs [researcher] ******************************************************************************
#include int nncrtc[100]; char agree; int ncrtc[100]; int es[26]; int fes[26]; int rrr[26]; int dur[26]; int actv[26]; int ret[26]; int res[26]; int w3; int n1; int n2; int addtime[100]; int time[26][100]; int orgtime[26][100]; int a,b,c,d,e,f,g,h,i,j,k,l,m,n,o,p,q,r,s,t,u,v,w,x,y,z; int sv[26]; char ch[26]={'A','B','C','D','E','F','G','H','I','J','K','L','M','N','O','P','Q','R','S','T','U','V','W','X','Y',' Z'};
xci
int mmx=4000000; int mx; int ctr; ************************************************************************
A-4-2 Control of GAs Process: The GAs process happens the same manner as described in chapter (3). Table (A-3) show the GAs process control Table (A-3) GAs Process Control [researcher] ****************************************************************** void orgnl(int); void move(int,int); void reset(int); void save(); void main() coutn1; coutn2; for(int xy=0;xy