IOP PUBLISHING
NANOTECHNOLOGY
Nanotechnology 22 (2011) 465203 (5pp)
doi:10.1088/0957-4484/22/46/465203
Ordered systems of site-controlled pyramidal quantum dots incorporated in photonic crystal cavities A Surrente1, M Felici1,4 , P Gallo1 , B Dwir1 , A Rudra1, G Biasiol2 , L Sorba3 and E Kapon1 ´ Laboratory of Physics of Nanostructures, Ecole Polytechnique F´ed´erale de Lausanne (EPFL), CH-1015 Lausanne, Switzerland 2 Istituto Officina dei Materiali CNR, Laboratorio TASC, I-34149 Trieste, Italy 3 NEST, Istituto di Nanoscienze CNR and Scuola Normale Superiore, I-56126 Pisa, Italy 1
E-mail:
[email protected]
Received 26 July 2011, in final form 23 September 2011 Published 27 October 2011 Online at stacks.iop.org/Nano/22/465203 Abstract The coupling of a prescribed number of site-controlled pyramidal quantum dots (QDs) with photonic crystal (PhC) cavities was studied by polarization and power-dependent photoluminescence measurements. The energy of the cavity mode could be readily tuned, making use of the high spectral uniformity of the QDs and designing PhC cavities with different hole radii. Efficient coupling of the PhC cavity modes both to the ground state and to the excited state transitions of the QDs was observed, whereas no evidence for far off-resonant coupling was found. (Some figures may appear in colour only in the online journal)
in the wetting layer make such systems difficult to realize and interpret. Moreover, the positioning of several self-assembled QDs at selected sites within a photonic microcavity is virtually impossible. Yet, such ordered QD cavity systems are highly interesting for investigating coherent coupling of QDs via cavity modes and QD lasers in which all QD transitions spectrally overlap with the cavity mode. A viable alternative towards this objective is based on ordered QD systems grown on patterned substrates [10]. The QD nucleation sites can be designed such that the QD pattern fits the spatial distribution of a desired cavity mode. This approach has been demonstrated using single, pyramidal InGaAs QDs grown on patterned (111) B GaAs substrates, revealing exclusively near-resonance, phononmediated coupling of the cavity mode and QD-confined single excitons [11, 12]. The demonstration of cavity-mode QD resonances was also achieved in position-controlled QDs deposited at the apex of square, upstanding pyramids grown by chemical beam epitaxy [13]. In this paper we report on the fabrication and characterization of L11 PhC cavities in which several (3–9) pyramidal InGaAs/GaAs QDs were inserted, see figure 1.
1. Introduction The incorporation of ordered systems of semiconductor quantum dots (QDs) into different types of optical microcavities [1, 2] is of interest both for fundamental studies of light– matter interaction in confined systems [3] and for applications in photonic devices such as QD lasers [4], single [5] and entangled [6] photon emitters and, more generally, in quantum information technology. In a photonic crystal (PhC) defect membrane cavity the mode volume can be smaller than a cubic resonance wavelength. Hence, dramatic modifications in the exciton–photon interaction are envisaged in integrated QD– PhC cavity systems [7]. These systems have been investigated intensively, mostly employing self-assembled QDs grown by the Stranski–Krastanov method. In such structures, the absence of predetermined nucleation sites of the QDs could be partially circumvented by constructing the cavity around a preselected dot [8, 9]. However, the lack of control on both the QD emission energy and polarization, the occurrence of other QDs nearby and the spurious localization of excitonic states 4 Present address: ‘La Sapienza’ Universit`a di Roma, Piazzale Aldo Moro 2, I-00185 Roma, Italy.
0957-4484/11/465203+05$33.00
1
© 2011 IOP Publishing Ltd Printed in the UK & the USA
Nanotechnology 22 (2011) 465203
A Surrente et al
to a higher decomposition rate of metal–organic precursors on the (111)A-oriented pyramids’ facets as compared to the (111)B substrate surface, and nanocapillarity-driven adatom fluxes directed towards the centre of the pyramid [10, 14]. The PhC cavities were fabricated by EBL and inductively coupled plasma reactive ion etching, employing an N2 /BCl3 gas mixture. The PhC patterns, all with a lattice period a of 200 nm, were aligned with the QD arrays using alignment marks etched prior to the QD fabrication step (alignment accuracy better than 40 nm). A wet chemical etching step based on an HF solution was used to underetch the AlGaAs sacrificial layer and to release the GaAs membrane (see figure 1(d) for a fabricated structure). The positions of the etched PhC holes were designed such as to eliminate all unwanted QDs from the structure. The PhC hole radius r was varied systematically from device to device in order to deterministically tune the cavity mode energy. The fundamental mode of the L11 cavity (pattern displayed in figure 1(c)) was designed to scan an energy region including the QD GS and ES transitions. The cavity design was performed using the 3D finite difference time domain (FDTD) method implemented in a freely available software package [15].
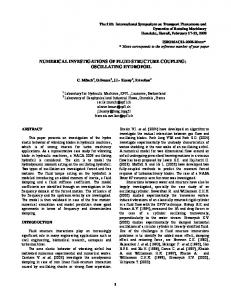
Figure 1. (a) SEM image of a typical patterned GaAs substrate employed. The pitch of the triangular pyramid array is 200 nm. (b) Schematic illustration of an L11 cavity with nine integrated pyramidal QDs. (c) Electric field pattern ( E y component) of the fundamental cavity mode of an L11 cavity computed by 3D FDTD simulation. (d) SEM image of a fabricated L11 cavity, incorporating nine dots; the overgrown pyramids are nearly planarized, hence not visible. All panels are displayed keeping the same orientation.
Optical spectroscopy of these structures demonstrates efficient coupling of the dots to the cavity mode via either the ground state (GS) or the excited state (ES) QD transitions, but no coupling for intermediate cavity energies. The results are interpreted and their implications for prospects of achieving photon-mediated coupling of remote QDs are discussed.
3. Photoluminescence characterization The photoluminescence (PL) spectra of the structures were measured at low temperature using a micro-PL (μPL) set-up. The samples were excited by a continuous wave (CW) laser at λ = 532 nm, used for polarization-resolved spectroscopy, or a pulsed laser at λ = 740 nm emitting 3 ps pulses with a repetition rate of 76 MHz. The laser beam was focused to a ∼1 μm spot on the sample, mounted on the cold finger of an He-flow cryostat through a 50× microscope objective of numerical aperture 0.5. The luminescence was collected through the same lens and dispersed by a 460 mm long spectrometer, yielding a spectral resolution of ∼100 μeV. The signal was detected by a liquid N2 cooled Si CCD detector. A typical μPL spectrum of a QD ensemble measured at 10 K is displayed in figure 2(a). At high excitation power, the spectrum shows a smooth Gaussian envelope, reflecting both the inhomogeneous broadening due to QD size and composition fluctuations and the population of each dot by multi-particle exciton complexes [16]. At lower incident optical power, sharp lines appear; an ensemble linewidth as low as 7.4 meV was obtained by Gaussian fitting of the low power spectrum in figure 2(a). This inhomogeneous broadening is characteristic of such ordered QDs throughout the patterned area [14, 16] and is key to the realization of the systems discussed here. Cavity modes were identified in the emission spectra by performing polarization-resolved spectroscopy. In figure 2(b), we show the polarization-resolved μPL spectrum (CW excitation at λ = 532 nm, power density of 450 W cm−2 ) measured at 10 K for an L11 cavity (nominal r/a = 0.27) with nine QDs positioned at its centre. V and H denote linear polarization perpendicular and parallel to the cavity axis, respectively, see figure 1(c). The intense peak at 1.4041 eV
2. Sample fabrication The first fabrication step consisted in the growth of a 1 μm thick Al0.75 Ga0.25 As layer and of a 265 nm thick GaAs membrane layer, obtained by performing molecular beam epitaxy on a semi-insulating (111) B GaAs substrate at 625 ◦ C and 600 ◦ C, respectively, resulting in a flat surface with subnm roughness. The regrown substrate was then patterned with specific designs of inverted tetrahedral recesses (pyramids) by electron beam lithography (EBL) and wet Br2 /methanol etching. The pyramidal pits, with a side length of ∼160 nm, were arranged on a triangular lattice with a period of 200 nm, matching exactly that of the PhC that would be implemented. These arrays of smaller pyramids were surrounded by larger pyramids (side length of ∼270 nm, pitch of 500 nm) with the aim of reducing the local growth rate in the area of interest. To study the emission properties of a prescribed number of QDs in an L11 cavity, a varying number of pyramids was omitted from the pattern, in correspondence to the cavity sides. Figure 1(a) shows a particular example of such a pattern that was used for placing nine pyramidal QDs, arranged as in figure 1(b), in an L11 cavity. Next, the QDs were grown by low-pressure metal–organic vapour phase epitaxy in a horizontal reactor using N2 as carrier gas. The grown heterostructure consisted of a 2.5 nm thick inferior GaAs buffer layer, a 0.2 nm thick QD In0.2 Ga0.8 As layer and a 5 nm thick cap GaAs layer. The substrate temperature was 570 ◦ C. Both thicknesses and compositions refer to calibration growths carried out on a planar (100) GaAs substrate. The formation of lens-shaped QDs at the bottom of each pyramid stems from the combined effects of growth rate anisotropy, owing 2
Nanotechnology 22 (2011) 465203
A Surrente et al
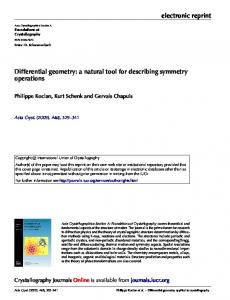
Figure 2. (a) Low temperature power-dependent μPL spectra of an ensemble of bare pyramidal QDs. (b) Main: polarization-resolved and degree of linear polarization (DOP) μPL spectra of an L11 cavity with nine embedded QDs, arranged as in figure 1. Inset: measured spatial profile of the cavity mode and computed electric field E y and intensity I distribution.
shows the expected polarization behaviour; therefore we attribute it to the fundamental L11 cavity mode. The degree of linear polarization (DOP) σ = (IV − IH )/(IV + IH ), where IV and IH stand for the integrated intensity of the light polarized along V and H, respectively, is also plotted versus photon energy in figure 2(b). The emission on the low energy side of the cavity mode is due to QDs placed within the cavity that do not emit in resonance with the cavity mode. However, whereas the bare QDs show PL spectra that are polarization-isotropic in the wafer plane [6], the QD features not in resonance with the cavity mode show similar DOP as the cavity mode. The DOP for the non-resonant QD features drops rapidly, within ∼5 meV away from the cavity mode energy, suggesting a coupling mechanism mediated by acoustic phonons [17]. The spatial distribution of the cavity emission, measured in a confocal microscope configuration, is shown as an inset in figure 2(b) and agrees well with the calculated optical field pattern, as expected. Making use of polarization-resolved μPL spectroscopy, efficient coupling was systematically observed also for the PhC cavities embedding a smaller number of QDs. In figure 3, we show polarization-resolved μPL spectra for each combination of QD cavity systems present on our sample, measured under CW excitation at 532 nm wavelength. The measurements were carried out at high excitation levels, using a power density of 450 W cm−2 . Only cavities with a r/a = 0.26 are presented to show that for any number of QDs embedded in the cavity, a PhC cavity mode (position indicated by an arrow) is systematically observed in the expected spectral region. The small differences in the cavity mode energy can be due to small fabrication-related imperfections of the PhCs. Similar to what is observed for the nine-QD cavity system, the photons are emitted preferentially in the cavity mode polarization even if they are slightly detuned from it, resulting in a non-zero DOP of some PL QD peaks. The systematic observation of cavity modes fed by an arbitrary number of QDs is a necessary, albeit only very preliminary, step to the realization of a photon-mediated coupling of remote QDs. Figure 4 presents the polarization-resolved μPL spectra acquired from a series of L11 cavities with different values of
Figure 3. Polarization-resolved μPL spectra from four L11 cavities having a fixed r/a = 0.26 with a number of pyramidal QDs increasing from three to nine embedded at the cavity centre. The cavity mode positions are indicated by arrows.
r/a , for CW excitation at 532 nm wavelength (measured at high excitation levels, power density of 450 W cm−2 ). On this sample, at high power we could not see discrete QD lines. The reason for this is that, while the inhomogeneous broadening is very low, at high excitation levels the QD transitions are not only restricted to single exciton states, but there are also charged and neutral multi-exciton states, all within the inhomogeneous broadening. Only a subset of the L11 cavity structures, for which the cavity modes are close to the GS and ES transitions, shows the presence of a cavity mode, marked by the arrows in figure 4. The absence of a long range coupling between the cavity modes and the QD transitions (this is the case for r/a = 0.27 in figure 4) is in good agreement with the picture of a phonon-mediated coupling of the cavity mode to QD single excitons [17]. The presence of cavity modes in regions energetically distant from the GS transition is observed only when the QD ESs are significantly populated. 3
Nanotechnology 22 (2011) 465203
A Surrente et al
Figure 4. Main: polarization-resolved μPL spectra from a series of L11 cavities with nine QDs as in figure 1 for different r/a values. The cavity mode positions are indicated by arrows. Inset: cavity mode energy against the r/a ratio.
Figure 5. Main: power dependence of the μPL spectra of an L11 cavity containing nine QDs (as in figure 1) in resonance with the excited state transition. The cavity mode intensity increases strongly before reaching a saturation regime. Left inset: energy of the cavity mode peaks as a function of temperature. The low redshift rate of these peaks with temperature shows that both peaks observed are indeed cavity modes. Right inset: integrated intensity and spectral FWHM of the cavity mode versus excitation power. The linewidth of the cavity modes decreases from its low power value and reaches saturation, pointing to a quenching of the QD absorption.
For low excitation power, these peaks disappear, as shown in the bottommost spectrum in figure 5. In this regime only short range coupling can be observed. In the inset of figure 4, the resonance energies are plotted against r/a . Modes other than the fundamental one can appear at the excitation conditions used for the measurements presented in figure 4. Notably, the spectrum of the device having an r/a = 0.265 shows a peak at ∼1.402 eV, which we attribute to the fundamental mode of the L11 cavity. The weak peak at ∼1.417 eV is attributed to the first excited cavity mode: indeed, the separation between these two peaks is ∼14.2 meV, which is in good agreement with the energy separation of the simulated modes. In the spectrum of the device with r/a = 0.26, two polarized peaks can be noticed, as well. Based on our simulations, these two peaks cannot be attributed to cavity modes because of their small energy separation (less than 2 meV). They are instead related to excitonic transitions, which have a preferential polarization induced by the presence of a close-by cavity mode. Interestingly, the coupling of the cavity mode to the ES QD transition can be extremely efficient. For a more detailed characterization, we selected a cavity having r/a = 0.29 that shows a cavity mode with a peak intensity larger by a factor of ten as compared to the background ES emission intensity (see figure 5). For the sake of comparison, the highest cavity mode peak intensity to background ratio for coupling with the GS transition was found to be six in the case of r/a = 0.265 (displayed in figure 2(b)) under the same excitation conditions. The PhC mode coupling to the ES QD transition was studied as a function of the excitation power for pulsed excitation at 740 nm (figure 5). At lower excitation, the cavity mode intensity increases superlinearly with excitation power, because the ESs become populated only above a certain pump power due to efficient relaxation to the GS. The spectral full width at half-maximum (FWHM) of the cavity mode in this regime is >400 μeV, limited by absorption of QDs (see the inset in figure 5). The cavity mode intensity saturates at excitation power above ∼200 μW. As the excitation power is
increased, the linewidth of the cavity mode first decreases and then reaches a plateau at FWHM ∼370 μeV, limited by other sources of scattering and absorption, particularly absorption at bulk and surface states of the thin GaAs membrane. The saturated FWHM corresponds to a quality factor Q of ∼3900. The use of a relatively thick membrane, needed to accommodate the pyramidal pits, along with the displacement of the QD with respect to the maximum of the electric field in the vertical direction of the membrane, and the relative proximity of the cavity mode energy to the GaAs absorption band can be other reasons that limit the quality factor. The increase in Q due to absorption saturation in the QDs is smaller than what was observed in similar structures containing quantum wires [18], reflecting the smaller size of the QD system. Another peak redshifted with respect to the main one by ∼7.5 meV appears when the excitation power is sufficiently high. As demonstrated by temperature-dependent, polarization-resolved μPL measurements (summarized in the left inset to figure 5), both peaks at 1.428 and 1.435 eV redshift at the same rate with temperature (300 μeV redshift between 10 and 40 K). Such a moderate shift of the cavity mode energy is compatible with a refractive index variation of the host material [19]. Interestingly, the low energy peak can be observed only at high excitation power. In this regime, the QD ES starts being significantly populated and its PL peak broadens with an increasing power. Consequently, the cavity mode intensity increases along with the spectral overlap between the two transitions. 4
Nanotechnology 22 (2011) 465203
A Surrente et al
4. Conclusions
[8] Hennessy K, Badolato A, Winger M, Gerace D, Atat¨ure M, Gulde S, F¨alt S, Hu E L and Imamo˘glu A 2007 Quantum nature of a strongly coupled single quantum dot-cavity system Nature 445 896–9 [9] Badolato A, Hennessy K, Atat¨ure M, Dreiser J, Hu E, Petroff P M and Imamo˘glu A 2005 Deterministic coupling of single quantum dots to single nanocavity modes Science 308 1158–61 [10] Kapon E, Pelucchi E, Watanabe S, Malko A, Baier M H, Leifer K, Dwir B, Michelini F and Dupertuis M A 2004 Site- and energy-controlled pyramidal quantum dot heterostructures Phys. E-Low-Dimens. Syst. Nanostruct. 25 288–97 [11] Gallo P, Felici M, Dwir B, Atlasov K A, Karlsson K F, Rudra A, Mohan A, Biasiol G, Sorba L and Kapon E 2008 Integration of site-controlled pyramidal quantum dots and photonic crystal membrane cavities Appl. Phys. Lett. 92 263101 [12] Calic M et al 2011 Phonon-mediated coupling of InGaAs/GaAs quantum-dot excitons to photonic crystal cavities Phys. Rev. Lett. 106 227402 [13] Hughes S et al 2011 Influence of electron-acoustic phonon scattering on off-resonant cavity feeding within a strongly coupled quantum-dot cavity system Phys. Rev. B 83 165313 [14] Surrente A, Gallo P, Felici M, Dwir B, Rudra A and Kapon E 2009 Dense arrays of ordered pyramidal quantum dots with narrow linewidth photoluminescence spectra Nanotechnology 20 415205 [15] Oskooi A F, Roundy D, Ibanescu M, Bermel P, Joannopoulos J D and Johnson S G 2010 Meep: a flexible free-software package for electromagnetic simulations by the fdtd method Comput. Phys. Commun. 181 687–702 [16] Mohan A et al 2010 Record-low inhomogeneous broadening of site-controlled quantum dots for nanophotonics Small 6 1268–72 [17] Tarel G and Savona V 2010 Linear spectrum of a quantum dot coupled to a nanocavity Phys. Rev. B 81 075305 [18] Atlasov K A, Calic M, Karlsson K F, Gallo P, Rudra A, Dwir B and Kapon E 2009 Photonic-crystal microcavity laser with site-controlled quantum-wire active medium Opt. Express 17 18178–83 [19] Gevaux D G, Bennett A J, Stevenson R M, Shields A J, Atkinson P, Griffiths J, Anderson D, Jones G A C and Ritchie D A 2006 Enhancement and suppression of spontaneous emission by temperature tuning InAs quantum dots to photonic crystal cavities Appl. Phys. Lett. 88 131101 [20] Winger M et al 2009 Explanation of photon correlations in the far-off-resonance optical emission from a quantum-dot-cavity system Phys. Rev. Lett. 103 207403
In summary, a controlled number of pyramidal QDs was successfully integrated with L11 PhC cavities. The precisely controllable QD position and the high spectral uniformity of these nanostructures were exploited to study the coupling between the L11 cavity mode and both the GS and ES QD transitions. The absence of coupling of the cavity mode for exceedingly large detuning from the GS or ES transitions demonstrates the negligible effect of barrier states in this coupling mechanism [12, 20]. These results make the pyramidal QD–PhC cavity system an attractive candidate for the realization of complex photonic devices, such as QD systems laterally coupled via optical cavity modes and PhC QD lasers, where all the QDs contribute to the optical gain.
Acknowledgment We wish to acknowledge funding by the Swiss National Science Foundation.
References [1] Vahala K J 2003 Optical microcavities Nature 424 839–46 [2] Felici M et al 2010 Semianalytical approach to the design of photonic crystal cavities Phys. Rev. B 82 115118 [3] Englund D, Faraon A, Fushman I, Stoltz N, Petroff P and Vuˇckovi´c J 2007 Controlling cavity reflectivity with a single quantum dot Nature 450 857–61 [4] Nomura M, Kumagai N, Iwamoto S, Ota Y and Arakawa Y 2010 Laser oscillation in a strongly coupled single-quantum-dot-nanocavity system Nature Phys. 6 279–83 [5] Press D, Gotzinger S, Reitzenstein S, Hofmann C, Loffler A, Kamp M, Forchel A and Yamamoto Y 2007 Photon antibunching from a single quantum-dot-microcavity system in the strong coupling regime Phys. Rev. Lett. 98 117402 [6] Mohan A, Felici M, Gallo P, Dwir B, Rudra A, Faist J and Kapon E 2010 Polarization-entangled photons produced with high-symmetry site-controlled quantum dots Nature Photon. 4 302–6 [7] Khitrova G, Gibbs H M, Kira M, Koch S W and Scherer A 2006 Vacuum rabi splitting in semiconductors Nature Phys. 2 81–90
5