Symposium
New Applications of Statistical Tools in Plant Pathology
Overview of Selected Multivariate Statistical Methods and Their Use in Phytopathological Research S. Sanogo and X. B. Yang First author: Department of Entomology, Plant Pathology, and Weed Science, New Mexico State University, Las Cruces 88003; and second author: Department of Plant Pathology, Iowa State University, Ames 50011. Accepted for publication 16 May 2004.
ABSTRACT Sanogo, S., and Yang, X. B. 2004. Overview of selected multivariate statistical methods and their use in phytopathological research. Phytopathology 94:1004-1006. To disentangle the nature of a pathosystem or a component of the system such as disease epidemics for descriptive or predictive purposes, mensuration is conducted on several variables of the physical and chemical environment, pathogenic populations, and host plants. For instance, it may be desired to (i) distinguish pathogenic variation among several isolates of a pathogen based on disease severity; (ii) identify the most im-
The dogma of plant pathology, which states that disease is the result of interactive effects of environment, pathogen, and host plant, provides upfront a stage for handling several variables to characterize disease epidemics. Plant pathologists routinely undertake various activities in order to describe and predict (i) disease risks based on climatic variables or changes in host plant and/or pathogen populations, (ii) the impact of anthropogenic activities (farming practices such as cropping systems and management schemes) on the magnitude of diseases, and (iii) preference or perception of producers on new products and technologies for disease management. These activities entail collection of data on many variables. With the development of computers and automatic digital data recorders, the amount of data and number of variables are increasing dramatically. Plant pathologists working in areas such as epidemiology, pathogen ecology, pathogen population biology, and disease management are challenged in uncovering patterns in multivariable data. Statistical methods are available for analyzing data comprised of multiple variables (7,9,11,18), and encompass three major tools (Table 1): (i) ordination, which aims at describing data by identifying a reduced data dimension of a few variables that account for the greatest amount of variability in the data; (ii) discrimination, which aims at delineating experimental groups or classifying observations into experimental groups based on a set of variables; and (iii) canonical, which aims at describing and predicting the relationship between two sets of variables. Multivariate data analysis is based on two central features: (i) linear combinations of variables or variates, and (ii) distances or measures of association. In addition to these central features, Hair et al. (7) defined two notions that need to be considered in multiCorresponding author: S. Sanogo; E-mail address:
[email protected] Publication no. P-2004-0719-02O © 2004 The American Phytopathological Society
1004
PHYTOPATHOLOGY
portant variables that characterize the structure of an epidemic; and (iii) assess the potential of developing regional scale versus site-specific postmanagement schemes using weather and site variation. In all these cases, a simultaneous handling of several variables is required, and entails the use of multivariate statistics such as discriminant analysis, multivariate analysis of variance, correspondence analysis, and canonical correlation analysis. These tools have been used to varying degree in the phytopathological literature. A succinct overview of these tools is presented with cited examples.
variate analysis. First, is the nature of variables, which may be either metric (quantitative or numerical) or nonmetric (qualitative or categorical). Second, is the notion of dependency or interdependency. In the dependency context, one or several variables designated as dependent variables are influenced in magnitude by another set of variables designated as independent variables. In the interdependency context, variables are not designated as either dependent or independent. On the basis of these features and notions, several multivariate statistical tools have been developed (Tables 2 and 3), and further details are provided by Hair et al. (7) and James and McCulloch (9). Multivariate tools have been employed to varying degrees in the phytopathological literature. A bibliometric search of the Biological Abstract database (Silver Platter Information, Norwood, MA), from 1997 to 2003, indicates that ordination and discrimination tools have, by far, been used frequently compared with canonical analyses. Among the ordination methods, correspondence analysis was the least used, and multivariate analysis of variance (MANOVA) was the least used among discrimination methods. This article provides a brief overview of discriminant analysis, MANOVA, correspondence analysis, and canonical correlation techniques. Discriminant analysis. The goal of discriminant analysis is to assess the association between a single nonmetric dependent variable with two or more levels and a set of several metric independent variables. The procedure has two goals. First, it allows one to describe and unravel the underlying structure of the association and to determine the contribution of each independent variable in the makeup of that structure. Second, it enables prediction or classification of new cases based on previously established structure. Discriminant analysis has been used extensively in the phytopathological literature to describe the relationship of physical and biological variables to components of disease epidemics. Johnson et al. (10) used a 25-year record of the occurrence of potato late blight in commercial fields to develop a discriminant
function relating rain variables and outbreaks of potato late blight in the state of Washington. Similarly, Hennessy et al. (8) employed discriminant analysis to determine how climatic factors (rainfall and minimum and maximum air temperature) influence severity of sorghum leaf blight in South Africa. Noe and Barker (14) used canonical discriminant analysis to determine which edaphic factors contributed the most in delineating three levels of nematode densities (low, medium, and high). Chakraborty et al. (2) characterized and classified pathogenic races of isolates of Colletotrichum gloeosporioides based on disease severity on Stylosanthes scabra, a tropical pasture legume. Workneh et al. (20) defined classes of corky root severity in tomatoes using discriminant analysis to ascertain the distinction among severity classes based on a set of soil and plant variables. In lieu of discriminant analysis, logistic regression may be used in modeling the relationship of a binary dependent variable (yes or no, presence or absence) to metric or nonmetric independent variables. As such, logistic regression may be viewed as a discriminant analysis with two levels of the dependent variable and with independent variables that are either metric or nonmetric. Press and Wilson (15) studied the performance of discriminant analysis and logistic regression, and concluded that if the assumption of multivariate normality of independent variables is violated, logistic regression is preferable to discriminant analysis. MANOVA. MANOVA is a procedure for assessing differences among several nonmetric independent variables based on the linear combination of several metric dependent variables. This procedure enables the simultaneous examination of several dependent variables. Golinski et al. (6) used MANOVA to assess the effect of two pathogens (Fusarium avenaceum and F. culmorum) on three yield components (1,000-kernel weight and weight and number of kernels per winter wheat head) of 14 winter wheat cultivars in a 2-year study. The dependent variables were the three yield components and the independent variables were pathogens, years, and cultivars, including interaction terms among these three factors. Similarly, Evans et al. (3) used MANOVA to examine differences in host penetration and colonization by Alternaria linicola in three genotypes (susceptible, moderately resistant, and resistant) of Linum usitatissimum. Dependent variables were associated with host penetration and colonization, and the three genotypes were independent variables. There are scenarios in which response variables are temporally and spatially dependent. As an example, consider an experiment designed to assess the effect of several fungicides on the severity of a disease in a set of crop cultivars, and that disease severity (DS) was recorded at four time points (t1, t2, t3, and t4) yielding disease severity values of DS1, DS2, DS3, and DS4, respectively. Typically, these DS values at the four time points are correlated,
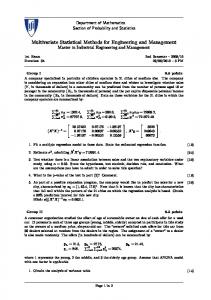
and thus are not independent. The existence of such correlation may reduce the power of MANOVA (7,19) in detecting differences among independent variables. Remedial measures include several options such as using repeated measures analysis and principal component analysis. In the repeated measures MANOVA (19), a set of new variables (D1, D2, and D3) are derived from the mean differences between successive DS values as follows: D1 = DS2 – DS1, D2 = DS3 – DS2, and D3 = DS4 – DS3. These new variables are then used as dependent variables. Principal component analysis enables the identification of linear combinations of dependent variables with maximum variance, which are uncorrelated to each other. These components are then used as dependent variables in lieu of the correlated original variables. A drawback of using principal component as a remedial procedure may be the difficulties in interpreting the results. Two other matters related to the use of MANOVA include the handling of a significant effect and the choice of a test statistic. In the presence of a significant effect, two of the possible approaches include (i) dependent variable contribution and (ii) multivariate contrasts. In the dependent variable contribution approach, dependent variables are removed one at a time and MANOVA is performed with the remaining dependent variables to examine how much change is induced in the significance of an effect by the removal of a dependent variable (18). Besides dependent variable contribution, multivariate contrasts may be constructed to assess differences among significant independent variables. Several criteria used for gauging multivariate differences among independent variables are Roy’s gcr, Wilks’ lambda (or U statistic), Hotelling’s trace, and Pillai’s criteria. Although Wilks’ lambda is most often used and reported in research articles, the choice of any criterion is guided by the degree at which the assumptions underlying MANOVA are satisfactorily met (7,18). Correspondence analysis. Correspondence analysis describes relationships among two or more cross-tabulated categorical variables (contingency table). Frequencies in the contingency table are transformed into chi-square distances, which are used to establish a perceptual map of the relation among variables. Savary et TABLE 2. A general guide to choosing multivariate statistical tools based on nature of independent and dependent variablesa Dependent variable Metric only Nonmetric only Metric or nonmetric
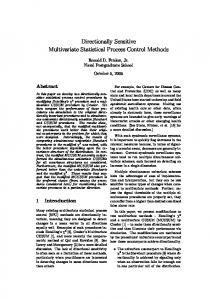
TABLE 1. General grouping of multivariate tools and their goalsa Tools Ordination Principal component analysis Principal coordinate Discriminant analysis Correspondence analysis Multidimensional scaling Factor analysis Discrimination/classification Discriminant analysis Multiple logistic regression Multivariate analysis of variance Cluster analysis Canonical Canonical correlation Canonical correspondence Redundancy a
a
Goals Reduce a space of n variables into a low-dimensional space (2 to 5 dimensions)
Independent variable Metric only
Nonmetric only
Metric or nonmetric
...
Multivariate analysis Multiple regression of variance analysis Discriminant Correspondence Multiple logistic analysis analysis regression ... Conjoint analysis Canonical correlation analysis
The table is based on characterization of variables as described by Hair et al. (7). Italicized tools are briefly described in the text. Details on these tools and others are provided by Hair et al. (7).
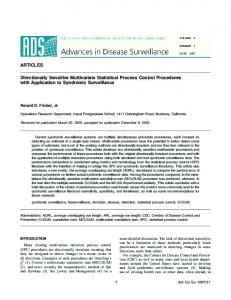
TABLE 3. A general guide to choosing multivariate statistical tools based on nature of interdependent variablesa Nature of variables
Assess group differences and variable contribution
Describe/predict the relationship between two sets of variables
Tools briefly described in the text are italicized.
Tools Principal component analysis Principal coordinate analysis Correspondence analysis Nonmetric multidimensional scaling Factor analysis Cluster analysis a
Metric only
Nonmetric only
Metric or nonmetric
+ + ... ... + ...
... ... + + ... ...
... ... ... ... ... +
+ Signifies usage of the tool. Further details on each listed procedure are provided by Hair et al. (7) and James and McCulloch (9). Vol. 94, No. 9, 2004
1005
al. (16) used correspondence analysis to characterize the relationship of 38 plant injury levels and five yield loss levels in rice crop production in tropical Asia, and identified four broad groups of injury corresponding to four major yield loss categories. Similarly, Forbes and Davet (5) employed correspondence analysis to demonstrate an association of soybean root mycoflora with plant health variables dominated by a strong seasonal variation. Loreti et al. (12) investigated the genomic variability of 66 isolates of Xanthomonas arboricola pv. juglandis from different geographic origins by analyzing the proximities among amplified fragment length polymorphic banding patterns using correspondence analysis. Mahuku et al. (13) characterized genetic variability among 141 Canadian isolates of Phytophthora infestans based on mating type, glucose-6-phosphate allozyme (Gpi), and random amplified polymorphic DNA (RAPD) banding patterns, and response to the fungicide metalaxyl. Correspondence analysis of RAPD banding patterns provided a separation of the isolates into 21 groups that were different from groups defined by mating type, Gpi allozyme profile, and response to metalaxyl. The analysis has been employed commonly in population genetic studies. Canonical correlation. The goal of canonical correlation is to describe the association between two sets of variables. For example, it may be desired to relate differences in pathogenic microflora at a given geographical location to differences in botanical composition or environmental/edaphic conditions at the same location. Schlosser et al. (17), working on rice blast (caused by Pyricularia grisea) in six upland rice cultivars, used canonical correlation to characterize the relationship between plant morphological variables (plant height, leaf length, leaf area, and plant growth rate) and disease variables (lesion densities and lesion types). In a comparative study of the effects of organic and synthetic soil amendments on soil microbial communities and soil physical and chemical properties, Bulluck et al. (1) applied canonical correlation analysis and found significant correlation between the set of variables describing biological communities and the set of variables describing soil physical and chemical properties. An alternative to canonical correlation analysis is redundancy analysis, which aims at measuring the percentage of variation in a set of variables (considered singly) that is accounted for by the other set of variables (considered collectively). This determination is achieved by regressing each variable from one set on all variables in the other set. Folman et al. (4) used redundancy analysis to describe the relationship of carbon source utilization profiles of 20 clusters of rhizobacteria to nine root tissue types consisting of three root regions (tip, intermediate, and base of root) sampled at three developmental stages (seedling, vegetative, and generative). The type of root samples was shown to account for 47% of the variance in the abundance of bacteria from different clusters. In summary, multivariate statistical tools are useful in unraveling patterns in multidimensional data from phytopathological studies especially in epidemiology, ecology, pathogen population biology, and disease management. As shown in Table 1, multivariate statistical tools are diverse in their objectives, and a few were succinctly described, namely discriminant, MANOVA, correspondence, and canonical correlation. Multivariate statistical methods should be explored and incorporated in phytopathological research because of their potential for providing a holistic insight into disease epidemics. With the development of computer
1006
PHYTOPATHOLOGY
technology, more user-friendly multivariate statistical packages may be designed and become available to plant pathologists for analyzing patterns from multivariable data. LITERATURE CITED 1. Bulluck, L. R., Brosius, M., Evanylo, G. K., and Ristaino, J. B. 2002. Organic and synthetic fertility amendments influence soil microbial, physical and chemical properties on organic and conventional farms. Appl. Soil Ecol. 19:147-160. 2. Chakraborty, S., Thomas, M. R., and Ellis, N. 1996. A multivariate analysis of pathogenic variation in Colletotrichum gloeosporioides infecting the tropical pasture legume, Stylosanthes scabra. Phytopathology 86:283-289. 3. Evans, N., McRoberts, N., Hitchcock, D., and Marshall, G. 1997. Identification of the determinants of host resistance and pathogenicity in interactions between Alternaria linicola Groves & Skolvo and Linum usitatissimum L accessions using multivariate analyses. Ann. Appl. Biol. 130:537-547. 4. Folman, L. B., Postma, J., and Van Veen, J. A. 2003. Inability to find consistent bacterial biocontrol agents of Pythium aphanidermatum in cucumber using screens based on ecophysiological traits. Microbiol. Ecol. 45:72-87. 5. Forbes, G. A., and Davet, P. 1991. Association of soybean root mycoflora with root nodulation, root necrosis and plant fresh weight. Ann. Appl. Biol. 118:533-541. 6. Golinski, P., Kacmarek, Z., Kiecana, I., Wisniewska, H., Kaptur, P., Kostecki, M., and Chelkowski, J. 2002. Fusarium head blight of common Polish winter wheat cultivars—Comparison of effects of Fusarium avenaceum and Fusarium culmorum on yield components. J. Phytopathol. 150:135-141. 7. Hair, J. F., Jr., Anderson, R. E., Tatham, R. L., and Black, W. C. 1998. Multivariate Data Analysis. 5th ed. Prentice Hall, Englewood Cliffs, NJ. 8. Hennessy, G. G., de Milliano, W. A. J., and McLaren, C. G. 1990. Influence of primary weather variables on sorghum leaf blight severity in southern Africa. Phytopathology 80:943-945. 9. James, F. C., and McCulloch, C. E. 1990. Multivariate analysis in ecology and systematics: Panacea or pandora’s box. Annu. Rev. Ecol. Syst. 21:129-166. 10. Johnson, D. A., Alldredge, J. R., and Vakoch, D. L. 1996. Potato late blight forecasting models for the semiarid environment of south-central Washington. Phytopathology 86:480-484. 11. Kenkel, N. C., Derksen, D. A., Thomas, A. G., and Watson, P. R. 2002. Multivariate analysis in weed science research. Weed Sci. 50:281-292. 12. Loreti, S., Galleli, A., Belisario, A., Wajnberg, E., and Corazza, L. 2001. Investigation of genomic variability of Xanthomonas arboricola pv. juglandis by AFLP analysis. Eur. J. Plant Pathol. 107:583-591. 13. Mahuku, G., Peters, R. D., and Daayf, F. 2000. Random amplified polymorphic DNA (RAPD) analysis of Phytophthora infestans isolates collected in Canada during 1994 to 1996. Plant Pathol. 49:252-260. 14. Noe, J. P., and Barker, K. R. 1985. Relation of within-field spatial variation of plant-parasitic nematode population densities and edaphic factors. Phytopathology 75:247-252. 15. Press, S. J., and Wilson, S. 1978. Choosing between logistic regression and discriminant analysis. J. Am. Stat. Assoc. 73:700-705. 16. Savary, S., Willocquet, L., Elazegui, F. A., Castilla, N. P., and Teng, P. S. 2000. Rice pest constraints in tropical Asia: Quantification of yield losses due to rice pests in a range of production situations. Plant Dis. 84:357369. 17. Schlosser, I., Kranz, J., and Bonman, J. M. 2000. Characterization of plant type and epidemiological development in the pathosystem “upland rice/rice blast” (Pyricularia grisea) by means of multivariate statistical methods. J. Plant Dis. Prot. 107:12-32. 18. Stevens, J. 1992. Applied Multivariate Statistics for the Social Sciences. Lawrence Erlbaum, Hillsdale, NJ. 19. Weinfurt, K. P. 1995. Multivariate analysis of variance. Pages 245-276 in: Reading and Understanding Multivariate Statistics. L. G. Grimm and P. R. Yarnold, eds. APA, Washington, D.C. 20. Workneh, F., van Bruggen, A. H. C., Drinkwater, L. E., and Shennan, C. 1993. Variables associated with corky root and Phytophthora root rot of tomatoes in organic and conventional farms. Phytopathology 83:581-589.