p. 74 Finding the Optimal Path | p. 82 Reconfigurable Supercomputing
VOL. 13, NO. 1
JANUARY/FEBRUARY 2011
cise.aip.org
www.computer.org/cise/
HURRICANE PREDICTION
HWRFx: Improving Hurricane Forecasts with High-Resolution Modeling Using the hurricane weather research and forecasting experimental modeling system (HWRFx), researchers examined the impact of increased model resolution on system performance in forecasting a select sample of tropical cyclones from the 2005 and 2007 hurricane seasons.
T
he National Oceanographic and Atmospheric Administration (NOAA) Hurricane Forecast Improvement Project (HFIP) aims to double the accuracy for tropical cyclone (or storm) track and intensity forecasts with a comprehensive 10-year plan (see www. nrc.noaa.gov/plans_docs/HFIP_Plan_073108.pdf ). Using enhanced observations, improved model guidance, and increased forecaster expertise, the average storm track forecast has reduced errors by about 50 percent in the past decade, but little progress has been made in reducing intensity forecast errors. The HFIP’s ambitious goal is to reduce track errors by an additional 50 percent and reduce intensity errors by the same amount over the next decade, emphasizing rapid intensification events, which often cause severe damage due to shorter warning time. To achieve this goal, the HFIP advocates various approaches, including research and development activities that provide
Research Division, we’ve been actively participating in the HFIP by building the hurricane weather research and forecasting experimental modeling system. HWRFx is a variant of the weather research and forecasting (WRF) nonhydrostatic mesoscale model (NMM) version 3.0.1 Recent research suggests that it’s possible to improve hurricane intensity forecasts using high model resolution (that is, grid spacing at or below 1 km horizontally) to adequately simulate the hurricane inner-core structures, such as the eyewall and rainbands.2,3 To help measure increased model resolution’s impact on hurricane intensity forecast, hurricane specialists at the National Hurricane Center (NHC) selected 69 cases from 10 different tropical cyclones during the 2005 and 2007 hurricane seasons for the HFIP high-resolution hurricane (HRH) tests. The storms they chose for
• an optimized observing capability for hurricane analysis and forecasting, • improved understanding of hurricane intensity change, and • an advanced hurricane numerical modeling system.
1521-9615/11/$26.00 © 2011 IEEE COPUBLISHED BY THE IEEE CS AND THE AIP
At the NOAA Atlantic Oceanographic and Meteorological Laboratory (AOML) Hurricane COMPUTING IN SCIENCE & ENGINEERING
Xuejin Zhang and Kao-San Yeh University of Miami
Thiago S. Quirino, Sundararaman G. Gopalakrishnan, Frank D. Marks, Jr., Stanley B. Goldenberg, and Sim Aberson US National Oceanic and Atmospheric Administration
THIS ARTICLE HAS BEEN PEER-REVIEWED.
13
Message file
Terrestrial data
GFS forecast
HWRF initial analysis
Namelist
Namelist
Triggering mechanism
WRF preprocessing system
REAL_NMM
WRF
Automatic FTP server
Graphics
Diapost
Working space
Data
Web portal
Diapost output
Figures
HWRFx website
WRF output
Mass storage system
Automated tropical cyclone forecasting (ATCF) file dissemination
Figure 1. Schematic flowchart of the hurricane weather research and forecasting experimental modeling system (HWRFx). Red indicates executable modules, blue indicates input data and data storage disk, and green indicates controlling scripts. The working space is the high-performance parallel file system on the Nehalem Jet cluster. The automated tropical cyclone forecasting (ATCF) file dissemination occurs through the cluster’s automatic email system. GFS stands for the Global Forecast System; WRF stands for the weather research and forecasting model; and Diapost stands for the diagnostic postprocessor.
2005 were hurricanes Emily, Katrina, Ophelia, Philippe, Rita, and Wilma; for 2007, they chose Felix, Humberto, Ingrid, and Karen. The 69 HRH cases are designed to examine various aspects of model performance, including • the capability to simulate events with rapid intensity change (as in Wilma, Rita, Karen, Katrina, and Humberto); • the impact of vertical wind shear on intensity evolution (as in Philippe, Rita, Karen, Katrina, and Ingrid); • the effects of eyewall replacement (as in Felix, Emily, Rita, and Wilma); • the effects of oceanic heating and cooling (as in Ophelia); and • the impact of terrain interaction on the landfall processes (as in Wilma, Katrina, and Rita). Here, we present a brief description of the HWRFx infrastructure and examine the impacts of increased model resolution on its performance with the 69 HRH cases.
The HWRFx Infrastructure
The HWRFx inherits the dynamic core from the WRF-NMM, but adopts different physical parameterizations for hurricane forecasting.4,5 14
HWRFx uses moving nests to focus the model’s highest horizontal resolution in the storm area.4,5 The HWRFx is equipped with operational capabilities for automated real-time hurricane forecasting; we performed real-time experiments during the 20085 and 2009 hurricane seasons. We designed the HWRFx modeling system as integrated software that mimics NOAA’s operational system on a smaller domain. The system resides on the Nehalem Jet (NJET) supercomputer, which is the HFIP’s dedicated Linux cluster with 3,520 processors located at the NOAA Earth System Research Laboratory (ESRL) in Boulder, Colorado. Figure 1 shows a flowchart of the HWRFx modeling system, which runs automatically during the hurricane season and has eight steps: • • • • • • • •
triggering mechanism, data acquisition, preforecast data processing, model forecast, postforecast data processing, graphics and visualization, product dissemination, and data archiving.
We built these components using various programming languages, including Java for control COMPUTING IN SCIENCE & ENGINEERING
logic design and database connectivity; shell scripting for data retrieval and file manipulation within a Linux environment; and Fortran 90 to develop the forecast model components. We built the triggering mechanism with Java and shell scripting. It waits for NHC hurricane forecasters to issue tropical cyclone messages and then triggers the forecast procedure as needed. NHC can issue up to four messages simultaneously, each describing the name, current location, and intensity of a potential (also known as invest) or active storm. The triggering mechanism uses prescribed parameters to prioritize storm simulations. The user provides a list of target cycles (such as 00, 06, 12, and 18 Coordinated Universal Time, or UTC), a list of target basins (such as North Atlantic and Northeast Pacific), and the maximum number of simulations per six-hour cycle. The user also specifies the priority for storm sorting (potential or active) by basin and intensity— following either NHC’s priorities or the sequence provided in a user-defined list. The system’s default is to perform two simulations every six-hour cycle and follow NHC’s priorities. Typically, this corresponds to simulating the storms that pose a direct threat to US coastal areas and Caribbean islands. Users can change priorities in real-time using the graphical user interface; they can also simulate multiple storms in parallel. The data acquisition component, designed with Java and shell scripts, runs automatically and in parallel with the triggering mechanism. It continuously retrieves the meteorological data sets required to perform the HWRFx forecasts. These data sets include initial time analyses from three sources: • the Global Forecast System (GFS) 126-hour forecast; • the Geophysical Fluid Dynamics Laboratory (GFDL) hurricane model; and • the hurricane weather research and forecasting (HWRF) model. The preforecast data processing consists of the WRF preprocessing system (WPS) and the REAL_NMM module. The WPS interpolates the initial and boundary conditions horizontally to the HWRFx’s rotated latitude-longitude grid; the REAL_NMM module further interpolates the data vertically to the terrain-following 42 sigmapressure hybrid levels used in the HWRFx model integration. These modules also derive the other meteorological fields required to initialize the HWRFx forecast. JANUARY/FEBRUARY 2011
The model forecast calculates the increments of meteorological variables (such as wind, temperature, specific humidity, hydrostatic pressure depth, nonhydrostatic pressure, and total cloud water condensate) in small time steps, and integrates those numerous increments to predict the evolution of the atmosphere, including the storm itself. The initial data are thus advanced from the initial time to the forecast time with a series of small time steps to predict the atmosphere’s future state. In addition to the prognostic variables that are evolved through the atmosphere’s governing equations, the model also calculates numerous diagnostic variables and outputs them in the network Common Data Form (netCDF) format, which lets users easily compare the model simulation with the observations. The model executes postforecast data processing using HRD’s diagnostic postprocessor (Diapost). Diapost reads the model’s netCDF output and performs horizontal interpolation. It thereby transforms the variables from the model’s native, staggered, rotated latitude-longitude grid to several unstaggered grids typically used in hurricane model diagnostics, including the regular latitudelongitude grid and a storm-centered cylindrical grid. Diapost also performs vertical interpolation to transform the model output from the terrainfollowing sigma-pressure levels to other commonly used vertical levels, such as constant pressure or constant altitude. The Diapost output is encoded for diagnostics and visualization using the grid analysis and display system (Grads). Diapost also calculates the model-forecasted storm’s track and intensity, and encodes the forecast into the automated tropical cyclone forecasting (ATCF) format for evaluation. We built the graphics and visualization component using the Grads scripting language. Upon completing graphics generation, the product dissemination component automatically sends all graphics to a database. The graphics are then uploaded to the HWRFx website (https://storm. aoml.noaa.gov/hwrfx) for model evaluation. Finally, the data archiving module uses the mass storage system (MSS) to permanently back up the model output onto tapes. High-resolution real-time hurricane forecasting requires extensive computing resources to execute the extremely complicated computation in an operationally constrained time window. To support next-generation model development for hurricane prediction, the HFIP significantly augmented its computing capacity in August 2009. The previous Linux cluster, Harpertown 15
Table 1. Domain configurations for study of increased horizontal model resolution. Configuration
Low-resolution outer domain
Low-resolution inner domain
High-resolution outer domain
High-resolution inner domain
Resolution
27 km
9 km
9 km
3 km
Dimensions (degrees)
57.24 × 55.62
9.48 × 7.98
57.0 × 55.5
5.80 × 5.78
Grid points
160 × 310
80 × 134
476 × 926
146 × 290
Jet (HJET), had 2,016 cores capable of delivering up to 22 teraflops; HFIP upgraded this with Intel’s latest Xeon chips to the much more powerful NJET, which delivers up to 40 Tflops with 3,520 cores. This upgrade reduced model execution time by a factor of approximately three, making possible real-time operation of the HWRFx five-day forecasts with a 3-km grid increment for the inner domain and 9 km for the outer domain. Each forecast currently takes about two hours of wall clock time with 256 cores.
Impacts of Increased Resolution
To demonstrate the impacts of increased horizontal resolution on the HWRFx forecast, we tested the 69 HRH cases with the original 27/9-km lowresolution and the new 9/3-km high-resolution domain configurations (see Table 1). Both configurations used 42 hybrid sigma-pressure levels with the model top at 50 hectopascals (hPa) (approximately 20 km). The atmospheric model is initialized with the operational GFDL initial condition,6 which we constructed with an idealized vortex on the largescale environmental flow from the GFS analysis. We perform each forecast for 126 hours of simulation time, during which the outer domain’s lateral boundaries are updated with the GFS forecast data at 1º latitude-longitude grid increment every three hours. The lower boundary condition (that is, the sea surface temperature, or SST) is prescribed with the SST from the GFS analysis, which we set at the beginning of each forecast and hold constant throughout the forecast. The land surface model is also initialized with the GFS analysis. We then use the ATCF files—generated by Diapost with the inner-domain data—to verify against the NHC best track data, which gives the best estimates of the tropical storm positions and intensities. We developed the best track data using all available observations of tropical cyclones by NHC hurricane specialists after the hurricane season. Figure 2 shows the track and intensity verifications for the HWRFx forecasts. The track errors are calculated as the great-circle distance between the model and observed storm centers every 16
12 hours. We define the along-track vector as the vector from the storm position six hours prior to the verification time to the vector at verification time based on NHC’s hurricane best track data. We define the cross-track vector as the vector perpendicular to the along-track vector, where the positive and negative are to the right and left of the along-track vector, respectively. Further, the positive/negative cross-track bias represents the forecast tracks that are to the right/left of the best track, and the positive/negative along-track bias represents the forecast motion of a storm that is faster/slower than the best track estimated motion. Generally, both cross- and along-track errors of 3-km forecasts are smaller than errors of 9-km forecasts, except at the 12-hour forecast for the cross-track error and the 108 h for the along-track error. The biases of 9-km forecasts tend to be slow (negative along-track bias) and to the right (positive cross-track bias), while biases of 3-km forecasts are evenly distributed around zero. The high-resolution forecasts demonstrate a reduction in the absolute track errors versus the low-resolution forecasts at all forecast time intervals (see Figure 2c). Overall, the along-track errors contribute more to absolute track errors than cross-track errors. However, results for the frequency of superior performance (FSP), a measure (in percent) of how often one model produces better forecasts than the other, are mixed (see Tables 2 and 3). FSP compares the forecasts with different resolutions based on the absolute errors. The confidence level is based on the sample size adjusted for 24-hour serial correlation time.7 The track forecast performance implies, as expected, that the track is dominated by the synoptic flow patterns, which were similarly forecasted at both resolutions (not shown). In contrast, using the high-resolution model reduces the absolute intensity errors in comparison to the low-resolution model, with the exception of the 84-hour forecast interval (see Figure 2d). The intensity biases are apparently much better balanced over the forecast period with the highresolution model. The high-resolution model has a smaller negative bias than the low-resolution COMPUTING IN SCIENCE & ENGINEERING
600
600
300 200 100 0 –100
12
48
36
24
60
72
Forecast length (hours)
Error (kilometers)
Absolute, 3 km
500
Absolute, 9 km
300 200 100 24
36
(c)
200 100
–100
12
24
36
(b)
400
12
300
0
96 108 120
84
600
0
400
Error (kilometers)
400
48 60 72 84 96 108 120 Forecast length (hours)
AlongTRK error, 9 km AlongTRK bias, 9 km
AlongTRK error, 3 km AlongTRK bias, 3 km
500
Intensity error (meters/second)
Error (kilometers)
500
(a)
CrossTRK error, 9 km CrossTRK bias, 9 km
CrossTRK error, 3 km CrossTRK bias, 3 km
48
60
72
84
96 108 120
Forecast length (hours) 20 15 10 5 0 –5
1
2
3
4
–10 –15
5
6
7
Absolute, 3 km Bias, 3 km
12
24
36
(d)
8
9
10
Absolute, 9 km Bias, 9 km
48 60 72 84 96 108 120 Forecast length (hours)
Figure 2. Track and intensity homogeneous verifications for the HWRFx forecasts. (a) Absolute track errors and west-east and south-north track biases. (b) Absolute intensity errors and biases (ms−1). (c) Absolute track errors (km). (d) Absolute intensity errors and biases (ms−1). Table 2. The frequency of superior performance and confidence levels for track error. Resolution
12 h
24 h
36 h
48 h
60 h
72 h
84 h
96 h
108 h
120 h
HWRFx 3 km
47.0
65.1
57.3
58.8
47.2
58.3
51.2
46.2
46.9
44.0
HWRFx 9 km
53.0
34.9
42.7
41.2
52.8
41.7
48.8
53.8
53.1
56.0
Cases
66
63
62
57
53
48
43
39
32
25
Confidence
66.6
99.6
93.2
92.2
89
95.9
89.1
78.9
64.5
61
Adjusted cases
60.5
58
57
52.5
48.5
43.5
39
35.8
30.2
24
Table 3. The frequency of superior performance and confidence levels for absolute error and bias. Resolution
12 h
24 h
36 h
48 h
60 h
72 h
84 h
96 h
108 h
120 h
HWRFx 3 km
62.1
69.8
53.2
65.8
46.2
45.8
46.5
55.1
54.7
60.0
HWRFx 9 km
37.9
30.2
46.8
34.2
53.8
54.2
53.5
44.9
45.3
40.0
Cases
66
63
62
57
53
48
43
39
32
25
Confidence
99.1
100
72.4
89.6
82.6
64.5
69.2
72.3
61
57.8
Adjusted cases
60.5
58
57
52.5
48.5
43.5
39
35.8
30.2
24
model prior to 60 hours, but it changes to a positive bias at later forecast times. This demonstrates that the high-resolution model tends to intensify JANUARY/FEBRUARY 2011
storms more than the low-resolution model. As Figure 2d shows, the frequency of superior performance results for intensity errors indicate that 17
0.5 0.7 1.2 1.8 3.2 4.7 8.3 12. 22. 32. 57. 83. 147. 216.
(a)
(b)
1
(c)
10
20
40
60
(e)
80
100
(d)
0.1
2.5
13.0
25.0
51.0
127.0
(f)
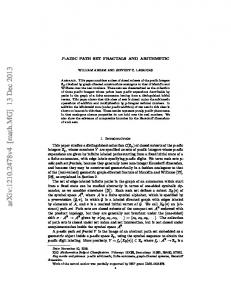
Figure 3. HWRFx’s forecast for Hurricane Wilma eyewall replacement compared to radar-estimated precipitation rate. The HWRFx 9/3-km resolution forecast was initiated at 1200 UTC 19 October 2005. The HWRFx precipitation rate (mm/hr) at (a) 12 hours, (b) 24 hours, (c) 30 hours, and (d) 36 hours into the forecast. Radar-estimated precipitation rate (mm/hr) from the NOAA P3 aircraft radar observation and Mexico National Meteorological Service (e) at 2014 UTC 20 October 2005 and (f) 1156 UTC 21 October 2005 (see www.srh.noaa.gov/tae/?n=research-zrpaper). Dashed circles indicate the approximate eyewall positions before and after the replacement process.
high-resolution forecasts also demonstrate general improvement over the low-resolution forecasts. The improvement in Hurricane Wilma’s simulated storm structure shows one advantage of increased model resolution. Wilma experienced a rapid intensification before 1200 UTC 19 October 2005, reaching a peak sustained wind speed of 82 ms−1 at around that time. The US Air Force reconnaissance observation indicated that Hurricane Wilma had an eye diameter of 3.7 km— the smallest ever observed—and experienced an eyewall replacement process before it made landfall, resulting in a much larger eye diameter (approximately 72 km) on 20 October (see www.nhc. noaa.gov/pdf/TCR-AL252005_Wilma.pdf ). Figure 3 shows the eyewall replacement phenomenon8,9 in the HWRFx high-resolution forecast initiated at 1200 UTC 19 October 2005. At 12 hours into the forecast, the model eyewall was small (Figure 3a); the second eyewall started to 18
form at approximately 24 hours (Figure 3b) and merged with the first eyewall at approximately 30 hours (Figure 3c). As Figure 3d shows, the first eyewall was replaced with the stronger and bigger eyewall 36 hours into the forecast. Compared to the radar-estimated precipitation rate (www. srh.noaa.gov/tae/?n=research-zrpaper) observed at 2014 UTC 20 October (Figure 3e) and at 1156 UTC 21 October (Figure 3f ), the HWRFx highresolution forecast successfully simulated the eyewall replacement process. Although the actual timing was somewhat faster, such a structural phenomenon had been captured only marginally in the low-resolution forecasts. This improvement in simulating fine-scale processes might have contributed to the intensity forecast accuracy. Further analysis on this is underway. We can also examine the model-simulated storm structure with the storm’s radius of maximum wind (RMW), which is determined with COMPUTING IN SCIENCE & ENGINEERING
100 H*WIND analysis HWRFx–GFDL IC, 3 km HWRFx–GFDL IC, 9 km
90
Cumulative probability (percent)
80 70 60 50 40 30 20 10 0
0
10
20
30
40
50
60
70
80
90 100 110 120 130 140 150 160 170 180 190 200
Radius of maximum wind (kilometers)
Figure 4. Cumulative Distribution Function (CDF) of the radius of maximum wind at 10 meters above the ground for the HWRFx forecasts, compared with the H*Wind analysis. The CDFs are shaded for one standard deviation of probability.
the azimuthal average of the horizontal wind at 10 meters above the ground (10-m wind) relative to the storm center. Figure 4 shows the Cumulative Distribution Function (CDF) of the HWRFx forecasts’ RMW10 compared with those of HRD’s H*Wind analysis,11 where both RMW frequencies are determined in 1-km bins. Excluding the samples in which the storm centers were located over land, we used 196 H*Wind analyses and 1,320 and 1,377 low- and high-resolution model samples, respectively, from 69 forecast cycles to calculate the distribution functions. Figure 4 shows the CDF of RMW. The median RMW is about 34 km for the H*Wind analysis, and 52 km and 62 km for the high- and low-resolution HWRFx forecasts, respectively. The H*Wind analysis is distributed over 17 to 68 km within one standard deviation of normal distribution (that is, from the 16th to 84th percentile). For the high- and low-resolution models, the simulated RMW within one standard deviation is distributed over 31 to 94 km and 39 to 98 km, respectively. As expected, this indicates that the storm sizes are better predicted with the high-resolution forecasts than with the low-resolution forecasts. Further analysis indicates that standard deviations are 27, 34, and 32 km and mean RMWs are 41, 58, and 66 km for H*Wind, high-resolution, and low-resolution, respectively. The differences in standard deviation are within two model grid JANUARY/FEBRUARY 2011
increments between analysis and forecasts. Standard deviations suggest that the model forecasts could more accurately reproduce the RMW distributions. However, the model forecasts exhibit systematic biases of mean RMWs. The potential implication of the improved storm-size prediction in intensity forecasts beckons further evaluation.
T
he HWRFx modeling system is an integration of advanced techniques in numerical modeling and computer engineering that’s useful for both research and operational needs. The specifically designed high-resolution hurricane tests suggest that the increase of horizontal resolution has positive impacts on the accuracy of both track and intensity forecasts with more realistic structural evolution, such as of the eyewall replacement process and storm size. This is a very encouraging start. More studies related to resolution impact are underway. However, our study’s limited number of cases prevents a full evaluation of the results’ statistical significance. Further efforts are needed for additional improvements on both track and intensity forecasts. Our hope is that the storm’s improved representation through increasing horizontal resolution will provide the foundation for additional reduction of track and intensity forecast errors by introducing better initialization and representation of 19
physics in the future. Because the extremely complicated dynamic and physical processes occur mainly in the hurricane’s inner core, a thorough understanding of inner-core structure and its application to hurricane modeling and data assimilation could be one of the most important keys to achieving the HFIP’s ambitious goals.
Acknowledgments The US National Oceanographic and Atmospheric Administration’s Hurricane Forecast Improvement Project sponsored this project. We thank James Franklin from the National Hurricane Center for providing the verification software we used to compute along- and cross-track errors and biases (www.nhc. noaa.gov/verification/pdfs/Verification_2009.pdf).
References 1. Z.I. Janjic, J.P. Gerrity Jr., and S. Nickovic, “An
2.
3.
4.
5.
6.
7.
8.
9.
10.
20
Alternative Approach to Nonhydrostatic Modeling,” Monthly Weather Rev., vol. 126, no. 5, 2001, pp. 2599–2620. C. Davis et al., “Prediction of Landfalling Hurricanes with the Advanced Hurricane WRF Model,” Monthly Weather Rev., vol. 136, no. 6, 2008, pp. 1990–2005. R. Rotunno et al., “Large-Eddy Simulation of an Idealized Tropical Cyclone,” Bulletin Am. Meteorological Soc., vol. 90, no. 12, 2009, pp. 1783–1788. S.G. Gopalakrishnan et al., “The Experimental HWRF System: A Study on the Influence of Horizontal Resolution on the Structure and Intensity Changes in Tropical Cyclones using an Idealized Framework,” Monthly Weather Rev., accepted, 2010; doi:10.1175/2010MWR3535.1. K.S. Yeh et al., “Performance of the Experimental HWRF in the 2008 Hurricane Season,” Natural Hazards, submitted, 2010. Y. Kurihara, R.E. Tuleya, and M.A. Bender, “The GFDL Hurricane Prediction System and Its Performance in the 1995 Hurricane Season,” Monthly Weather Rev., vol. 126, no. 5, 1998, pp. 1306–1322. S.D. Aberson and M. DeMaria, “Verification of a Nested Barotropic Hurricane Track Forecast Model (ViCBAR),” Monthly Weather Rev., vol. 122, no. 12, 1994, pp. 2804–2815. H.E. Willoughby, J.A. Clos, and M.B. Shoreibah, “Concentric Eyewalls, Secondary Wind Maxima, and the Evolution of the Hurricane Vortex,” J. Atmospheric Science, vol. 39, no. 2, 1982, pp. 395–411. R.A. Houze et al., “Hurricane Intensity and Eyewall Replacement,” Science, vol. 315, no. 5816, 2007, pp. 1235–1239. E. Parzen, “On Estimation of a Probability Density Function and Mode,” Annals Math. Statistics, vol. 33, no. 3, 1962, pp. 1065–1076.
11.
M.D. Powell et al., “The HRD Real-Time Hurricane Wind Analysis System,” J. Wind Eng. Industrial Aerodynamics, vols. 77–78, 1998, pp. 53–64.
Xuejin Zhang is an assistant scientist at the University of Miami’s Cooperative Institute for Marine and Atmospheric Studies (CIMAS). His research interests include numerical modeling and model development, hurricane forecasts, land-air-sea interaction, numerical weather prediction, numerical methods, and parallel computing. He is currently developing the hurricane weather research forecasting model (HWRF) under the US National Oceanic and Atmospheric Administration’s Hurricane Forecast Improvement Project (HFIP) in collaboration with scientists at the Atlantic Oceanographic and Meteorological Laboratory’s Hurricane Research Division. Zhang has a PhD in atmospheric science from North Carolina State University. He is a member of the American Meteorological Society and American Geophysical Union. Contact him at
[email protected]. Kao-San Yeh is a scientist at the University of Miami’s Cooperative Institute for Marine and Atmospheric Studies (CIMAS). His research interests include numerical methods for geophysical fluid-dynamics modeling with special focus on the application to hurricane track and intensity prediction. Yeh has a PhD atmospheric science from Purdue University. Contact him at
[email protected]. Thiago Quirino is an IT specialist at the US National Oceanic and Atmospheric Administration’s Hurricane Research Division and a doctoral student in electrical and computer engineering at the University of Miami, Florida. His research interests include applied evolutionary search and optimization, data mining, and numerical modeling of tropical cyclones. Quirino has an MS in electrical and computer engineering from the University of Miami. He is a student member of the IEEE Engineering Society. Contact him at
[email protected]. Sundararaman Gopalakrishnan is a meteorologist in the US National Oceanic and Atmospheric Administration’s Hurricane Research Division and principal architect of the hurricane weather research and forecasting (HWRF) system. His research interests include simulating complex, nonlinear, scale-interacting systems from dry thermals to hurricanes and examining their development-related mesoscale structures, evolution, and mechanisms; testing theories, hypotheses and various near-surface model physical representations; and interpreting such systems’ modeled and observed behavior. Gopalakrishnan
COMPUTING IN SCIENCE & ENGINEERING
has a PhD in atmospheric science from the Indian Institute of Technology Delhi, India. Contact him at
[email protected]. Frank Marks is an expert in tropical cyclones and leader of the US National Oceanic and Atmospheric Administration’s Hurricane Forecast Improvement Program and director of NOAA’s Hurricane Research Division. He leads the development of NOAA’s Hurricane Forecast Improvement Project (HFIP) and is also an adjunct professor in the Department of Meteorology and Physical Oceanography at the University of Miami, as well as a fellow of marine and atmospheric research at both the University of Miami and University of Hawaii at Manoa. His research interests include analyzing meteorological remote sensing data sets (such as microwave radar and radiometer), particularly in tropical cyclones. Marks has an ScD in meteorology from the Massachusetts Institute of Technology. Contact him at
[email protected]. Stanley B. Goldenberg is a research meteorologist with the US National Oceanic and Atmospheric Administration’s Hurricane Research Division. His research interests include numerical hurricane-track
prediction models and next-generation hurricane track and intensity forecast models; he’s also done extensive research into the physical mechanisms responsible for the connection between El Niño and Atlantic hurricane activity and is an expert on various climatic factors that influence Atlantic hurricane activity variability. He is a lead author of NOAA’s Seasonal Hurricane Outlooks for the Atlantic basin and was a corecipient of NOAA’s Bronze Medal for that work. Goldenberg has an MS in meteorology from Florida State University. Contact him stanley.
[email protected]. Sim Aberson is a meteorologist at the US National Oceanic and Atmospheric Administration’s Hurricane Research Division, where he first began working as a high school student in 1981. His research interests are in hurricanes, predictability, targeted observations, and data assimilation. Aberson has a PhD in atmospheric sciences from the University of Maryland-College Park. Contact him at sim.
[email protected]. Selected articles and columns from IEEE Computer Society publications are also available for free at http://ComputingNow.computer.org.
Call for Articles IEEE Software seeks practical, readable articles that will appeal to experts and nonexperts alike. The magazine aims to deliver reliable information to software developers and managers to help them stay on top of rapid technology change. Author guidelines: www.computer.org/ software/author.htm Further details:
[email protected]
www.computer.org/software
JANUARY/FEBRUARY 2011
21