Page 1 Relationship-Based Clustering and Visualization for High ...
Recommend Documents
interactive exploration and hypermedia are elaborated. Three technical levels of visualization. i.e. hardware/software, visualization tools and applications, are ...
Applied Software Engineering Research ... capabilities of IT data management systems are very mature, they lack advanced analytic capabilities beyond.
Apr 28, 2017 - 5th International Symposium on Digital Forensic and Security. âPetru Maiorâ ... Examined Android permissions, their groups and formal.
... Fairfax, VA 22030, USA. E-mail: [email protected]. Vijay Raghavan. Center for Advanced Computer Studies. The University of Louisiana at Lafayette, Lafayette, ...
French Revolution. Edmund: Yes, Louis XV ... Figure 1b: The chat timeline display according to the dialogue dissection in Figure 1a. As one can observe from ...
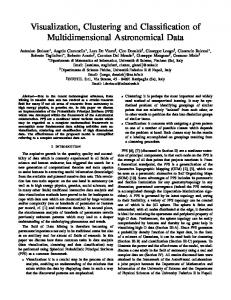
an implementation of the Probabilistic Principal Surfaces (PPS) which was ..... [8] A.P. Dempster, N.M. Laird, D.B. Rubin, Maximum-Likelihood from. Incomplete ...
1. Integrating Data Clustering and Visualization for the Analysis of 3D Gene Expression Data. Oliver Rübel, Gunther H. Weber, Member, IEEE Computer Society, ...
Fernando Crespo, Georg Peters, and Richard Weber. Abstract ... 80335 Munich, Germany e-mail: georg.peters (acs, hm.edu. R. Weber ... 40 F. Crespo et al.
visualization plot. Hierarchical models organize the data visualization at different levels, and their ultimate goal is displaying a representation of the entire data ...
Aug 26, 2010 - Diego H Milone1, Georgina S Stegmayer2*, Laura Kamenetzky3, ...... Lippman Z, Semel Y, Zamir D: An integrated view of quantitative trait.
Oct 22, 2001 - clustering data streams, which is important in the analysis a variety of .... hierarchical technique is CURE 14], which represents a cluster by ...
and digitoxin as an internal standard. Creverse phase glumn all gradient elu- tions Acetonitrile with 0.1 % Orthophosphoric acid and Water with 0.1 % Ortho-.
Oct 24, 2017 - Sixth Form Mentor Training. Tuesday 7 ... in a fun way. The day began ... The form tutors also joined in
Y20s and Gd2O, represent good host materials for Eu" activated phosphor materials, and have been widely studied for application as red light emitting sources ...
medium-sized, mainly London-based independent production companies (many of ... supply firms manufacture and/or supply the hardware and software which.
May 26, 2015 - into our tool for automated page object generation, APOGEN. Experimental .... We have applied APOGEN to six web applications and we have studied how different .... Correspondingly, only one Java page object can represent both of them (
CUYAHOGA HEIGHTS SCHOOLS High School. 4820 East 71st Street - Cuyahoga Heights, Ohio 44.125â1095 216-429-5707 www.cuyh
Visualization of colocations. Application. Conclusion. Application Context. New Caledonia. Exceptional biodiversity and caledonian lagoons declared a World.
The simple line graph or scatter plot has been used for visualization for hundreds of years. Perhaps they are the most widespred method of understanding the ...
Feb 20, 2015 - investments of a high yield debt separately managed account. The Treasurer ... The State of Connecticut r
High Availability Basics. • Before Clustering CAS ... HA is all about risk. □ Make a
list of ... JDBC and flat-file storage available for persistence. □ Details on ...
best practice from a number of related subdomains ... parallel rendering software such as NAG Iris. Explorer ... contact on the NGS Helpdesk so that user. 587 ...
The PoCluster is organized in DAG with subset relationship .... ever, unlike low dimensional data where each of the attributes is considered equally ..... Given the data matrix D, as defined above, we define a row cluster as a subset of ...... For ex
Mar 8, 2017 - Download full-text PDF. Journal of. V ... visualization of part of Java class diagrams and Web graphs are provided. We also conducted. usability ...
Page 1 Relationship-Based Clustering and Visualization for High ...
(Cluster Analysis; Graph Partitioning; High Dimensional; Visualization; Retail Customers; Text. Mining; Web-Log .... Each record corresponds to a store visit by a cus- tomer, so that ... ing an apple vs. buying a car, though clearly these are.