GeoFEM 2002-010
RIST/TOKYO GeoFEM Report Research Organization for Information Science & Technology
Li Chen, Issei Fujishiro and Kengo Nakajima
Parallel Visualization of Large-Scale Unstructured Geoscientific Data for the Earth Simulator
November 2002
GeoFEM 2002-010
RIST/TOKYO GeoFEM Report Research Organization for Information Science & Technology
Li Chen, Issei Fujishiro and Kengo Nakajima
Parallel Visualization of Large-Scale Unstructured Geoscientific Data for the Earth Simulator
November 2002
GeoFEM 2002-010 TITLE Parallel Visualization of Large-Scale Unstructured Geoscientific Data for the Earth Simulator
AUTHORS Li Chen (RIST) Issei Fujishiro (Ochanomizu University) Kengo Nakajima (RIST)
CONTACT PERSON Li Chen (
[email protected])
KEY WORDS AND PHRASES Parallel visualization, unstructured grids, large-scale geoscientific datasets, the Earth Simulator, parallel volume rendering, hybrid parallelization
ABSTRACT A scalable and high performance parallel visualization subsystem has been developed in GeoFEM for the Earth Simulator. As part of the Earth Simulator project in Japan, the subsystem is effective for the visualization of large-scale geoscientific data, and can be concurrently executed with computation subsystems on the same high-performance parallel computer. Moreover, several parallel visualization methods are available for large unstructured datasets, covering scalar, vector and tensor fields. Furthermore, a number of strategies are adopted in order to improve the parallel performance of the subsystem for the Earth simulator, including the three-level hybrid parallelization and dynamic load balancing. Good visualization images and high parallel performance have been obtained on a Hitachi SR8000 for large unstructured geoscientific datasets, thus demonstrating the feasibility and effectiveness of the proposed methods for the Earth Simulator.
REPORT DATE
TOTAL NO. OF PAGES
November 5th, 2002
15
ANY OTHER IDENTIFYING INFORMATION OF THIS REPORT
Research Organization for Information Science & Technology (RIST) 2-2-54, Nakameguro, Meguro-ku Tokyo, 153-0061, Japan TEL: +81-3-3712-5321 FAX: +81-3-3712-5552 http://geofem.tokyo.rist.or.jp/ Copyright©2002 Research Organization for Information Science & Technology (RIST)
Parallel Visualization of Large-Scale Unstructured Geoscientific Data for the Earth Simulator Li Chen (1) Issei Fujishiro (1) (2) Kengo Nakajima (1) (1) Research Organization for Information Science & Technology, 2-2-54, Nakameguro, Meguro-ku, Tokyo, 153-0061, Japan (e-mail: {chen, nakajima} @tokyo.rist.or.jp; phone: +81-3-3436-5271). (2) Ochanomizu University, Tokyo, 112-8610, Japan (e-mail:
[email protected]; phone: +81-3-5978-5700).
Abstract A scalable and high performance parallel visualization subsystem has been developed in GeoFEM for the Earth Simulator. As part of the Earth Simulator project in Japan, the subsystem is effective for the visualization of large-scale geoscientific data, and can be concurrently executed with computation subsystems on the same high-performance parallel computer. Moreover, several parallel visualization methods are available for large unstructured datasets, covering scalar, vector and tensor fields. Furthermore, a number of strategies are adopted in order to improve the parallel performance of the subsystem for the Earth simulator, including the three-level hybrid parallelization and dynamic load balancing. Good visualization images and high parallel performance have been obtained on a Hitachi SR8000 for large unstructured geoscientific datasets, thus demonstrating the feasibility and effectiveness of the proposed methods for the Earth Simulator.
1 Introduction In 1997, the Science and Technology Agency of Japan began a five-year project to develop a new supercomputer, the Earth Simulator (ES) [1]. The goal is the development of both hardware and software for predicting various earth phenomena by computational simulations using a supercomputer. It is very helpful for solving global environmental problems and taking measures against natural disasters. In addition, it is also expected to be a breakthrough in bridging the geoscience and information science fields. The hardware of the ES project the ES itself, was completed successfully in March, 2002. The ES has shared memory symmetric multiprocessor (SMP) cluster architecture, and consists of 640 SMP nodes connected by a high-speed network (data transfer speed: 12.3 GB). Each node contains eight vector processors with a peak performance of 8GFLOPs and a high-speed memory of 2 GB for each processor. According to the Linpack benchmark test, the ES is the fastest supercomputer in the world, having a peak performance of 35.61 TFLOPs [2]. As an important part of the ES Project, GeoFEM [3] provides a large-scale finite element analysis platform for solid earth simulation. The present study was conducted as a
0
part of GeoFEM with a goal of developing a parallel visualization subsystem for solid earth simulation. As the fastest supercomputer in the world, the ES generates a surprisingly large amount of data everyday. In order to provide users with a visual exploration environment for various types of extremely large 3D datasets arising from geoscientific simulation on the ES, a high-performance parallel visualization system is required which can transform extremely large data sets into high-quality images. Unfortunately, most of commercial visualization software systems work well for relatively small datasets, but often fail for extremely large datasets due to the lack of parallel performance and the limitations for some special hardware. The development of parallel visualization software according to the hardware architecture of the ES, geoscientific data features, and the requirements of the ES users is necessary. This presents a challenge due to the following factors: • Complicated grids in geoscientific simulation including unstructured, hierarchical and/or hybrid of tetrahedral, hexahedra, prism; • Extremely larg data size with time-varying large timesteps; • Severa;kinds of physical attributes covering scalars, vectors and tensors; • No graphics hardware on the ES. Although ES is the fastest supercomputer, the graphics processing ability of ES is rather limited. We have been developing a visualization subsystem in GeoFEM for the ES, which has the following features: • Concurrent with computation on the same supercomputer; • Several visualization techniques are developed, for scalar, vector and tensor data fields, in order to reveal the features of datasets with respect to various aspects of the data; • All the modules have been parallelized, and high parallel performance has been obtained; • All the modules are based on unstructured grids, and can be extended to hybrid grids; • A three-level hybrid parallel programming model was adopted in the modules in order to obtain high speedup performance on the ES; • Multiple-feature analysis techniques are adopted for data mining of large-scale datasets. Three aspects are discussed in the present paper. The first is concurrent with computation due to extremely large simulations on the ES. The second is numerous visualization methods available in the subsystem. The third is effective parallel performance optimization according to the architecture of the ES hardware. In the following sections, we will describe in detail these three aspects and the present results obtained using the proposed methods.
2 Concurrent with Computation Simulation on the ES is expected to be extremely large-scale, possibly up to the petabyte-scale. Transferring such massive amounts of data to client machines or saving the data to disks is very difficult and time-consuming. In addition, visualization on client machines is impossible due to memory limitations. Therefore, we implemented the proposed subsystem so as to perform visualization concurrently with computation on the 1
same high-performance parallel computer, which enables the extremely large memory of the computational server to be used to its fullest extent in order to provide visualization and avoid the limitations of storage capacity for large-scale data. Two concurrent modes are provided in the subsystem: server-client mode and serveronly mode. server-client mode: In this mode, on the computational server, the users only specify, the visualization methods such as isosurface, streamlines, and corresponding parameters, in the batch files. Then visualization modules generate geometric primitives on the server and output them to clients. On each client, sers can set viewing, illumination, shading parameters, and so on, and display the graphic primitives by the GPPView viewing software, which is also developed by the GeoFEM group [3]. Compared with the original computational results, the size of visualization results is usually reduced greatly, which can avoid to some extent the memory and storage problem on the clients. Moreover, a parallel simplification module (Nakamura, 2000[5]) was also developed to simplify the output graphic primitives according to the time requirement and the limitations of a client’s memory and storage space. However, if original computational data is too huge on the ES, it may be not available on the clients even after simplification. Therefore, we developed the second mode server-only mode. server-only mode: In the mode, the whole visualization process is executed on the computational server and images or a sequential of animation images are generated directly, whose size is independent of original data size. Because of no geometric information in this kind of output, re-calculation need be done on the computational server even if the users just want to change viewpoints. Therefore, this mode is only suitable for extremely huge data visualization.
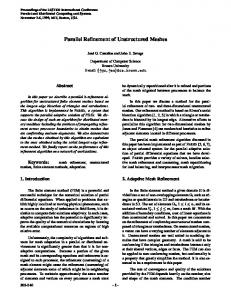
Figure 1: Framework of parallel visualization subsystem in GeoFEM.
Figure 1 shows the framework of the parallel visualization subsystem in GeoFEM. Computation modules read mesh data and control parameters, and start computation in a 2
time-step loop. Once computation modules finish one time-step computation, visualization modules will start immediately. For each time-step, one or more visualization methods can be adopted by users, and for each method different parameters can be set and multiple images or simplified patch files are output to the clients. For example, you can generate a sequence of volume rendering images from different viewpoints, or generate multiple isosurface patches for different iso-values. Since the computational part usually need spend more than several days to several months to finish a large simulation with a large number of time-steps, and we cannot save the large computational results on the disk, it is better to generate many images by different visualization methods and parameter settings to reveal the whole dataset from different aspects in one time, which can avoid the troubles of selecting suitable parameter settings for visualization methods. If users are not satisfied with some results, they can do feedback to revise the control parameters. On the ES, users can use the server-client mode to find better visualization methods and parameters by testing some small datasets and small time-steps. Then the server-only mode is used to finish the visualization for large simulation. In order to improve the quality of visualization results, some feature analysis techniques are also developed in GeoFEM visualization subsystem to reduce the data amount and highlight the important information, including a 3D field topology analysis for automatically specifying parameter values based on hyper Reeb graph in scalar data fields (Fujishiro, 2000[6]) and the significance map generation based on flow topology analysis (Chen, 2000[7]).
3 Parallel Visualization Techniques Available in GeoFEM Our subsystem provides many kinds of parallel visualization techniques, covering scalar field, vector field and tensor field.
3.1 Scalar field Surface Rendering has played a very important role in 3D data visualization. We developed a Parallel Surface Rendering (PSR) module which provides several convenient ways for users to display multiple boundary surfaces, multiple isosurfaces and arbitrary surfaces defined by equations, simultaneously. Figure 2 shows six isosurfaces of pressure (pressure=1000.0 in yellow color and pressure=-1000.0 in green color, respectively) and two cross-sections of temperature for a core dataset (Data size: 257,414 nodes and 253,440 elements, data courtesy of H. Matsui in GeoFEM).
Figure 3: A volume rendering image generated by our PVR module for a thermal convection simulation dataset in a rotating hemi-spherical shell.
Figure 2: Six isosurfaces and two cross-sections generated by our PSR module for a core dataset.
3
Volume Rendering is also a very powerful 3D visualization method because this method can convey the internal information within a 3D volume (Levoy, 1988[8]). We developed the Parallel Volume Rendering (PVR) module, which projects the entire dataset semi-transparently onto a 2D image without the aid of any intermediate geometric representations. Various transfer functions can be specified in order to improve the quality of visualization results. Figure 3 shows a volume rendering image for a rotating hemi-spherical shell dataset. The magnitude of the vorticity is mapped in color. Surface rendering can provide very precise data distribution on some surfaces. However, Figure 4: An image generated by our surfaces are just samples of the local datasets, PHR module for a fault dataset in whereas volume rendering can reveal the entire dataset, but visual cluttering is a significant order to highlight the data problem due to the composition of 3D information. distribution on the fault surface. In order to take the advantages of both the surface rendering and volume rendering methods, we have developed the Parallel Hybrid Rendering (PHR) module, in order to reveal the internal structure of 3D datasets and highlight the data distribution on some important surfaces. As shown in Figure 4, the fault surface is highlighted in the volume rendered image.
3.2 Vector field Parallel particle tracking and streamline modules were developed in proposed subsystem to display large unstructured vector datasets. The parallel particle tracking module provides many convenient styles for particle release, such as releasing particles at the initial time-step only, releasing particle at each time-step, releasing particles randomly from a plane, which can reveal different aspects of flow fields conveniently. The parallel streamline also has three styles: (1) traditional streamline; (2) illuminated streamline (Zoeckler, 1996[10]), in which each streamline has a radius to form a streamtube, as shown in Figure 6; and (3) streamlines with a radius that is proportional to corresponding data attribute at each point. Texture-based methods provide a very promising way to visualize vector fields (Carbral, 1993[11]). However, these methods often fail for 3D vector fields due to the dense texture of 3D LIC volumes. We present a significance-based method for generating a comprehensible volume LIC rendered image (Chen, 2002[12]). The concept of a 3D significance map is introduced, where regions containing interesting structures, such as vortices, are defined as the significant areas and are assigned a higher significance value. The flow topology analysis technique is employed to determine the significance value at each point in a given flow field. Based on the significance map, it is possible to design appropriate implicit transfer functions automatically. Other specifications that can be combined with the topology-based significance include emphasizing cross-sections, isosurfaces and the discontinuities of scalar physical attributes. Meanwhile, we adopted the streamline illumination model presented by Zockler, et al. rather than the conventional volume illumination model in order to obtain better results for volume LIC textures. Figure 7 shows a volume rendering of a tornado dataset (data courtesy of Roger Crawfis at
4
Ohio State University). All of features in the datasets are revealed in the volume rendered images.
Figure 5: Generated by the parallel particle tracking module for an underground water dataset.
Figure 6: Generated by the parallel illuminated streamline module for a liddriven convection in a cubic cavity.
Figure 7: Generated by the volume LIC rendering module based on 3D significance map for a tornado dataset.
3.3 Tensor field For tensor datasets, we have implemented a parallel hyperstreamline algorithm (Delmarcelle, 1993[13]), which can visualize 3D second-order tensor fields along continuous paths, and can display nine components (three eigenvectors) of a tensor field simultaneously. According to the direction of the major display eigenvector, the module first generates a trajectory from a seed point, and then attaches ellipses at each point on the trajectory, which forms streamtubes. The direction and magnitude of the long axis and short axis of each ellipse are decided by the direction and magnitude, respectively, of the other two eigenvectors at this point. The colors on the tube surface indicate the magnitude of the major display eigenvector at each point on the trajectory. An example for stress tensor data is shown in Figure 8.
Figure 8: Generated by our parallel hyperstreamline module for a fault analysis data around Japanese Islands.
4 Parallel Performance Optimization for the ES In order to make parallel performance on supercomputers as high as possible, especially on the ES in Japan, the following strategies were adopted in the implementation: • Visualization methods are carefully selected to be suitable for parallelization and coupling well with GeoFEM data structure; 5
• Three-level hybrid parallelization is employed in order to fit for the SMP cluster architecture. That means: • Inter-SMP node: MPI [14]; • Intra-SMP node: OpenMP [15] for parallelization; • Individual PE: Compiler directives for vectorization / pseudo vectorization. • Dynamic load repartition is performed in order to maintain load balance. In the following, we will take as an example, the parallel volume rendering (PVR) module in our subsystem, to give some detailed description of our strategies for parallel performance optimization.
4.1 Suitable Design of the PVR algorithm Due to the high time and large memory cost of volume rendering method, PVR has been a hot topic in the area of parallel rendering. Many papers for PVR have been presented (Wittenbrink, 1998[16]). There are many kinds of classification methods for parallel volume rendering, according to traversal order, grid type, composition order, target hardware, and so on. Many good methods can achieve high performance for different cases (Yagel, 1996[17], Ma, 1994[18], Wittenbrink, et al., 1997[19], Silva, 1996[20]). When designing a volume rendering method, we paid more attention to the possibility of high parallel performance for very complicated grids and huge data size. Our implementation includes partitioning complicated grids by supervoxels, buiding Branchon-need Octree (BONO) (Wilhelms, 1992[21]) in each supervoxel, rendering on each SMP node and compositing among SMP nodes finally. (1) Partition complicated grids by supervoxels In the GeoFEM system, the grid is usually very complicated Background supervoxels including unstructured, hybrid of P E P P P tetrahedra, hexahedra, prism and E# hierarchical. The complicated grids will make image composition P P very difficult and time-consuming P when we use ray-casting volume 6 E#17 rendering method. Although much Original GeoFEM Mesh work has been done on getting correct composition order for Figure 9: Parallel grid transformation. complex data by parallel BSP tree (Ma, 1994[18], Ramakrishnan, 1999[22]), it need store large amount of intermediate results. Very high bandwidth and large memory are needed for huge data size. In order to be available for both hybrid and hierarchical grids and to reduce memory cost in the meantime, we first transform the original data into BONO data structure by parallel resampling and adaptive refinement process. Some supervoxels are used to divide the original data space into some regular domains uniformly (as shown in Figure 9). Then we assign each supervoxel to an SMP node, and generate the subimage for each supervoxel on each node. Finally we composite these subimages in a correct from front to back order of supervoxels according to the position of viewpoint. The final accumulated opacity at each pixel for each supervoxel needs be recorded for the final subimage composition. 6
Supervoxels can be easily generated automatically according to the range of the whole dataset, and also can be defined by users in the batch file. Meanwhile, supervoxels can just cover a local part of the whole dataset as the clipping window. It also can control different display details on the final image by assigning different size and refinement precision for each supervoxel. In a region of high interest, a smaller supervoxel and a high refinement precision are usually used. (2) Build Branch-on-need Octree in each supervoxel BONO structure was presented by J. Wilhelms, et al in 1992 for fast isosurface generation (Wilhelms, 1992[21]). The traditional full octree adopted an even-division strategy, which often leads to generating too many empty voxels. BONO structure can avoid it greatly by delaying subdivision until absolutely necessary. Meanwhile, it also can quickly skip over empty or transparent voxels by attaching the minimum and maximum data values on its non-leaf tree nodes. In our module, the resampling is done in each supervoxel first to generate regular grids. Then the BONO structure is built by adaptive combination or refinement according to the difference of data values located on adjacent vertices. (3) Rendering and Compositing During subimage generation process for each supervoxel, some traditional acceleration techniques are employed, such as early ray termination (Levoy, 1990[23]), adaptive raycasting (Levoy, 1990[23]), finding the projection area on the screen for each supervoxel first to avoid useless ray casting. Based on the composition order of supervoxels, the subimages are composed from front to back. Each PE is responsible of compositing almost the same number of the pixels, which is decided by the image resolution and PE numbers.
4.2 Three-level Hybrid Parallelization for PVR (1) Parallel performance for our PVR module: pure MPI versus hybrid MPI+OpenMP SMP clusters have a hybrid-parallel architecture that consists of some nodes which are connected by a fast interconnection network. Each node consists of multiple processors which have access to a shared memory, while the data on other nodes may usually be accessed by means of explicit message-passing. For this kind of architecture machines, loop directives + message passing style hybrid programming model appears to be effective when message passing such as MPI is used in inter-SMP node communication, and when intra-SMP node parallelization is guided by loop directives such as OpenMP, which can make full use of the shared memory available within SMP nodes. However, sometimes it is difficult to get a high speedup performance for the hybrid MPI+OpenMP parallelization. It is often even worse than pure MPI (Rabenseifner, 2002 [24]), so up to now most applications on SMP machines still adopted pure MPI parallel programming model mainly due to the following three reasons: • Although OpenMP parallel can avoid communication overhead, it has to involve thread creation and synchronization overheads; • If the MPI routines are invoked only outside of parallel regions, all communication is done by the master thread while the other threads are inactive; • One thread is not able to saturate the total inter-node bandwidth that is available for each node.
7
To fit for the hybrid architecture of the SMP cluster machines, we adopted a hybridspace parallel in our PVR module. There are three kinds of parallelism in existing PVR algorithms: image-space parallel, object-space parallel and time-space parallel. Imagespace parallel subdivides the screen into some areas and assign one or several areas to each PE, whereas object-space parallel subdivides the whole volume data into some subvolumes and assign one or several subvolumes to each PE. Image-space parallel is easy to get a load balance and involves less communication, but usually need replicate data to avoid the costly data redistribution operations. Object-space parallel does not need data redistribution or replicate, so it has better storage scalability with the increase of data size. However, since the intensity of each pixel may be coming from several PEs, the composition of the final image need much communication. The communication overhead will increase greatly with the increase of PE number. The hybrid architecture of SMP cluster machines provides a very good chance for us to take advantages of both parallel methods. Object-space parallelism can be used among SMP nodes to reduce the data size on each SMP node, and image-space parallelism is used in each SMP node to take advantage of its shared memory. By the hybrid-space parallelism, we can avoid the storage problem for large data size, communication bottleneck for large number of PEs, and get a good load balance in each SMP node. Obviously, based on the hybrid-space parallel, MPI+OpenMP parallel can get a better performance than pure MPI for our PVR module. Meanwhile, the number of overlapped boundary elements will be reduced greatly due to the large granularity of data partition according to GeoFEM data structure. In GeoFEM data structure, the entire data domain is partitioned into distributed local datasets, and the overlapped elements exist at each domain boundary. Therefore, a three-level hybrid parallelization was adopted in our PVR module (Chen, 2002[25]). In recent two years, although some work has been conducted on three-level hybrid parallelization, almost all of them are concentrated in the computing area. For PVR methods, many PVR algorithms have been presented for many kinds of hardware, but few papers discussed about SMP cluster machines. (2) Improve vector performance for each PE The first step of three-level hybrid parallel is vectorization in each PE. For vector machines, vectorization is the most important factor for getting good performance. Although vectorization can be done automatically by compiler, the conditions for applying vectorization are very strict. In most cases, it cannot be vectorized automatically if we do not organize the codes well to make it suitable for vector performance. For example, the sufficiently long loop is very crucial for the vector performance. We make this kind of loops as many as we could by the following ways (Minami, 2001[26]): • Generate more loops; • Remove the dependency in each loop; • Move IF statements from the loop whenever possible; • Combine a number of short loops into one long loop by reordering; • Exchange the innermost and outer loop to make the innermost loop longer; • Minimize load/store latency to the greatest possible extent. (3) Accelerate parallelization in each SMP node by multi-coloring Loop directives by OpenMP are used for the parallelization in each SMP node. In order to achieve efficient parallel performance by OpenMP, no dependency and data race are very critical. However, in our visualization subsystem, data race exists in some parts of codes. For example, in the parallel volume rendering module, before ray-casting grids, the 8
gradient on each vertex need be computed first. The gradient is computed by the shape function of each mesh element. The pseudo algorithm for getting gradients is as follows: #pragma omp parallel { for(i=0;i