in the low bit rate video coding arena, where robust parameter sets are very important. We propose that robust parameter estimation, using the Taguchi meth-.
1
Parameter Optimization of Robust Low Bit Rate Video Coders Sangyoun Lee and Vijay K. Madisetti
Digital Signal Processing Laboratory School of Electrical and Computer Engineering Georgia Institute of Technology Atlanta, GA 30332-0250, U.S.A Abstract | Most standards provide a generalized syntax and semantics framework for video coders, leaving the selection and optimization of the right parameter set (and lookup tables) to the implementation. The choice of the right parameter set that is suitable for a rich enough class of input sequences is, however, quite di�cult. This di�culty is particularly ampli ed in the low bit rate video coding arena, where robust parameter sets are very important. We propose that robust parameter estimation, using the Taguchi methods, when applied to low bit rate video coding allows e�ective (near optimal) performance over a wide variety of input data streams. A number of experimental results con rm the improvement (via robustness) visa-vis conventional parameter estimation methods and these methods promise an e�cient solution to the e�cient design of parameter sets that support standards.
I. Introduction
stance in INTER-frame mode, the thresholding value that decides whether INTRA-macroblock or INTERmacroblock modes be selected could itself be a parameter. In addition, the search region involved in the determination of the motion vectors could be another independent variable. These choices are usually made in an ad hoc manner. In this paper, we propose that these parameters be optimized using robust design methods. The H.263 standard [5] will be used to illustrate its bene ts. Extensions of this method are easily applicable to other coding standards such as H.261, MPEG1, or MPEG2 [6][7]. Robust design, using the Taguchi method [1][2], has been widely used to nd those parameters in a process which are most important in achieving some goals. Robust design reduces variation in an objective function by reducing the e�ect of sources of variation, and not by controlling the sources of variation themselves. In this method, statistically planned experiments are used to vary settings of important system control parameters.
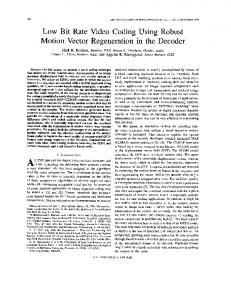
Video coding standards, in particular, seldom provide explicit and detailed information on the control schemes, or their parameter set instantiations. Implementations select some control scheme and instantiate the parameter sets based on initial qualitative or quantitative measures. In very low bit rate coding, the choice of the right parameter set is of additional importance since various video sequences vary widely X in the amount of redundancy in time or space that could be extracted, and quality is compromised due to ill-suited parameter values. M Y For instance, video coding standards specify several modes of operation; one of which could be selected on a block-by-block basis. While this multimodal feature has the advantage of adaptability, the choice must be made carefully. Macroblocks (constituting frames) Z may contain single 16x16 luminance blocks, two 8x8 chrominance components, and with motion compensated prediction, each macroblock could be INTRAFig. 1. Robust Design Parameters mode coded or INTER-mode coded. The freedom in selection of the parameter sets and design variables was utilized in previous research II. Robust Design to improve the performance of an MPEG encoder where the variables (frame type and/or the quantizer) We will brie y introduce robust design, insofar as were optimized via application of rate-distortion therelevant to this paper. A block diagram representation ory [3][4]. However, other parameters remain that of proposed coder is shown in Figure 1. can also be used to optimize the coder. For inNOISE
FACTOR
SYSTEM
SIGNAL
(VIDEO ENCODER)
FACTOR
CONTROL FACTOR
RESPONSE
2
� Signal factors (M): These are the values of the parameters in the implementation that determine the intended values of the system response. In the video encoder, quantization level can be a signal factor when encoder needs control for given bit rate budget. � Noise factors (x): Certain parameters cannot be controlled by the implementation, and are called noise factors. In the video encoder, the variability in the input sequences could itself be a noise factor. � Control factors (z): These are parameters that can be speci ed freely by the implementation. In fact, it is the implementor's responsibility to determine the best values of these parameters. In a video encoder, the thresholding value for mode selection, delineation of the search area, etc., are control factors. � Response (y): This is output of the system that is used to determine the quality of the coder or some other evaluative characteristic. In video encoder PSNR(peak signal to noise ratio) or bps(coded bits per second) can be responses. The principal goal of robust design methods is to exploit the nonlinearities in the response function to nd a combination of system parameter values that gives the smallest variation in the value of the quality characteristic around the desired target value. This exploitation of nonlinearity can be understood through the following mathematical formulation. Let x = [x1; x2; � � � ; xn]T denote the noise factors (that are uncontrollable) and z = [z1 ; z2; � � � ; zn ]T denote the system parameters (called control parameters) whose values can be set by the designer. Further, let us assume that the following function (which need not be known) describes the dependence of y on x and z: y = f (x; z): The deviation, �y, of the quality characteristic from the target value caused by the deviations, �xi , of the noise factors from their respective nominal values can be approximated by the following expansion:
@f )�x + ( @f )�x + � � � + ( @f )�x �y = ( @x 1 2 n @x @x 1
2
n
Furthermore, if the deviations in the noise factors are uncorrelated, the variance, �y 2 , of y can be expressed in terms of variance, �x 2 , of the individual noise factors as i
@f )2 � 2 + ( @f )2 � 2 + � � � + ( @f )2 � �y 2 = ( @x x1 @x x2 @x x 1
2
n
n
2
Thus, the variance �y 2 (in the quality of the encoder) is a sum of the products of the variances of �x 2 and the sensitivity coe�cients, (@f=@x1 )2 . The sensitivity coe�cients are themselves functions of the control factor values. A robust system is one for which the sensitivity coe�cients are the smallest. i
An e�cient way to study the e�ect of several control factors simultaneously is to plan matrix experiments using an orthogonal array[8]. The reader is referred to the appendix for detailed discussions of the properties of orthogonal arrays. Control parameter Advanced prediction Mode(A) Unrestricted motion vector Mode(B) Inter mode preference(C) Null motion vector preference(D) 16x16 motion vector preference(E) Quantization level(F) Motion vector search range(G) TABLE I
Level 123 ON OFF ON OFF 200 500 800 0 100 200 100 200 300 10 16 22 5 10 15
Control Parameters and Their Levels
Sequence Frame Type Frame, Frame rate
carphone, mother-daughter, claire miss-am, suzie, salesman foreman, trevor QCIF(144x176 pixels) 1-140, 4.1Hz, 8.33Hz, 12.5Hz TABLE II
Noise Parameters
III. H.263 optimization using Robust Design
We now illustrate the advantages of robust design with a speci c application to the H.263 standard. A. H.263 Optimization In the H.263 coder, each frame of the image sequence is subdivided into regions called macroblocks. A macroblock consists of 16 pixels by 16 lines of the luminance component (Y) and two 8 pixels by 8 lines of chrominance components (CB and CR ). Each frame is coded in either the INTRA or INTER mode. INTRA mode is used in some speci c situation, as in the rst frame of an image sequence, while the INTER mode can be used for continuous video processing. So only INTER frame mode is considered in this case. We list seven parameters useful for the optimization of an H.263 implementation. Table I shows these selected parameters and their possible levels. Some of these parameters can be signal factors when the encoder needs control for given bit rate budget. Furthermore, parameter E is only relevant when parameter A is ON, and parameter G is only considered when parameter B is OFF. Noise parameters, that cannot be controlled, are the eight di�erent input sequences, and the three di�erent frame rates of Table II. Reference frame rate for these sequences is 25Hz.
3
B. Design of Experiments and Objective Function An orthogonal array was used for the design of this experiment to ensure that the resultant values of the control parameter set provide excellent performance over a wide variety of input sequences and frame rates. This particular experiment has 13 degrees of freedom, and as per robust design theory the L36 orthogonal array was selected, which allows 36 combinations of control parameter levels. For each combination, we recorded 24 experimental results for 8 sequences at 3 frame rates. PSNR (luminance) and coded bps were selected as objective functions used in the optimization. The PSNR is assumed continuous and nonnegative The mean square characteristic of PSNR can be described as follows:
Q = n1
Xn PSNRi
2
i=1
where n represents the number of observations of quality characteristic under di�erent noise characteristics. Furthermore, maximizing Q is equivalent to maximizing Q1 by the following equation.
Q1 = 10log( n1
Xn PSNRi ) 2
i=1
Coded bps (bit rate) is also assumed continuous and nonnegative and has the values betweeen 0 to 1. Then, the mean square characteristic of coded bps is represented by:
Q = n1
Xn bpsi
2
i=1
We can leave the choice of which objective function (or both) to the design engineer through the following formulation of the optimization problem as: Maximize fQ1 + � Q2g, � > 0 Subject to ranges speci ed for each control parameter. Since we did not consider rate control, � is simply the relative weight of two objective functions. Expt. No. 1 2 3 4 5 6 7 8 9 10 11 12 13 14 15 16 17 18 19 20 21 22 23 24 25 26 27 28 29 30 31 32 33 34 35 36
Column 1 2 3 4 5 6 7 A B C D E F G PSNR kbps 1 1 1 1 1 1 1 32.35 49.52 1 1 2 2 2 2 2 30.20 27.09 1 1 3 3 3 3 3 28.91 19.68 1 2 2 1 3 3 3 28.90 19.57 1 2 3 2 1 1 1 32.34 49.43 1 2 1 3 2 2 2 30.18 27.02 2 1 3 2 1 2 2 30.03 29.51 2 1 1 3 2 3 3 28.70 19.49 2 1 2 1 3 1 1 31.91 50.84 2 2 3 3 2 1 3 28.63 22.10 2 2 1 1 3 2 1 31.85 57.27 2 2 2 2 1 3 2 29.85 32.48 1 1 3 2 3 2 1 32.21 47.82 1 1 1 3 1 3 2 30.20 28.82 1 1 2 1 2 1 3 29.10 22.93 1 2 2 3 3 3 2 30.00 26.12 1 2 3 1 1 1 3 29.17 25.96 1 2 1 2 2 2 1 32.26 47.15 2 1 2 1 2 1 2 29.99 27.61 2 1 3 2 3 2 3 28.65 18.97 2 1 1 3 1 3 1 32.04 50.98 2 2 1 1 1 3 3 28.67 24.45 2 2 2 2 2 1 1 31.92 56.58 2 2 3 3 3 2 2 29.67 30.95 1 1 1 2 3 1 2 30.21 28.99 1 1 2 3 1 2 3 29.05 23.50 1 1 3 1 2 3 1 32.19 47.31 1 2 3 3 2 3 1 32.22 46.95 1 2 1 1 3 1 2 30.17 28.68 1 2 2 2 1 2 3 29.06 23.07 2 1 2 2 1 2 1 32.00 51.09 2 1 3 3 2 3 2 29.96 27.42 2 1 1 1 3 1 3 28.78 19.70 2 2 1 3 2 2 3 28.57 21.92 2 2 2 1 3 3 1 31.85 57.62 2 2 3 2 1 1 2 29.91 32.95 TABLE III
Orthogonal array for experiment and the result of Foreman sequence at 12.5Hz frame rate
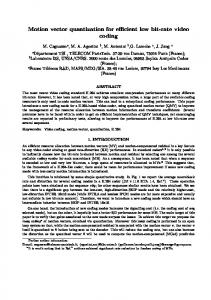
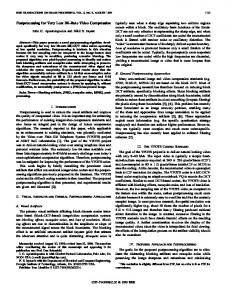
Minimizing Q is equivalent to maximizing Q2 by the following equation. C. Selection of Major Parameters n Table III presents results for the foreman seQ2 = ?10log( n1 bps2i ) quence for a frame rate of 12.5Hz. The control pai=1 rameter variations and their e�ect on each of the In summary, two possible objective functions are rep- two objective functions are represented in Figures 2 and 3. From these gures it is evident that resented as: the quantization level is a dominant parameter for Objective function 1: PSNR (peak signal to noise ra- both objective functions. Furthermore, the coded tio) bps is more sensitive to quantization level. A coder n can thus be controlled (in given bit rate budget) Q1 = 10log( n1 PSNRi2) through proper selection of the quantization level, i=1 and this factor can be a signal factor in the coder design. Parameters advanced prediction mode and Objective function 2: bps (coded bits per second) unrestricted motion vector mode a�ect the PSNR n more than other parameters. The remaining four paQ2 = ?10log( n1 bps2i ) rameters do not a�ect the PSNR, however, these four i=1 parameters a�ect coded bps considerably. Thus there
X
X
X
4
30.1
parameter D' was changed to the unrestricted motion vector mode.
F1
Q1(PSNR)
29.9
29.8 A! B1
C1 C2 B2
A2
D1
E1
D2
C3
E2 E3
G1
G2
G3
D3
29.5
Control parameter Inter mode preference(A') Null motion vector preference(B') 16x16 motion vector preference(C') Motion vector search range(D') TABLE IV
Level 123 200 500 800 0 100 200 100 200 300 5 10 15
New Control Parameters and Levels
F2
29.3
Sequences Frame Type Frame, Frame rate
F3
29.1
Fig. 2. Control parameter e�ects for Q1 (Foreman sequence at 12.5Hz frame rate) −26.0 F3
−28.0
Q2(bps)
F2
−30.0
A1
B1 A2
D2
C3
C1 B2
C2
D3 D1
E1
E2
E3
G1 G2
G3
−32.0
−34.0
F1
−36.0
Fig. 3. Control parameter e�ects for Q2 (Foreman sequence at 12.5Hz frame rate)
is an opportunity to optimize the bit rate through control of these four parameters while retaining the same PSNR. Other sequences listed were analyzed in a similar fashion. What appeared evident is that for each quantization level we needed di�erent values for the other four parameters to optimize the objective functions. This is a new conclusion | the current standard does not change the values of the other parameters when the quantization level is changed. This can penalize the coder at very low bit rates. Table IV shows the selected four control parameters which a�ect coded bps more than they do the PSNR. This means these parameters can reduce coded bps without a�ecting PSNR signi cantly. Since the advanced prediction mode and unrestricted motion vector mode were sensitive to both PSNR and coded bps, we utilized these modes in new experiments. Control
grandma, coast-guard, news hall-object silent QCIF(144x176 pixels) 1-140, 8.33Hz TABLE V
Noise Parameters
D. Selection of Optimal Levels An L9 orthogonal array was selected that allowed for nine combinations of control parameter levels. (The reader may recall the orders of magnitude reduction in the number of required experiments when using orthogonal arrays). For each combination, we tabulated eight experimental results for the eight sequences. The frame rate was xed at 8.33Hz and the same 8 sequences were selected. Since H.263 supports quantization levels between 1 and 31, the proposed scheme was applied to all 31 quantization levels. After completion of these experiments, four optimal control parameter levels were selected for each quantization level. We did not consider rate control in this experiment. Figure 4 shows the e�ect of the control factors on fQ1+�Q2g when the quantization level is 5. From Figure 4(a), when � is 1 the optimum parameter level for A' is 1, for B' it is 2, and so on for others. Figure 5 shows the improvement in the measured objective function fQ1+�Q2(�=1)g obtained by comparing selected optimum control parameter levels to the TMN5 standard recommended values. The results of the veri cation experiment are also shown. The observed results (predicted and veri ed) are very close, implying only slight interaction between control parameters. To further verify the robustness of proposed parameter set the sequences of Table V which were not used in the design optimization, were run through the coder using the optimal parameter set. The results shown are very encouraging. Figure 6 shows that at low quantization levels the optimum control parameter level for each parameter varies with quantization level. As a result, we cannot select an optimum control parameter level for each parameter in this range (counter to the TMN5 standard, and similarly for other video standards).
5
2.0 Predicted Difference Verified Difference New sequence Difference
OPTIMUM LEVEL
Q1+Q2
−4.80
B2
C1
D2
A1
D3
C2
−4.90
The difference of (Q1+Q2)
1.5
A2
D1
A3
1.0 Difference 0.5
0.0 TMN5 −0.5
B1
−1.0 0.0
B3
10.0 20.0 Quantization Level
C3
30.0
−5.00
Fig. 5. The improvement of proposed coder compared to TMN5 test model(�=1)
TMN5 LEVEL
(a) Q1+�Q2(� = 1)
A‘
600
B1
400
200
0
5
10
15
20
25
30
0
5
10
15
20
25
30
0
5
10
15
20
25
30
0
5
10
15
20
25
30
200
C1
A1
B‘
Q1+(0.05xQ2)
29.73 D2 A2
A3
B2
100
D1
C2
0
D3
300
C3
C‘
29.71
200
100
B3
D‘
15
29.69
10
5
Quantization Level
(b) Q1+�Q2(� = 0.05)
Fig. 6. (Set of optimal parameter level)i = (Set of optimal parameter level)j i; j 10 (�=1) 6
�
−694.0
However, when the quantization level is greater than 11, we can select a constant level for each control pa−696.0 rameter. In this veri cation experiment, rate control was considered with a TMN5 recommended rate control scheme. The frame rate was again xed at 8.33Hz. We considered those cases where the bit rate was be−698.0 low 20Kbps and quantization level was greater than 11 to model low bit-rate telephone line applications and to guarantee optimality of control parameter set. We tested all 13 sequences with those conditions. −700.0 Figure 7 and Figure 8 show the maximum and minimum di�erence of results between selected control parameter level set and the TMN5 recommended values (c) Q1+�Q2(� = 20) for the 8 sequences of Table II. In this case, the coded Fig. 4. The e�ect of each control parameter level when quan- bps for some sequences was reduced by as much as tization level is 5 and � is 1, 0.05 and 20. 10% for some PSNR as shown in Figure 7. Average PSNR gain for a given bit rate budget was 0.2dB. Also, the test results from the obtained control paB2
Q1+(20xQ2)
C1
D2
A1
A2
A3
D3
C2
D1
B1
B3
C3
6
rameter level was superior to those of TMN5 when the mean quantization level was greater than 11. Since robust design reduces the sensitivity to noise, the variation in the objective function for all sequences is reduced also. For values below 20Kbps, the test results from the obtained control parameter level show close correspondences to TMN5 even when the mean quantization level is smaller than 11 as in Figure 8. Figures 9 and 10 show the maximum and minimum di�erence among the 5 sequences of Table V. The results of these sequences are similar to the results of sequences in Table II. Figure 9 shows the results of the silent sequence when the given budget is below 20Kbps. Figure 10 shows the results of grandma sequence when the allocated budget was below 20Kbps, and when quantization level is greater than 11. Figures 11 and 12 show the probability of selected Fig. 8. Claire sequence result({: Obtained parameter result - : TMN5 result) : Mean Quantization Level(6.69 30.11) mode for suzie sequence at some given bps budget. The Uncoded mode just duplicates the corresponding previous macroblock for current macroblock. These gures show which mode (motion vector mode) is most likely to be selected with the given parameter set. The obtained parameter set was using more INTRA and INTER modes than TMN5 recommendations. However the obtained parameter set selected a much smaller number of INTER4V modes. MINIMUM DIFFERENCE
20
18
16
Kbps
14
12
10
8
6
4 33
34
35
36 PSNR
37
38
39
�
MAXIMUM DIFFERENCE
20
18
MAXIMUM DIFFERENCE
16
Kbps
20
18
14
12
Kbps
16
10 14
8 29
12
30
30.5 PSNR
31
31.5
32
Fig. 9. Silent sequence result({ : Obtained parameter result - : TMN5 result) : Mean Quantization Level(12.07 29.55)
10
8 30.5
29.5
�
31
31.5
32
32.5
33
33.5
34
PSNR
Fig. 7. Suzie sequence result({ : Obtained parameter result - : TMN5 result) : Mean Quantization Level(11.97 30.59) �
IV. Conclusion
In this paper, we presented a novel approach for parameter selection in complex video coding applications through robust design. With robust design, we can optimize the video coder without resorting to a brute-force method of exhausting all combinations of parameters. Robust design allows us to identify those parameters that are important, and the application of orthog-
onal array based experiments then reduce the number of experiments required to nd the optimal parameter set by a few orders of magnitude. While this paper demonstrated the value of robust design in parameter selection (arguably for the rst time in literature) on one standard, the methodology is applicable to a wide array of video applications and standards, providing much needed control over the design process as contrasted to the current ad hoc approaches.
7 MINIMUM DIFFERENCE
0.7
9 8 0.6
6 0.5
5 Probability of Selected Mode
Kbps
7
4 3 2
31.4
31.6
31.8
32
32.2
32.4
32.6
32.8
33
33.2
(a)
20
0.4
0.3
0.2
Kbps
15
0.1
10
5 31
0 12
31.5
32
32.5
33 (b)
33.5
34
34.5
13
14
15
Fig. 10. Grandma sequence result({ : Obtained parameter result, - - : TMN5 result): (a) Mean Quantization Level(11.09 29.54) (b) Mean Quantization Level(7.03 29.54) �
0.6
Probability of Selected Mode
0.5
0.4
0.3
0.2
0.1
12
13
14
15 Kbps
16
17
18
19
20
Fig. 11. The probability of selected mode for Suzie sequence using Obtained Parameter (- : INTRA Mode, : INTER Mode, -. : INTER4V Mode, - - : Uncoded Mode) ���
[1] [2] [3] [4] [5] [6] [7]
18
19
20
Fig. 12. The probability of selected mode for Suzie sequence using TMN5 Parameter (- : INTRA Mode, : INTER Mode, -. : INTER4V Mode, - - : Uncoded Mode) ���
sual services at p 64 kbit/s," Dec. 1990, Mar. 1993(revised) [8] M. S. Phadke. Quality Engineering using Robust Design. Englewood Cli�s, NJ: Prentice Hall, 1989. [9] S. Y. Lee, V. K. Madisetti, "Parameter Optimization of Low Bit Rate Video Coders," CSIP Technical Report CSIP TR-98-02, 10 July 1998. http://www.ee.gatech.edu/users/215/TR/index.html, Georgia Institute of Technology. �
11
17
�
0.7
0 10
16 Kbps
35
References G.Taguchi and Y. Wu, Introduction to O�-Line Quality Control, Central Japan Quality Control Association, 1979. R. N. Kackar, \O�-Line Quality Control, Parameter Design, and the Taguchi Method", Journal of Quality Technology, Vol 17, October 1985, pp. 176-209. K. Ramchandran, A. Ortega, and M. Vetterli, "Bit allocation for dependent quantization with application to multiresolution and MPEG video coders," IEEE Trans. on Image Processing, vol. 3, no. 5 pp.533-545, Sept. 1994. J. Lee and B. W. Dickinson, "Rate-Distortion Optimized Frame Type Selection for MPEG Encoding," IEEE Trans. Circuits Syst. Video Technol., vol. 7, no. 3 pp.501-510, June. 1997. ITU-T Recommendation H.263, "Video coding for low bit rate communication," Dec. 1995. ISO/IEC 11172-2, "Information technology-coding of moving picture and associated audio for digital storage media at up to about 1.5 Mbit/s:Part 2 Video," Aug. 1993. ITU-T Recommendation H.261, "Video codec for audiovi-