Aug 31, 2013 ... fying vocal effort level, which can be applied by text-to-speech. (TTS) systems ...
using low order Linear Prediction Coefficients (LPC) where the flexibility was ....
vocal effort level were gathered together forming the code-book for that ... In our
case this factor is introduced with a real value from the range [−1 ...
8th ISCA Speech Synthesis Workshop • August 31 – September 2, 2013 • Barcelona, Spain
Parametric model for vocal effort interpolation with Harmonics Plus Noise Models ` Angel Calzada Defez1 , Joan Claudi Socor´o Carri´e1 , Robert A. J. Clark2 Human Computer Interaction Department, Enginyeria i arquitectura La Salle (Universitat Ramon Llull), Barcelona, Spain 2 The Centre for Speech technology Research, The University of Edinburgh, U.K. 1
[email protected],
[email protected],
[email protected]
Abstract It is known that voice quality plays an important role in expressive speech. In this paper, we present a methodology for modifying vocal effort level, which can be applied by text-to-speech (TTS) systems to provide the flexibility needed to improve the naturalness of synthesized speech. This extends previous work using low order Linear Prediction Coefficients (LPC) where the flexibility was constrained by the amount of vocal effort levels available in the corpora. The proposed methodology overcomes these limitations by replacing the low order LPC by ninth order polynomials to allow not only vocal effort to be modified towards the available templates, but also to allow the generation of intermediate vocal effort levels between levels available in training data. This flexibility comes from the combination of Harmonics plus Noise Models and using a parametric model to represent the spectral envelope. The conducted perceptual tests demonstrate the effectiveness of the proposed technique in performing vocal effort interpolations while maintaining the signal quality in the final synthesis. The proposed technique can be used in unit-selection TTS systems to reduce corpus size while increasing its flexibility, and the techniques could potentially be employed by HMM based speech synthesis systems if appropriate acoustic features are being used. Index Terms: vocal effort interpolation, harmonics plus noise model, expressive speech synthesis
1. Introduction Technology is currently embedded in society; however, some barriers, such as deficiencies in natural speech in HumanMachine-Interfaces (HMI) remain, thus preventing technology from reaching several communities. In these cases, improved Text-To-Speech (TTS) systems can make the HMI more natural improving the user experience when using technology [1]. The Harmonics Plus Noise Model (HNM) allows us to easily perform prosody modifications on speech signals, while maintaining a high level of quality in the resulting synthesized signal [2]. For this reason, this model has been chosen as a speech signal representation model by speech modification applications aiming to improve the naturalness and expressiveness of the TTS system. The HNM has also been used in expressive speech synthesis systems where both prosody and voice quality (VoQ) were modified [3, 4, 5, 6]. It has been proven that VoQ has an important role in expressive speech synthesis [7, 8], which led us to speculate whether the HNM could be used to modify low-level VoQ parameters [5]. This work [5], asserted the relevance of VoQ in the expressive style perceived by the listener and confirmed the feasibility of using the HNM to mod-
ify VoQ parameters. Despite having achieved good results in terms of expressiveness in [5], the quality of the synthesized signal was seriously degraded. The number of signal manipulations1 and the unresolved existing interdependence of some spectral parameters (i.e., the Hammarberg Index -hammi- and the relative amount of energy above 1000 Hz -pe1000-) caused degradation of the synthesized signal’s quality. To simplify the procedure and focus on high-quality modifications, the number of parameters modified was reduced to just one, vocal effort; this was chosen for its salient role in expressive speech characterization [9]. The proposed methodology in [10] proved the feasibility of HNM for modifying vocal effort with a model based on low order linear prediction coefficients (LPC). However, the method based on low order LPC is very sensitive to interpolation artefacts which might lead filter instability. Thus, in order to cover multiple levels of vocal effort, it requires data for each target vocal effort level to to be able to synthesize with that level of vocal effort. This makes the methods flexibility dependent upon corpus size. In this work, we present a new model based on ninth order polynomials for representing the harmonic spectral envelope which not only allows the transfer of vocal effort from a template signal available in the corpus, but also allows us to generate intermediate vocal effort levels not present in the available corpus. The proposed methodology can be applied in the context of TTS systems, particularly to allow them to synthesize speech signals expressing a range of vocal effort levels. Moreover, vocal effort levels that are different to those present in the original corpora recordings that a voice is based upon. This paper is organized as follows. Section 2.1 reviews the details of the implementation of the HNM speech signal parameterization and re-synthesis. The speech database used for the experiments is briefly explained in section 2.2 and section 2.3 presents the polynomial model and details how the model codebooks were built from the original corpus. Next, the proposed vocal effort modification procedure is detailed in section 2.4. In section 3, the conducted perceptual experiments are outlined. Section 4 discusses the proposed procedure, the obtained results and future work. Fianlly section 5 provides conclusions.
1 Up to five parameters (jitter, shimmer, hnr, Hammarberg Index hammi- and the relative amount of energy above 1000 Hz -pe1000-) were modified based on a five-stage procedure, in which each stage was specifically designed to modify a unique VoQ parameter.
25
À. Calzada Defez, J.C. Socoró Carrié, R. Clark
2. Methods 2.1. Harmonics Plus Noise Model The HNM expresses the sampled speech signal s[n] as the sum of two components: h[n] and r[n], which correspond to the harmonic and noise, or stochastic, components of the signal, respectively. s[n] = h[n] + r[n]
(1)
The harmonic component, h[n], models the pseudoperiodicity that appears in the speech signal as a sum of harmonically related sinusoids. Given a quasi-periodic frame k with Lk harmonics, the harmonic part is characterized by the amplitude2 (Ak ), frequency3 (Fk ) and phase (Φk ) arrays. In contrast, the stochastic component, r[n], models all non-periodic events in the speech signal with an autoregressive (AR) model and is represented through Q-order Linear Prediction Coefficients (LPC) and noise variances (Pk ). From the frequency-domain perspective, the harmonic component mainly models the lower band of the spectrum, whereas the upper band is modeled by the stochastic component. The boundary between these two bands is known as the maximum voiced frequency (fh ). Some authors consider this boundary variable in time [11], but the HNM implementation used in the present work fixed this boundary to 5 kHz, as in [12, 13]. All signals have been analyzed at a constant frame rate of 5ms for both, harmonic and stochastic parts. 2.2. Speech database The speech material used to validate the proposed vocal effort transformation methodology was the German diphone set recorded with three degrees of vocal effort (vocal effort levels were labelled as Low, Modal and High), as reported in [9]. The corpus was divided into six datasets containing logatoms of three syllables in length with voiced and unvoiced sounds recorded with a constant pitch. Recordings of the three vocal effort levels from a male and female speaker were available. As explained in [9], the data were automatically labelled and subsequently hand-corrected. 2.3. Parametric model and code-books The entire corpus was represented using HNM parameters. Informal tests conducted prior to the proper tests presented in this work, highlighted some speech signal variations in the logatome syllables due to syllable position inside the utterance. For the sake of obtaining more accurate models without losing too much generalization, the syllable position inside the logatome were considered together with phoneme labels for indexing the models in the code-books. Therefore, each dataset (corresponding to a specific vocal effort level and gender) was divided into three sub-datasets, one per each syllable position in the logatome (init, middle and final). For each sub-dataset all HNM parameters from multiple realizations of a common phoneme were gathered together. Only parameters from the stable part of the phonemes were used to prevent coarticulation effects from being introduced in the final computed models. The stable part was considered to be the second and third quartiles of the full 2 A = {A1 , A2 , · · · , Al }, where the super-index l indicates the k k k k harmonic number l ∈ [1, .., Lk ]. 3F 1 l k = {Fk , · · · , Fk }. Frequencies are harmonic; therefore, Fkl = l F0 (k), where F0 (k) corresponds to the fundamental, or pitch, frequency for a given frame, k.
26
phoneme duration (figure 2). At this point we had the HNM parameters of all realizations of the same phoneme for a given vocal effort level, gender and syllable position in the logatome together. Next, the parametric model coefficients were computed to fit all the data points formed by the harmonic amplitudes and frequencies for a given phoneme. Finally, the model parameters for all sub-data sets corresponding to the same gender and vocal effort level were gathered together forming the code-book for that vocal effort level and gender. Up to six code-books were generated covering all vocal effort levels and gender combinations. For a given synthesis, only the three code-books from the gender to synthesize are used for carrying out the vocal effort modification and synthesis process. Code-books are used to retrieve extreme vocal effort models, which in our case are labelled as High and Low. The third code-book labelled as Modal is used as the reference level. Apart from the extreme Low and High vocal effort levels, the proposed methodology aims to allow the TTS system to also perform intermediate vocal effort levels. Polynomials were chosen in order to be able to interpolate between models from the code-books. The proposed methodology uses ninth order polynomials (eq. (2)) to be able to capture the fourth formant peaks and valleys. Informal tests were conducted computing the general root-mean squared error RMSE for different number of coefficients. The informal tests showed that the main error reduction was achieved with the first five coefficients. [ ) = a0 + a1 f + a2 f 2 + a3 f 3 + · · · + a9 f 9 ampl(f
(2)
[ ) is the harmonic’s amplitude envelope where ampl(f which is a function of the harmonic’s frequencies f , and ai for i ∈ [0, 9] are the model coefficients. Table 1 presents an excerpt from the code-book corresponding to the High vocal effort level for the female speaker. Table 1: Sample of two phonemes information taken from the code-book corresponding to High vocal effort level from the female speaker. Phoneme labels follow the SAMPA notation[14]. Part of the coefficients have been removed in order to fit the table width to the column dimensions. Phoneme ... U; U; U; o; o; o; ...
Syllabe position ... init; middle; final; init; middle; final; ...
Model coefficients ... 1.941e-31;-4.810e-27;· · · ;-0.067; 1.501e-31;-3.761e-27;· · · ;-0.039; 1.071e-31;-2.664e-27;· · · ;-0.030; 2.046e-31;-5.298e-27;· · · ;-0.118; 3.044e-32;-9.366e-28;· · · ;-0.040; -1.502e-31;3.287e-27;· · · ;0.045; ...
2.4. Proposed methodology for applying polynomial models for vocal effort modification The proposed methodology uses the modal vocal effort level data as the starting point for the modifications. This decision was based on the results obtained in previous work [10] where it was found that the signal quality degradation was directly related with the amount of signal modification. Thus, in order to minimize the amount of signal modification for all cases, rising and lowering the vocal effort level, we decided to use modal vocal effort level as the source for all the signal modifications.
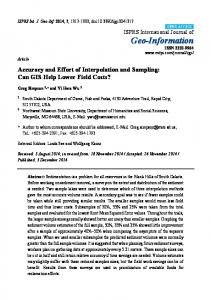
8th ISCA Speech Synthesis Workshop • August 31 – September 2, 2013 • Barcelona, Spain For this reason only the HNM parameters from the modal corpus will be used for synthesis. HNM parameters from high and low datasets are only used for building the respective (High and Low) code-books. Figure 1 depicts the general schema for the proposed methodology. The vocal effort synthesis procedure conducted in this work begins with a given transcription of the text to be synthesized. The transcription is used to retrieve the corresponding model parameters from the code-books. The modal code-book is always accessed because the spectral envelope from this vocal effort level will be used as the baseline for the posterior modifications. However, the High and Low code-books are used only when necessary. The decision is taken based on the target vocal effort to be synthesized. The direction of the vocal effort modification is encoded in the sign of the interpolation factor (γ). In our case this factor is introduced with a real value from the range [−1, 1]. Negative values correspond to lowering the vocal effort, whereas positive values are used for increasing it. Thus, the extreme values (−1 and 1) indicate using the Low and High vocal effort parameter models as retrieved from the corresponding code-book. Once the identified code-books to be used are loaded, the transcription is divided into three regions, where each region corresponds to a syllable from the logatome (regions were labelled as: init, middle and final). This information is used in combination with the phoneme label for searching the model units in the code-books. For instance, given the following transcription: /t − a − m − u − t − a/ the first unit to search will be the phoneme /t/ with an indicator of initial (init) position. However, the model parameters for the second /t/ will be different due to its different position in the logatome (final). Once the proper units for the whole sentence are selected from the corresponding code-books, the model coefficients are linearly interpolated in order to have model parameters for each frame to synthesize. However, the linear interpolation is carried out only in the unstable parts of the phonemes, where coarticulation effects are present. For the central regions of the phoneme and the beginning and end of the utterance to synthesize the original model parameters obtained from the code-book are replicated (figure 2). This process results in two matrices Ec and M c with dimensions (mxn), where m corresponds to the number of coefficients in the model and n is the number of frames. Thus, the matrices contain the model parameters for each frame. Ec contains the extreme vocal effort parameters obtained from the Low or High vocal effort code-books, depending on γ sign, and M c contains the modal vocal effort model parameter values for each frame. The next step is to obtain the matrix corresponding to the interpolated vocal effort level (IIc ) from Ec and M cc. Equation (3) shows the expression for computing the interpolated model parameters for a general frame k. Ick = (1 − |γ|) Mck + |γ| Eck ; γ ∈ [−1, 1]
(3)
where Ick are the interpolated model coefficients corresponding to the final desired vocal effort level for the kth frame, γ is the interpolation factor and Mck and Eck are the coefficients from kth frame for the Modal and extreme (Low or High depending on sign(γ)) vocal effort levels respectively. Once the final desired model coefficients are computed, the models (IIc and Mc ) are evaluated at the original signal’s harF ) using the expression (2) to obtain the monic frequencies (F harmonic spectral envelopes. The harmonic spectral envelope is
Transcription
Loud Code-Book Model Units Selection
Soft
Model Units Selection
Modal
sign Interpolation Factor -1 1
γ
Time Interpolation
Mc
Ec HNM Modal Params P
A
Time Interpolation
Model Interpolation Ic Model Evaluation
F
Model Evaluation
Is
Ms
Scaling Amplitude Modification
Scaling Ratio
α
β
AM
α
β
HNM Synthesis
Figure 1: Schematic diagram of vocal effort interpolation method proposed.
Figure 2: Temporal linear interpolation of model coefficients. Mc ) and the desired vocal effort computed for both, the modal (M level (IIc ) coefficient matrices obtaining Ms and Is respectively. α) that will be applied to the HNM The multiplication factors (α A) from the original signal will be obtained from amplitudes (A the harmonic spectral envelopes quotient for each frame. Isk (4) Msk However, the magnitude of the harmonic spectral envelopes might contain values close to zero which could induce to numerical instabilities. In order to prevent this effect and focus on the energy distribution over the spectrum, the envelopes are scaled to fit into the range [1, 2] prior to carrying out the ratio α). for computing the multiplicative factors (α In order to emphasize the effect of the energy distribution, the factors are powered to a factor β. This factor depends on the desired magnitude of the signal modification. Powering the factors to β amplifies the difference between peaks and valleys in αk =
27
À. Calzada Defez, J.C. Socoró Carrié, R. Clark Table 2: SAMPA [14] transcription of the logatoms used in the first test. [ [ [
aI t - a: t - a:
-
t - a: f - u: m-U
-
p - aI f - a: m - a:
] ] ]
the harmonic spectral envelope after the modification is applied. A) are modified applying the Next the HNM amplitudes (A αβ ) obtaining the modified amplitudes (A AM ). powered factors (α Finally, the energy of each frame is adjusted in order to maintain the original energy magnitude that the frame had before applying any signal modification. Last step is synthesizing the signal with regular HNM F ) and resynthesis procedure using the original frequencies (F AM ). P ), and the modified amplitudes (A phases (P
3. Results Two perceptual tests were designed with the online testing platform for multimedia evaluation (TRUE) [15]. The first test with 22 users was focused on comparing the overall quality of the proposed method using ninth order polynomials against the previous proposal using low order LPC [10]. The second test with 21 users evaluated the performance of the proposed method interpolating vocal effort levels between the extreme levels available in the corpora (Low and High). At the beginning of each test, the users were presented a set of sample audio files expressing several vocal effort levels. In both tests the users were forced to decide between two answers (A or B). In order to prevent introducing any bias in the users’ answers, for each pair of audio files evaluated, their labels (A or B) were randomly assigned. All statistical significance (p-values) have been computed using one-tailed test. The values used in the tests for the α), β parameter, used for powering the multiplicative factors (α were set according to informal evaluations carried out prior to building the audio samples used in the conducted tests presented in this study. Thus, for the male gender β was set to 10, whereas for the female speaker it was set to 7. The first test consisted of 3 logatoms (see table 2) uttered by both genders. Each logatom was applied two vocal effort conversions, from modal to low (M2L) and modal to high (M2H). The conversions were carried out by each one of the two methods under evaluation. Thus, the test was compressed by a total of 16 audio samples presented to the user in pairs. For a given pair of samples, both samples corresponded to the same vocal effort conversion performed by each one of the two methods. The user was asked to answer the following two questions for each pair: 1. Omitting the signal quality, which of the following files -A or B- performs a Higher Vocal Effort? 2. Which of the following samples -A or B- has better signal quality? Table 3 presents the results of the first test where the performance of the proposed method was compared with the previous proposal [10]. The results show global preference for the new proposed method based on polynomial models interpolation. Regarding vocal effort modification there is a 53, 79% preference whereas in terms of signal quality this preference is more accentuated reaching a 82.95%. For obtaining the p-values of the results the null hypothesis (H0 ) was set to: There is no preference between the proposed method and the reference method
28
Table 3: Method preference according to vocal effort performance in test 1. P-value has been computed considering no preference between the methods as the null hypothesis (H0 ) Parameter evaluated Preference of P-value proposed method [%] Vocal effort conversion 53.7879 0.1093 Converted signal quality 82.9545 < 0.0001 [10]. The obtained p-values (p-value = 0.1093) state that in regards to vocal effort modification, there is no strong evidence for the proposed methodology. On the other hand, regarding to signal quality, the preference for the proposed methodology is statistically significant (p-value < 0.0001). Statistics have been computed using one-tailed significance tests to the sampling distribution. With the result obtained from the first test, we conclude that despite not presenting relevant improvement for extreme vocal effort modifications when compared with the previous approach [10], it performed better in terms of signal quality. This result proves the suitability of the proposed method for transferring vocal effort. The purpose of the second test was to verify the feasibility of using polynomial models to interpolate vocal effort levels. In order to prove its flexibility, several vocal effort levels were generated from the same modal vocal effort level utterance. Thus, using the modal (M) vocal effort level as a reference the following four vocal effort levels were synthesized: low (L), intermediate low (IL), intermediate high (IH) and high (H). Samples labelled as IH correspond to a linear interpolation of vocal effort levels high (H) and modal (M) with interpolation factor γ = 0.5 using the expression (3). Thus, samples labeled as IH were expected to be perceived between high (H) and modal (M) vocal efforts. On the other hand, samples labelled as IL, correspond a linear interpolation between low (L) and modal (M) vocal effort levels with an interpolation factor of γ = −0.5 applying equation (3). Likewise, samples labelled as IL were expected to be perceived as being between modal (M) and low (L) vocal effort levels. The perceived vocal effort level, for each synthesized sample, was compared with the samples corresponding to the surrounding vocal effort levels. Extreme vocal effort levels were also compared with the modal reference. Thus, the users evaluated the following vocal effort level pairs: L-IL, IL-M, M-IH, IH-H, L-M and M-H. Extreme vocal effort levels L and H were synthesized using the models from their respective code-books using γ = −1, for L, and γ = 1 for H. The question for each pair of samples was: Which of the following files -A or B- performs a Higher Vocal Effort?. Users were forced to choose between one of the two samples. Each pair presented to the user corresponded to two vocal effort levels synthesized from the same modal reference utterance for the same gender. The pairs presented to the user were randomized to prevent biases in the answers. Three logatomes were taken from each gender obtaining the six different utterances used for the second test (see table 4). Each user evaluated each conversion six times, adding up a total of 132 evaluations for each vocal effort level comparison. Tables 5 and 6 presents the results from the second test which evaluated the interpolation of vocal effort levels of the proposed methodology. Table 5 presents the results from the comparison of the synthesized versions for high (H) and low
8th ISCA Speech Synthesis Workshop • August 31 – September 2, 2013 • Barcelona, Spain Table 4: SAMPA [14] transcription of the logatoms used for the second test. [ [ [ [ [ [
t - a: t - a: t - a: t - a: t - a: t - a:
-
s - i: j-a l - i: t - o: r - @: p-Y
-
s - a: j - a: l - a: t - a: r - a: p - a:
] ] ] ] ] ]
Table 5: Perception of extreme vocal efforts synthesized with the modal vocal effort level. The null hypothesis (H0 ) was considered that users couldn’t perceive any vocal effort level difference between each pair of samples. VE level pair [%] P-value H>M 84.0909 < 0.01 M >L 90.9091 < 0.01 (L) vocal effort levels with the modal (M) version. Results state the general ordering for low (L), modal (M) and high (H) vocal effort levels. This results prove that samples synthesized with low vocal effort (L) are perceived as expected compared against modal (M), whereas those samples synthesized with high vocal effort (H) level are also perceived as expected when compared against the modal (M) reference. Thus, results from table 5, prove that users perceived the synthesized extreme vocal effort levels according to the following ordering: L < M < H. The analysis of interpolated vocal effort levels (IL and IH) can be found in table 6. As can be seen in table 6, IL synthesized samples, which are supposed to represent vocal effort levels between modal and low, were perceived as expected. When comparing IL with M, the success rate was 81.06%, while comparisons between IL and L presented a success rate of 76.51%. For both cases the p-value < 0.01. These results state the capability for interpolating vocal effort levels which entail lowering the voice tension. On the other hand, IH samples compress those samples generated from interpolating vocal effort levels between high H and modal M. Comparisons between IH and H were successfully recognized 81.82% of the times with p-value < 0.01. However, when comparing IH with M, the success rate was slightly favorable with a 56.81% with p-value = 0.0594. Results from table 5 and 6 demonstrate the capability of the proposed methodology to generate interpolated vocal effort levels with the following ordering: L < IL < M ≤ IH < H.
4. Discussion In previous work [10] a parametric model based on low order LPC was presented, however the model itself was sensitive to interpolation artefacts, which can lead to filter instabilities. So, the model presented serious difficulties for generating intermediate vocal effort levels. Other approaches are based on adding extra speech data in the corpus to cover the desired vocal effort levels to synthesize, but this creates a dependency between the model’s flexibility and the corpus size. In this study we presented a methodology using parametric models based on ninth order polynomials, instead of the low order LPC model, not only for transferring vocal effort, but also for generating new interpolated vocal effort levels not present in the corpora recordings. The proposed methodology has been tested against previous work [10] in terms of vocal effort modification and synthe-
Table 6: Ordering of the synthesized vocal effort (VE) levels. The null hypothesis (H0 ) was considered that users couldn’t perceive any vocal effort level difference between each pair of samples. VE level pair [%] P-value H > IH 81.8182 < 0.01 IH > M 56.8182 0.0594 M > IL 81.0606 < 0.01 IL > L 76.5152 < 0.01 sized signal quality. The results obtained from this comparison show that the presented methodology can reach the same degree of vocal effort modification as previous work while resulting in an improved signal quality in the final synthesis. The second test conducted has demonstrated that the presented method can be used for interpolating vocal effort levels. This has been possible due to linearity properties of the polynomial expressions used for interpolation. Despite presenting clear performance differences for most conversions, it is necessary to note the case when comparing IH against M where the effect is less robust. This could be a consequence of associating a wider vocal effort range to modal speech. The fact that statistical confidence increased for between IH and H makes us discard the possibility of the system to not being able to represent high vocal efforts. Thus, this uncertainty in intermediate high (IH) vocal effort with modal (M) levels could also be caused by non linear behavior of vocal effort perception or production. These findings extend the previous conducted work [10] not only in overcoming the problem for generating interpolated vocal effort levels, but also achieving better performance in terms of signal quality. In our proposed method, vocal effort models were adapted not only for phoneme identity but also for phoneme position in the recorded logatome. This decision was taken based on informal listenings of the corpora, which led us to realise that speakers realised a speaking pattern based on the syllable position within the utterance. Thus, this distinction was used in order to prevent effects due to the position of the syllable infer in the extraction of the harmonic spectral envelope models. In some logatomes presenting the same phonemes in several positions in the utterance, the achieved vocal effort modification varied from one position to the other. The fact of obtaining different harmonic spectral envelope models which produced different vocal effort degrees depending on the syllable position could be related with attack, decay, sustain and release situations. Whether this position distinction enhances the procedure or degrades its performance has not been evaluated for this corpora. However, when applying the model to sentences with semantic meaning, it might be important to consider the position of the syllables in the whole sentence. Moreover, when applying the model to expressive corpora with multiple emotions, the vocal effort modifications to be carried out, could depend on environment conditions such as whether the phoneme is stressed or not, position inside a stressed word or using accent-groups information such as [16]. The vocal effort model could be improved adding these additional information into the code-books. The proposed method could also be combined with prosodic modifications such as pitch, energy or speech rate articulation. The combination of these signal modifications could be used to carry out expressive synthesized speech conveying different emotions. The parameter β was introduced into the system’s workflow
29
À. Calzada Defez, J.C. Socoró Carrié, R. Clark α) despite as a result of noticing that the multiplicative factors (α achieving vocal effort modifications towards he expected target, the modification itself seemed laking some gain. This can be the consequence of scaling the harmonic spectral envelopes to fit into the range [1, 2] before applying the quotient to obtain α . The use of the parameter β allowed to adjust signal α) values are commodification degree. Multiplication factor (α pressed between the range [0.5, 2]. α values between (1, 2] increase the harmonic energy, whereas values from [0.5, 1) decrease the harmonics energy. To increase the modification magnitude α values were powered, thus increasing the magnitude of α ∈ (1, 2]) and attenuation the difference between amplifying (α α ∈ [0.5, 1)) values. The β values used in the experiments (α were heuristically chosen in order to make modification noticeable. Two values were chosen, one for each gender, and they were held constant for all the synthesized utterances. Some improvement should be done to have better control of the magnitude of the modifications applied by the multiplicative factors α). matrix (α The current version of the proposed method is speaker dependent, follow-up work should focus on applying the model to several speakers and attempt to learn the variations that the model experiment when the users vocal effort moves around the different vocal effort levels. Finding any common pattern among the different speakers could allow to generalize the model making it speaker independent, thus probably avoiding the requirement for extreme vocal effort recordings to be able to generate the interpolated target levels.
5. Conclusions The current work has presented a method of combining a polynomial model for vocal effort modification with HNM which allows us to transfer vocal effort from templates available in a corpus, as well as to generate interpolated vocal effort levels not present in the original recordings. A corpora specially designed for vocal effort research has been used in the experiments allowing us to isolate vocal effort from other effects usually present in natural speech presenting similar vocal effort conditions such as pitch or speed rate variations. The results present compelling evidence of the proposed system performing better than previous proposal [10]. Moreover, the results of a second test statistically support the proposed system’s capability for generating interpolated vocal effort levels. Further work will focus on learning the variations that experiment the model when moving among different vocal effort levels. This knowledge could allow to generate a speaker independent model which would allow to carry out vocal effort modifications to any speaker without any previous information about their parameter’s behavior in terms of vocal effort level shifting. This could be a crucial feature in applications where the TTS system has to perform several speaker registers such as in story-telling applications. Taking advantage of being a parametric model, it could potentially be employed by hidden Markov model (HMM) based speech synthesis systems in case appropriate acoustic features were being used.
6. Acknowledgments We would like to thank Dr. Mark Schr¨oder and DFKI for allowing us to use the NECA corpus which was specially designed for vocal effort research and Comisisionat per a Universitats i Recerca (CUR) from the DIUE of the Generalitat de Catalunya and the European Social Funds (2011 BE-DGR 01084) for funding
30
to visit CSTR.
7. References [1] A. Raux, B. Langner, A. W. Black, and M. Eskenazi, “Let’s go: Improving spoken dialog systems for the elderly and non-natives,” in Eurospeech03. Geneva, Switzerland: ISCA, September 2003, pp. 753–756. [2] Y. Stylianou and O. Capp´e, “A system for voice conversion based on probabilistic classification and a harmonic plus noise model,” in Proc. of the IEEE Int. conf. on acous., speech and signal processing, vol. 1, 1998, pp. 281–284. [3] C. Drioli, G. Tisato, P. Cosi, and F. Tesser, “Emotions and voice quality: experiments with sinusoidal modeling,” in VOQUAL03, Geneva, Switzerland, August 2003, pp. 127–132. [4] S.-J. Kim, J.-J. Kim, and M. Hahn, “Hmm-based korean speech synthesis system for hand-held devices,” IEEE Trans. on consumer electronics, vol. 52, no. 4, pp. 1384 –1390, November 2006. ` Calzada, I. Iriondo, and J. C. Socor´o, “Expressive [5] C. Monzo, A. speech style transformation: voice quality and prosody modification using a harmonic plus noise model,” in Speech prosody 2010, no. 100985, Chicago, May 2010. [6] O. T¨urk and M. Schr¨oder, “A comparison of voice conversion methods for transforming voice quality in emotional speech synthesis,” in Interspeech. Brisbane, Australia: ISCA, September 2008, pp. 2282–2285. [7] C. Gobl, E. Bennett, and A. N. Chasaide, “Expressive synthesis: how crucial is voice quality?” in Proc. of IEEE workshop on speech synthesis, 2002, pp. 91–94. [8] E. Rank and H. Pirker, “Generating emotional speech with a concatenative synthesizer,” in 5th Int. conf. on spoken language processing, Sydney, Australia, 1998, pp. 671–674. [9] M. Schr¨oder and M. Grice, “Expressing vocal effort in concatenative synthesis,” in 15th Int. conf. of phonetic sciences, 2003, pp. 2589–2592. ` Calzada and J. C. Socor´o, “Vocal effort modification through [10] A. harmonics plus noise model representation,” in Proc. of the 5th int. conf. on advances in nonlinear speech processing, ser. Lecture Notes in Computer Science, C. M. Travieso-Gonz´alez and J. B. Alonso-Hern´andez, Eds. Springer Berlin Heidelberg, 2011, vol. 7015, pp. 96–103. [11] Y. Stylianou, “Harmonic plus noise models for speech, combined with statistical methods, for speech and speaker modification,” Ph.D. dissertation, Ecole Nationale Superieure des Telecommunications, 1996. [12] D. Erro, “Intra-lingual and cross-lingual voice conversion using harmonic plus stochastic models,” Ph.D. dissertation, UPC, June 2008. [13] R. J. McAulay and T. F. Quatieri, “Speech analysis/synthesis based on a sinusoidal representation,” IEEE Trans. on acous., speech and signal processing, vol. 34, no. 4, pp. 744–754, August 1986. [14] Sampa computer readable phonetic alphabet. [Online]. Available: www.phon.ucl.ac.uk/home/sampa [15] S. Planet, I. Iriondo, E. Mart´ınez, and J. A. Montero, “True: an online testing platform for multimedia evaluation,” in Proc. of the 2nd Int. workshop on emotion: Corpora for research on emotion and affect at the 6th conf. on lang. resources & evaluation (LREC 2008), Marrakech, 2008. [16] D. Erro, I. Sainz, I. Luengo, I. Odriozola, J. S´anchez, I. Saratxaga, E. Navas, and I. Hern´aez, “Hmm-based speech synthesis in basque language using hts from ahotts to aho-hts,” in FALA 2010, no. 978-84-8158-510-0, Vigo, 2010, pp. 67–70.