An approach for space object tracking utilizing particle filters is presented. ... This relies on the ability to make observations of an orbiting object, either ... used in conjunction with the measurement information to perform a weight ...... Figure 7: Mahalanobis distance history the GMSREPF and GMSREKF for the object Skynet.
AIAA 2014-4308 SPACE Conferences & Exposition 4-7 August 2014, San Diego, CA AIAA/AAS Astrodynamics Specialist Conference
Particle Filter Methods for Space Object Tracking
Downloaded by MISSOURI S & T on September 1, 2014 | http://arc.aiaa.org | DOI: 10.2514/6.2014-4308
James S. McCabe∗ and Kyle J. DeMars† An approach for space object tracking utilizing particle filters is presented. New methods are developed and used to construct a robust constrained admissible region given a set of angles-only measurements, which is then approximated by a finite mixture distribution. This probabilistic initial orbit solution is refined using subsequent measurements through a particle filter approach. A proposal density is constructed based on an approximate Bayesian update and samples, or particles, are drawn from this proposed probability density to assign and correct weights, which form the basis for a more accurate Bayesian update. A finite mixture distribution is then fit to these weighted samples to reinitialize the cycle. This approach is compared to methods that approximate all probability densities as finite mixtures and process them as such. Both approaches utilize recursive estimation based on Bayesian statistics, but the benefits of densely sampling the support probability based on incoming measurements is weighed against remaining solely within the finite mixture approximation and performing measurement corrections there.
I.
Introduction
Developing a better understanding of the objects in orbit around the Earth requires robust and accurate methods to perform initial orbit determination (IOD) and follow-on tracking of both natural and artificial space objects (SOs). This relies on the ability to make observations of an orbiting object, either cooperative or uncooperative, and predict its future behavior. This is an approach that often employs recursive estimation techniques based upon Bayesian methods to refine the uncertainty present in the system. Any Bayesian estimation strategy requires a method to obtain a probabilistic representation of the initial state.1 The classical methods, when presented with line-of-sight data only, include Gauss’ Method,2 Laplace’s Method,2 Double r-Iteration,2 and Gooding’s method.3 Many approaches make use of one of these IOD steps and refine this initial estimate with batch processing before continuing to some sequential state estimation technique, such as the unscented Kalman filter.4, 5 The previously mentioned IOD steps require measurements consisting of at least six independent parameters such that an orbit can be fully characterized. Recent approaches to the IOD problem utilizing angles-only data and a range/range-rate space representation have emerged to make admissible region approaches6, 7 a convenient method of generating an initial orbit solution. The work presented here utilizes the concept of the constrained admissible region and interprets it probabilistically to produce an initial orbit solution that can then be refined using a handful of different estimation strategies. While previous work by DeMars et al.1, 8 has investigated the performance of unscented and extended Kalman filter equations utilizing a Gaussian mixture model (GMM) to refine this probabilistic initial orbit solution, this work will instead look to gauge the performance of a particle filter in the SO tracking problem. Particle filters have been demonstrated for other tracking applications, such as maritime state estimation as shown by Ristic.9 The increasing affordability of powerful computing resources have cleared the way for new approaches that have proven too computationally strenuous in the past. Particle filters are a promising form of suboptimal estimation for SO tracking since an ensemble of particles is able to accurately capture the uncertainty present in the non-Gaussian systems often found in such problems. Additionally, the level to which this uncertainty is captured by the particles is limited only by the number of samples drawn from any given distribution. This stands in stark contrast to more traditional methods that work solely with the mean and covariance of a distribution, i.e. a potentially limited subset of the actual distribution. ∗ Graduate Research Assistant, Department of Mechanical and Aerospace Engineering, Missouri University of Science and Technology, Rolla, MO † Assistant Professor, Department of Mechanical and Aerospace Engineering, Missouri University of Science and Technology, Rolla, MO
1 of 20 American Institute of Aeronautics and Astronautics Copyright © 2014 by James S. McCabe and Kyle J. DeMars. Published by the American Institute of Aeronautics and Astronautics, Inc., with permission.
Downloaded by MISSOURI S & T on September 1, 2014 | http://arc.aiaa.org | DOI: 10.2514/6.2014-4308
Synthetic angles-only data is used to construct an IOD solution based on the constrained admissible region. Section II elaborates upon new methods of generating this IOD solution, referred to here as the Robust Constrained Admissible Region (RoCAR). RoCAR allows the addition of constraints, characterizes and isolates any intersecting regions present, and constructs a GMM approximation of the regions. Once IOD is complete, Section III shows a variation of a particle filter design proposed by van der Merwe5 that is used to refine the IOD solution during follow-on tracking. The Gaussian components of the GMM, expressed as weights, means, and square-root factors of covariance, are propagated through system dynamics, as opposed to many particle filter algorithms that simply propagate the initial particles forward in time. The Gaussian mixture is then passed through a measurement correction similar to that of the Gaussian mixture square-root extended Kalman filter (GMSREKF) to generate the particle filter’s proposal density. This proposal density is a support distribution selected to represent measurements received by the estimator. It is sampled and used in conjunction with the measurement information to perform a weight update on the particles. Resampling generates a new set of equally weighted particles from which an Expectation-Maximization (EM) algorithm is used to construct a GMM to restart the cycle. This approach is referred to as the Gaussian mixture square-root extended particle filter (GMSREPF). Section IV outlines a simulation conducted to gauge the performance of the GMSREPF when compared to the GMSREKF. Finally, conclusions are drawn in Section V.
II.
RoCAR IOD
The RoCAR IOD process takes a sequence of angles-only data and produces an output that is the probabilistic initial orbit solution. The first step in the process is to apply a time curve fit to the raw angles-only data in order to convert the data to angles and angle rates. The curve fit process uses a specified number, p, of the raw angles-only data in order to apply a least-squares curve fit and generate derived angle and angle-rate data. This process is illustrated in Figures 1(a)–1(d). Figures 1(a) and 1(c) illustrate an example of the first p measurements of the right ascension, α, and the declination, δ, that are acquired by an optical telescope and passed along to the RoCAR IOD process. Figures 1(b) and 1(d) demonstrate the application of a least-squares curve fit to the angles-only data in order to produce angle and angle-rate data. It should be noted that while the data points in these figures appear to be perfectly linear, this is in fact an artifact of plotting. Due to the measurement noise that the simulated observations are subjected to, the data points exhibit a non-linear trend. Once the angle and angle-rate data are available, the admissible region can be constructed to generate a search space for all range and range rate pairs that produce possible orbit solutions. In this step, constraints on the semi-major axis and eccentricity, represented respectively by amax and emax , are used to reduce this search space in range and range-rate. The admissible region is a valuable resource in the space object tracking problem in that it generates a search space within which each range and range-rate pair it contains generates a valid orbit solution. Limiting the problem to a specific regime of orbital energies, i.e. only considering orbits with negative energy, is a simple way to eliminate all orbit solutions that are not Earth-captured. Adding constraints to this admissible region based on semimajor axis and eccentricity make the presented search space much smaller. A drawback to adding these constraints, however, is that the nature and geometry of these constrained regions is often highly unpredictable. It is often useful to interpret the admissible region geometrically, and a particularly challenging element to the problem using existing processes is in the presence of multiple isolated regions within the constrained admissible region. That is to say, most demonstrations of the admissible region are in the occurrence of a single area following constraint intersection, but research has shown that in the presence of an eccentricity constraint, multiple areas can be present such as the region shown in Figure 2. These areas present themselves as “lobes,” or closed, nearly elliptical areas bounded by the eccentricity constraint curve. While single lobed regions commonly present themselves and are relatively simple to process, regions such as Figure 2 can appear and can cause major issues in any process making assumptions on problem geometry. The case shown in Figure 2 will serve as an example for the RoCAR process, and it will be further referred to in order to illustrate the procedure. This example has been slightly modified to better illustrate the issues that such a geometry create. The observation of these problems has necessitated the development of this RoCAR construction in order to consistently return the correct admissible region regardless of problem geometry or SO type and involves new approaches using polynomial root characterization and root finding. The process can be summarized as constructing and solving the polynomials from which the admissible region is to be generated, predicting the
2 of 20 American Institute of Aeronautics and Astronautics
·104
6.1
6
α˙ [arcsec]
α [arcsec]
6.1
5.9 5.8
·104
6 5.9 5.8
0
40
80
120
160
0
40
t [sec]
160
(b) A least-squares curve fit of the data points allows the extraction of α and α˙ data.
·104
·104 1.31 δ˙ [arcsec]
1.31 δ [arcsec]
120
t [sec]
(a) Right ascenstion measurements α over time.
Downloaded by MISSOURI S & T on September 1, 2014 | http://arc.aiaa.org | DOI: 10.2514/6.2014-4308
80
1.3 1.29
1.3 1.29
0
40
80
120
160
0
40
t [sec]
80
120
160
t [sec]
(c) Declination measurements δ over time.
(d) A least-squares curve fit of the data points allows the extraction of δ and δ˙ data.
Figure 1: Acquiring angle and angle-rate data from angles-only information.
zones within which closed regions exist, characterizing the roots of the polynomials in question, intersecting all constraints, and finally approximating the admissible region with a GMM. A. 1.
Polynomial Construction and Solution Considering Orbital Energy
Given the previously described short-arc sequence of optical measurements of α and δ and the derived ˙ the region of range and range-rate space that contains all orbits with negative measurements of α˙ and δ, orbital energy can be computed. Consider the two-body energy, given by E =
˙ 2 krk µ − , 2 krk
(1)
where µ is the gravitational parameter of the central body, r is the inertial position of the object with respect to the center of the central body, and r˙ is the inertial velocity of the object with respect to the center of the central body. As the observation is made by some ground station on the surface of the central body, r =q+ρ
and r˙ = q˙ + ρ˙ ,
where q and q˙ are the inertial position and velocity of the ground station, and ρ and ρ˙ are the inertial position and velocity of the object with respect to the ground station. Let the object’s position and velocity be given in spherical coordinates in terms of range, ρ, right ascension, α, declination, δ, and their time rates of change, such that ρ = ρuρ
˙ δ, and ρ˙ = ρu ˙ ρ + ραu ˙ α + ρδu
3 of 20 American Institute of Aeronautics and Astronautics
20
ρ˙ [km/s]
10 0 −10 −20
0
2
4
6
8
ρ [ER]
Downloaded by MISSOURI S & T on September 1, 2014 | http://arc.aiaa.org | DOI: 10.2514/6.2014-4308
Figure 2: Curves of E = 0 (dashed), constant amax (black), and constant emax (red).
where uρ , uα , and uδ are given by cos α cos δ uρ = sin α cos δ , sin δ
− sin α cos δ uα = cos α cos δ , 0
− cos α sin δ and uδ = − sin α sin δ . cos δ
For simplification of expressions, define w0 = kqk2 , w1 = 2 (q˙ · uρ ) , w2 = α˙ 2 cos2 δ + δ˙ 2 , ˙ 2 , w5 = 2 (q · uρ ) . w3 = 2α˙ (q˙ · uα ) + 2δ˙ (q˙ · uδ ) , w4 = kqk The squared Euclidean norms of the object’s position and velocity with respect to the center of the central body are then found to be krk2 = ρ2 + w5 ρ + w0 2
2
(2a) 2
˙ = ρ˙ + w1 ρ˙ + w2 ρ + w3 ρ + w4 . krk
(2b)
Substituting Eqs. (2a) and (2b) into Eq. (1) results in the expression 2E = ρ˙ 2 + w1 ρ˙ + F (ρ),
(3)
2µ F (ρ) = w2 ρ2 + w3 ρ + w4 − p . 2 ρ + w5 ρ + w0
(4)
where
Eq. (3) may be rewritten in standard quadratic form by subtracting 2E from both sides, giving ρ˙ 2 + w1 ρ˙ + F (ρ) − 2E = 0, which may be solved for two solutions of ρ˙ as w1 ρ˙ = − ± 2
r� � w 2 1
1
− F (ρ) + 2E .
(5)
Limiting the problem to only consider orbits with negative energy guarantees that orbit solutions of parabolic or hyperbolic nature are not considered. Adding constraints to the admissible region allows the number of possible orbit solutions, represented as range/range-rate pairs, to be greatly reduced based on imposed orbital limitations. It is often useful to constrain the admissible region based on an orbit’s semimajor axis and eccentricity.1 4 of 20 American Institute of Aeronautics and Astronautics
2.
Semi-Major Axis Constraint
One constraint that can be added is that of semimajor axis, or equivalently energy since the two are related by E =−
µ , 2a
(6)
where a is the semimajor axis. By setting a value for the semimajor axis, an equivalent energy value may be determined from Eq. (6). Then, by using this value of energy, Eq. (5) may be solved for range-rate given range, which yields a curve of constant semimajor axis in the range/range-rate space. 3.
Eccentricity Constraint
Another useful constraint is that of the orbit eccentricity. To develop the eccentricity constraint, first consider the specific angular momentum as Downloaded by MISSOURI S & T on September 1, 2014 | http://arc.aiaa.org | DOI: 10.2514/6.2014-4308
h = r × r˙ .
(7)
Defining the vector parameters ˙ δ) , h2 = uρ × (αu ˙ α + δu ˙ δ ) , and h4 = q × q˙ , h3 = uρ × q˙ + q × (αu ˙ α + δu h1 = q × uρ ,
it can be shown that the specific angular momentum is given by h = h1 ρ˙ + h2 ρ2 + h3 ρ + h4 . Defining the scalar parameters c0 = kh1 k2 , c5 = 2h2 · h3 ,
c1 = 2h1 · h2 ,
c2 = 2h1 · h3 ,
c6 = 2h2 · h4 + kh3 k2 ,
c3 = 2h1 · h4 ,
c7 = 2h3 · h4 ,
c4 = kh2 k2 ,
and c8 = kh4 k2 ,
it can be shown that the squared Euclidean norm of the specific angular momentum is given by khk2 = c0 ρ˙ 2 + P (ρ)ρ˙ + U (ρ) ,
(8)
where P (ρ) = c1 ρ2 + c2 ρ + c3 U (ρ) = c4 ρ4 + c5 ρ3 + c6 ρ2 + c7 ρ + c8 . The eccentricity is related to both the specific angular momentum and specific energy by10 s 2E khk2 e= 1+ , µ2 which may be rearranged as 2E khk2 = −µ2 (1 − e2 ) .
(9)
Substituting for 2E from Eq. (3) and for khk2 from Eq. (8) into Eq. (9), it follows that (ρ˙ 2 + w1 ρ˙ + F (ρ))(c0 ρ˙ 2 + P (ρ)ρ˙ + U (ρ)) = −µ2 (1 − e2 ) , which may be rewritten as a4 ρ˙ 4 + a3 ρ˙ 3 + a2 ρ˙ 2 + a1 ρ˙ + a0 = 0 ,
5 of 20 American Institute of Aeronautics and Astronautics
(10)
where a4 = c0 ,
a3 = P (ρ) + c0 w1 ,
a1 = F (ρ)P (ρ) + w1 U (ρ) ,
a2 = U (ρ) + c0 F (ρ) + w1 P (ρ) ,
and a0 = F (ρ)U (ρ) + µ2 (1 − e2 ) .
Therefore, given a value of eccentricity, a curve of constant eccentricity may be determined by solving for the roots of Eq. (10), which is a quartic equation in ρ˙ for given values of ρ, and discarding any imaginary values. The solutions of this quartic equation for any range-rate given range are very unpredictable, a quality not favorable to robust and consistent IOD mechanisms. To build an admissible region based IOD method that doesn’t rely on any assumptions of problem geometry, methods based on polynomial end-point behavior and root characterization were developed to isolate zones that contain eccentricity bounded regions, isolate each individual region, and perform intersection of these regions with the semimajor axis constrained curve.
Downloaded by MISSOURI S & T on September 1, 2014 | http://arc.aiaa.org | DOI: 10.2514/6.2014-4308
B.
Zone Finding
In order to best explain how problem dependent geometries are handled by RoCAR, the terminology “birth” and “death” will be used to describe the appearance and disappearance of a region bounded by the quartic polynomial given by the eccentricity constraint with respect to the range direction. When moving along the range axis as it increases, the appearance of a “lobe” (a closed area bounded by the curve of constant eccentricity) in the eccentricity polynomial solutions is considered a birth. Looking along the axis in the same fashion, a lobe disappearing is considered a death. At both the location of a birth and the location of a death there exists at least two equal roots to the polynomial. Work presented by Jury11 allows RoCAR to characterize the roots of the quartic polynomial given by the eccentricity constraint. Such an analysis has many very useful applications, such as characterizing the realness and sign of each of the four quartic polynomial roots by utilizing the polynomial discriminant and characteristic expressions. Making use of these allows the characterization of root structure, such as determining if the polynomial contains four distinct real roots, two pairs of repeated real roots, two distinct real roots and a complex conjugate pair of roots, two repeated real roots and a complex conjugate pair of roots, or two pairs of complex conjugate real roots. In the event that the polynomial discriminant equals zero, it is guaranteed that at least two equal real roots exist. As previously stated, in the event of an eccentricity region being born or dying, that region will have two equal roots at the event of its birth or death. It then follows that any time the discriminant equals zero, an eccentricity region is either appearing or disappearing. The discriminant ∆ for a quartic polynomial of the form f (x) = x4 + a1 x3 + a2 x2 + a3 x + a4 is given by ∆ = 4I 3 − J 2 ,
(11)
where I = a22 + 12a4 − 3a1 a3 J = 72a2 a4 + 9a1 a2 a3 − 2a32 − 27a23 − 27a4 a21 . This discriminant allows the admissible region to be divided up into test zones, with every ∆ = 0 forming their boundaries. This set of test zones offer places within which to perform region labeling, or identifying where a region starts, where a region ends, and where there are no regions. Note that the polynomial expression above contains no coefficient on the fourth degree term. In the event of a coefficient present here, such as with the eccentricity polynomial, simply normalize the expression by that coefficient. It can be argued that such an analysis is unnecessary in the event of only one eccentricity region given a window of range values; however, remembering that the goal of RoCAR is to be robust in the presence of arbitrary problem geometry and that multiple regions (as seen in Figure 2) can exist for the same window of range values, it is important to characterize which roots belong to which region such that region intersection with the curve of constant semimajor axis can be effectively and reliably performed. To this effect, further analysis is required to assign each pair of roots to a region in the event of overlapping regions. The zonal 6 of 20 American Institute of Aeronautics and Astronautics
boundaries computed using this process can be seen in Figure 3(a) with the example being split into seven test zones, and Figure 3(b) shows a zoomed view of how the eccentricity lobes overlap for a window of range values. At first glance it may not be clear that the eccentricity lobes are not symmetric about the range-axis but it is an important observation to make, something that the enhanced view of Figure 3(b) makes more clear. Some Some Some 1 text text text 20
Some Some text text
10 ρ˙ [km/s]
ρ˙ [km/s]
10 0
Downloaded by MISSOURI S & T on September 1, 2014 | http://arc.aiaa.org | DOI: 10.2514/6.2014-4308
−10 −20
1SomeSome text Some text text
20
0
0
2
4
2
0
1
1.2
−10
0
2
4
6
8
−20
0.6
ρ [ER]
0.8 ρ [ER]
(a) Boundaries of the zones defined by the discrim-(b) Enchanced view of (a) with the number of real inant analysis, in this example consisting of 7 roots returned by the Sturm analysis in the zones. corresponding zones.
Figure 3: RoCAR zone finding and root counting.
C.
Sturm’s Theorem
The discriminant analysis segments the range direction of the admissible region into a set of zones within which there exists either no regions, a single region, or two regions created by the curve of constant eccentricity. In order to determine where lobes exist, the four roots in each zone must be characterized: the roots of the quartic polynomial are either four complex numbers, two unique real and two complex numbers, or four unique real numbers. Note that normally the uniqueness of the real numbers within the zones could not be guaranteed, except that the location of all the repeated root locations were determined previously using ∆. The task is now to determine how many real roots exist in a given zone, which is equivalent to counting if there exists zero, one, or two regions for a given range value. RoCAR achieves this using Sturm’s Theorem.12, 13, 14 Sturm’s Theorem states that given some polynomial g(x) with real coefficients and simple roots over the tested, half-closed interval (a, b], the difference of the number of sign changes in the Sturm chain evaluated at a and b is equal to the number of real roots in the interval. For example, if ξ(x) denotes the sum of all sign changes within the Sturm chain at x, Sturm’s Theorem guarantees that if a < b, the number of real roots R over the interval (a, b] is given by R = ξ(a) − ξ(b) . Since the Sturm chain will be evaluated within the previously found zones, it is guaranteed that the roots are simple. If g(x) is the polynomial of interest, the Sturm chain is defined as g0 (x) = g(x) g1 (x) = g 0 (x) g2 (x) = −rem(g0 , g1 ) g3 (x) = −rem(g1 , g2 ) .. . The chain is concluded once the polynomial division offers no remainder. Sturm’s Theorem allows the counting of how many regions are present given a range value and thus allows RoCAR to determine which 7 of 20 American Institute of Aeronautics and Astronautics
Downloaded by MISSOURI S & T on September 1, 2014 | http://arc.aiaa.org | DOI: 10.2514/6.2014-4308
roots belong to which region. This root characterization must happen once for each zone, and the range values at which this characterization is performed are chosen to be directly between the test zone’s boundaries (though anywhere inside the zone and not on the boundary is a valid test point). While it has been made trivial by zone finding to determine the range values at which to perform the Sturm chain evaluation, determining the range-rate values to serve as the upper and lower bounds of the interval (a, b] requires additional consideration. Testing at positive and negative infinity is a reasonable first thought, but a function evaluation at infinity is not amiable to computers. In order to guarantee that the only roots considered are ones that a computer can interpret without issue, the E = 0 polynomial is considered. Since only Earth-bound orbits are considered, the curves of constant eccentricity always fall within the E = 0 region. Therefore, the largest range-rate value on the E = 0 curve may be used to determine a and b in order to evaluate the Sturm chain and determine the number of real roots within a zone. The largest value of range-rate that the E = 0 curve attains is found by differentiating the E = 0 polynomial, setting it equal to zero, and checking for maxima and minima to serve as a pair of virtual infinities to bound the test interval. It turns out that the polynomial of E˙ considered in solving E˙ = 0 is of degree eight and has coefficients of widely varying orders of magnitude. It is common to cast the rootfinding of a polynomial as an eigenvalue problem where the eigenvalues of a companion matrix are computed using QR, but this approach was found to be inaccurate, unreliable, and numerically sensitive given the high degree polynomial of widely varying coefficients. To obviate the issues caused by this approach, the generalized eigenvalue problem is used instead and has been shown to greatly improve the performance of rootfinding in such ill-conditioned polynomials.15 The generalized eigenvalue problem for some polynomial of degree n with coefficients an , an−1 , . . . , a1 , a0 , given by Ax = λBx with
0
A − λB = −a0
1 .. . ...
..
. 0 ...
1 −an−1
1 − λ
..
. 1 an
solved using a QZ solver, has been shown to offer much better results in the solution of such polynomials. The maximum and minimum of the solutions of E˙ = 0 are accepted as the bounds in the Sturm chain evaluations. Figure 3(b) shows the results of the evaluations of Sturm’s Theorem on the overlapping lobes in each of the test zones as circled numbers, counting either zero, two, or four real roots. When Sturm’s Theorem finds zero real roots at a given range value, there are no lobes within that zone. When Sturm’s Theorem returns two or four real roots, there exists one or two lobes respectively at the zone of the given range value. This effectively performs region counting and results in RoCAR identifying that there are in fact three regions to consider in the problem shown in Figure 3(b). D.
Region Separation and Intersection
The region of the semimajor axis constraint is taken to be all areas of positive range from the origin but not beyond the curve of constant amax . The eccentricity constraint appears in closed lobes on the potentially numerous curves of a single constant emax . Now that the regions have been counted, separating the lobes is important to properly determining the interior of the eccentricity regions to correctly intersect them with the semimajor axis constrained region. RoCAR has performed the characterization of these regions and is then able to perform region intersection, taking the final region to be the union of all regions generated by the constraints. This intersection of potentially numerous regions greatly reduces the search space contained by the admissible region and allows for a probabilistic orbit solution with a much smaller region of uncertainty. Figure 4 exhibits the counting, separation, and intersection of the polynomial curves, resulting in the constrained admissible region. E.
Gaussian Mixture Approximation
Once the constrained admissible region is constructed, it can then be interpreted probabilistically to generate a set of possible orbit solutions. The process of constructing the Gaussian mixture approximation 8 of 20 American Institute of Aeronautics and Astronautics
20
20 10
2
0
3 1
−10 −20
ρ˙ [km/s]
ρ˙ [km/s]
10
0
0 −10
2
4
6
8
−20
0
2
ρ [ER]
4
6
8
ρ [ER]
Downloaded by MISSOURI S & T on September 1, 2014 | http://arc.aiaa.org | DOI: 10.2514/6.2014-4308
Figure 4: Region counting and constraint intersection.
of the admissible region has been shown in-depth by DeMars,1 a procedure which leverages the fact that no range/range-rate pair within the admissible region can be said to be any more likely than another and yields a two-dimensional uniform probability density function (pdf) in the range and range-rate plane. The Gaussian mixture that is constructed by the procedure shown in Reference 1 results in a pdf of the form pρ,ρ˙ (ρ, ρ) ˙ =
L X
(j)
(j)
(j)
wρ,ρ˙ pg (xρ,ρ˙ ; mρ,ρ˙ , Pρ,ρ˙ )
(12)
j=1
with the Gaussian pdf of the form � � −1/2 1 (j) (j) (j) (j) �T (j) −1 (j) � pg (xρ,ρ˙ ; mρ,ρ˙ , Pρ,ρ˙ ) = 2πPρ,ρ˙ exp − xρ,ρ˙ − mρ,ρ˙ Pρ,ρ˙ xρ,ρ˙ − mρ,ρ˙ , 2 (j)
(j)
(j)
where wρ,ρ˙ , mρ,ρ˙ , and Pρ,ρ˙ represent the weights, means, and covariances of an L-component Gaussian mixture distribution that approximates the uniform distribution of the constrained admissible region. In this work, the pdf given by the GMM approximation of the admissible region shown in Eq. (12) will be manipulated and refined in terms of square-root factors, yielding the expression for the pdf as pρ,ρ˙ (ρ, ρ) ˙ =
L X
(j)
(j)
(j)
wρ,ρ˙ pg (xρ,ρ˙ ; mρ,ρ˙ , Sρ,ρ˙ ) ,
(13)
j=1 (j)
(j)
where Sρ,ρ˙ is a square-root factor of the covariance matrix Pρ,ρ˙ and the Gaussian pdf is written as pg (xρ,ρ˙ ;
(j) (j) mρ,ρ˙ , Sρ,ρ˙ )
� o−1 2 � n √ 1 (j) −1 (j) (j) = abs 2π Sρ,ρ˙ exp − Sρ,ρ˙ (xρ,ρ˙ − mρ,ρ˙ ) . 2 2
This approach will be covered in more detail in the following sections, but for now it is important to note that the square-root factor S is used as a replacement for the state covariance here. The Gaussian mixture construction allows control of the approximation of the admissible region using limits that define the maximum size of each Gaussian mixture component. Specifically, the values of σρ,max and σρ,max are input into the algorithm and a search is performed to determine the best fit such that ˙ the Gaussian components in Eq. (12) have standard deviations less than the maximum parameter in their respective directions. These parameters also directly influence the number of Gaussian components that are generated in the initialization process. Smaller values will generate a larger number of components and a more accurate approximation of the constrained admissible region. The approximation of the constrained admissible region generated by RoCAR in range/range-rate space can be seen in Figure 5. Since Eq. (12) represents the probability density in range/range-rate space, this Gaussian mixture pdf, represented as a set of weights, means, and square-root factors, must then be transformed into the coordinate system to be used 9 of 20 American Institute of Aeronautics and Astronautics
in the refinement of the region. This work will employ the equinoctial orbital elements, constructed from the classical orbital elements as16 a
h = e sin (ω + Ω)
p = tan (i/2) sin Ω
`=Ω+ω+ν
k = e cos (ω + Ω)
q = tan (i/2) cos Ω ,
and it is here that the GMM approximation of the constrained admissible region is mapped to be passed to the GMSREPF, concluding the RoCAR process. 20
Downloaded by MISSOURI S & T on September 1, 2014 | http://arc.aiaa.org | DOI: 10.2514/6.2014-4308
ρ˙ [km/s]
10 0 −10 −20
0
2
4
6
8
ρ [ER] Figure 5: GM approximation of the constrained admissible region.
III. A.
The GMSREPF
Problem Statement
Consider the nonlinear dynamical system xk = f (xk−1 )
(14)
with xk representing the system’s state at time k and f (·) representing the dynamics for which closed form solutions are known. The state is indirectly observed through discrete-time nonlinear measurements at time tk zk = h(xk , tk ) + vk , where the measurement zk is comprised of the differentiable nonlinear measurement function h(·) and corruption through zero-mean white noise sequence vk with known covariance Vk . For this paper, these measurements will be angles-only optical measurements made from a ground station. A common particle filter approach would draw a set of samples from an initial pdf and propagate those particles forward using the system dynamics to the time of an incoming measurement. The propagated particles would then be compared to a proposal distribution, and, using importance sampling, the a posteriori pdf can be computed. This work instead utilizes an approach similar to that proposed by van der Merwe5 in which the initial pdf is taken to be a GMM. This GMM is propagated forward in time and subjected to a GMSREKF update. The GMSREKF update is then taken as the proposal distribution, from which samples are drawn to allow the particle filter’s corrector stage to perform a weight update. The GMSREPF weight update uses the samples from the proposal distribution and measurement agreement to the set of particles to assign weights to each particle. A GMM is then constructed using the weighted particles to be propagated, restarting the cycle.
10 of 20 American Institute of Aeronautics and Astronautics
B.
Initialization
The uncertainty in the initial state x0 is described by the L-component Guassian mixture pdf p(x0 ) =
L X
αi,0 pg (x0 ; mi,0 , Si,0 ) ,
i=1
where the individual component weights of the Gaussian mixture are constrained such that 0 ≤ αi ≤ 1 ∀ i ∈ {1, . . . , L}
and
L X
αi = 1 .
Downloaded by MISSOURI S & T on September 1, 2014 | http://arc.aiaa.org | DOI: 10.2514/6.2014-4308
i=1
The means, given by mi , represent the regions within the mixture that contain the highest probability mass and each correspond to a component weight, αi , which represents the normalized probability of the localized probability mass. The mixture weights, given by αi , can be used to remove the consideration of components whose probability becomes effectively zero at some point. The square-root factors, given by Si , define a state space region about a given mean outside of which the GMM evaluates to zero.1 This initial condition, a GMM approximation of the admissible region representing uniform uncertainty across all constrained Earth-bound orbit solutions, is then employed as the starting condition in a predictor-corrector which processes the additional data in an attempt to reduce the total region of possible orbit solutions. Square-root factors of covariance are employed in this work to represent system uncertainty because in the absence of process noise in the system model, as is common in orbit determination problems, issues arise in maintaining the positive-definiteness of the state covariance matrix, Pi . By defining a square-root factor Si such that Pi = Si SiT , the positive-definite and symmetric nature of Pi is guaranteed to be preserved for each GMM component and the issue of numerical sensitivity is greatly reduced, yielding a much more numerically stable estimator. C.
Predictor
The initial GMM pdf must be propagated over the time interval t ∈ [tk−1 , tk ]. Based on the pdf at tk−1 shown by p(xk−1 | Z k−1 ) =
L X
+ + α`,k−1 pg (xk−1 ; m+ `,k−1 , S`,k−1 ) ,
`=1
the pdf at tk can be approximated with p(xk | Z k−1 ) =
L X
− − α`,k pg (xk ; m− `,k , S`,k ) .
(15)
`=1
Since the pdf is a mixture of components based on weights, means, and square-root factors, each component can be propagated individually. Each component ` ∈ {1, 2, . . . , L} has its weight held constant over the propagated time step. This means that − + α`,k = α`,k−1
for all ` in the pdf. Component means are propagated with the discrete-time dynamics shown in literature as16 + m− k = f (mk−1 ) .
Square-root factors of state estimation covariance are propagated as − + S`,k = Φk|k−1 S`,k−1 ,
where Φk|k−1 is the system’s state transition matrix from tk−1 to tk . This work uses two-body dynamics with a point mass gravity field. Higher order dynamics could be readily included by mapping the GMM into Cartesian coordinates during propagation, numerically integrating using any set of dynamical models, and then mapping back into the coordinate system of interest. This would be repeated for all propagation steps. 11 of 20 American Institute of Aeronautics and Astronautics
D.
Proposal Distribution Generation
Following the propagation of the pdf from tk−1 to tk , a measurement zk is used to define a proposal density from which a weight update for the particle filter can be performed. Note that this is the corrector step in the GMSREKF as shown in literature8 but is not taken to be the measurement update in the GMSREPF. The proposal distribution generated here will instead be used as a support distribution to perform the measurement correction in the particle filter scheme. With the set of all measurements up to and including zk known as Z k , the proposal pdf, given by q(xk | Z k ) =
L X
+ + α`,k pg (xk ; m+ `,k , S`,k ) ,
(16)
`=1
Downloaded by MISSOURI S & T on September 1, 2014 | http://arc.aiaa.org | DOI: 10.2514/6.2014-4308
requires the updated weights, means, and square-root factors of the GMM pdf. The conditional pdf of the current measurement is also required, and in this work is assumed to be Gaussian of the form p(zk | xk ) = pg (zk ; h(xk , tk ), Vk ). However, this method does not require this pdf to be Gaussian and extending the method to a non-Gaussian pdf is possible. Knowing the updated weights to be18 − β`,k α`,k + α`,k = PL , − i=1 βi,k αi,k
the component weight gain β`,k must be computed using β`,k = pg (zk ; h(m− `,k , tk ), P`,z ) .
(17)
The term P`,z represents the predicted measurement covariance and is given by − T P`,z = H`,k P`,k H`,k + Vk
(18)
where H`,k is a linearization of the measurement function h(·) with respect to the state vector, computed in the manner described in literature.17, 8 Rewritten using square-root factors, Eq. (18) can be shown as − −T T T S`,z S`,z = H`,k S`,k S`,k H`,k + Lk LT k ,
where Vk = Lk LT k , and factoring terms gives h T − S`,z S`,z = H`,k S`,k
Lk
ih
− H`,k S`,k
Lk
iT
.
(19)
Now consider the problem of a QR-decomposition written as AT = QRT with unitary matrix Q and lower-triangular matrix R (i.e. RT is upper-triangular). Rewriting as A = RQT gives the form AAT = RQT QRT = RRT h − and confirms that R is a valid square-root factor of A. Therefore, substituting A = H`,k S`,k Eq. (19) into Eq. (20) and forming this as a QR-decomposition of the form h iT T − H`,k S`,k Lk = QS`,z
(20) i Lk from
gives the transpose of the square-root factor S`,z . Noting that Eq. (17) can be written in terms of square-root factors, it can be used to compute the component weight gains. To update the mean and covariance for each element, the component-wise Kalman gain can be computed as −1 −T −1 K`,k = P`,xz P`,z = P`,xz S`,z S`,z
12 of 20 American Institute of Aeronautics and Astronautics
with cross covariance P`,xz . From the equations of the Kalman filter, the mean and covariance can then be updated using h i − − m+ (21) `,k = m`,k + K`,k zk − h(m`,k , tk ) + − T P`,k = P`,k − K`,k P`,z K`,k .
(22)
Substituting in for square-root factors, Eq. (22) becomes + + T − − T T T S`,k S`,k = S`,k S`,k − K`,k S`,z S`,z K`,k .
Defining U`,k = K`,k S`,z gives + + T − − T T S`,k S`,k = S`,k S`,k − U`,k U`,k ,
(23)
Downloaded by MISSOURI S & T on September 1, 2014 | http://arc.aiaa.org | DOI: 10.2514/6.2014-4308
and if n × m array U`,k with measurement dimension m and state dimension n, h T U`,k U`,k = u1
u2
...
um
ih
uT 1
uT 2
...
uT m
iT
.
Eq. (23) then becomes + + T − − T T T S`,k S`,k = S`,k S`,k − u1 uT 1 − u2 u2 − · · · − um um
which is readily cast as a sequence of m rank-1 Cholesky downdates. For example, with measurements of α and δ such that m = 2 (as in the problem presented in this paper), the rank-1 downdate − ˜− T − − T S˜`,k S`,k = S`,k S`,k − u1 uT 1
is computed first, and then the updated square-root factors are found via a second application of the rank-1 downdate + + T − ˜− T S`,k S`,k = S˜`,k S`,k − u2 uT 2 .
Given all these things, a proposal distribution q(xk | Z k ), taken to be the GMM expressed in Eq. (16), can be used to perform a correction on the state estimate using incoming measurements. E.
Corrector/Weight Update
Having full knowledge of the a priori GMM pdf p(xk | Z k−1 ), a set of support points are taken from the (i) proposal pdf to be xk ∼ q(xk | Z k ) i = 1, 2, . . . , N , and the posterior density can be approximated as a set of particles using p(xk | Z k ) ≈
N X
(i)
(i)
wk δ(xk − xk )
(24)
i=1 (i)
with some set of weights wk corresponding to each support particle and Dirac delta function δ(·).9 These weights are chosen to be given by (i)
(i)
wk ∝
p(xk | Z k ) (i)
q(xk | Z k )
.
(25) (i)
(i)
The normalized and unnormalized particle weights will be called wk and w ˜k respectively. Taking X k to be the complete state history of xk , a weight update can be developed by starting with Bayes’ Rule as p(X k | Z k ) =
p(zk | X k , Z k−1 )p(X k | Z k−1 ) . p(zk | Z k−1 )
13 of 20 American Institute of Aeronautics and Astronautics
(26)
Factoring p(X k | Z k−1 ) gives p(X k | Z k ) =
p(zk | X k , Z k−1 )p(xk | X k , Z k−1 )p(X k−1 | Z k−1 ) p(zk | Z k−1 )
and ultimately the relationships p(zk | xk )p(xk | xk−1 ) p(X k−1 | Z k−1 ) p(zk | Z k−1 )
p(X k | Z k ) =
∝ p(zk | xk )p(xk | xk−1 )p(X k−1 | Z k−1 ) . Substituting these relationships into Eq. (25) and choosing q(X k | Z k ) to factor as q(X k | Z k ) = q(xk | X k−1 , Z k )q(X k−1 | Z k−1 ) , an expression for the unnormalized particle weights can be written as Downloaded by MISSOURI S & T on September 1, 2014 | http://arc.aiaa.org | DOI: 10.2514/6.2014-4308
(i)
(i) w ˜k
∝
(i)
(i)
p(zk | xk )p(xk | xk−1 )p(X k−1,(i) | Z k−1 ) (i)
q(xk | X k−1,(i) , Z k )q(X k−1,(i) | Z k−1 ) (i)
(i)
=w ˜k−1
(i)
(i)
p(zk | xk )p(xk | xk−1 ) (i)
q(xk | X k−1,(i) , Z k )
Since only the current state xk and the estimate of the posterior pdf p(xk | Z k ) are of interest, the state and measurement histories can be discarded from the proposal density and make use of only xk−1 and zk . Also, the support pdf q(xk | xk−1 , zk ) is independent of xk−1 , so using these things, the proposal density can be rewritten as9 q(xk | X k−1 , Z k ) = q(xk | zk ) . This allows us to express the weight update using the array of particles as (i) w ˜k
=
(i) p(zk w ˜k−1
(i)
(i)
(i)
| xk )p(xk | xk−1 ) (i)
(i)
q(xk | xk−1 , zk )
and, used in conjunction with Eq. (24), allows an approximation of p(xk | Z k ) using the GMM proposal density q(xk | Z k ). Such a proposal density has been shown to concentrate particles toward areas of high probability and thus alleviate issues caused by the well-studied particle degeneracy problem.9 Typically, p(xk | xk−1 ) is taken to be a Gaussian distribution, where the distribution is related to the uncertainty in the dynamical system model. Since no uncertainty is present in the model considered herein, p(xk | xk−1 ) cannot be evaluated in the usual sense. To obviate this issue, it has been suggested by van der Merwe to replace this term with an approximation as5 h i Z (i) (i) E p(xk | xk−1 ) = p(xk | xk−1 )p(xk−1 | Z k−1 )dxk−1 (i)
≈ p(xk | Z k−1 ) ≈
L X
(i)
− − α`,k pg (xk ; m− `,k , S`,k ) .
`=1 (i)
Accordingly, in lieu of drawing samples from p(xk | xk−1 ) to compute the weight update, instead samples (i) are drawn from the prior p(xk | Z k−1 ), yielding the final form of the weight update in the GMSREPF as (i)
(i)
(i)
w ˜k = w ˜k−1
(i)
p(zk | xk )p(xk |Z k−1 ) (i)
q(xk | zk ) (i) PL (i) − − − `=1 α`,k pg (xk ; m`,k , S`,k ) (i) p(zk | xk ) =w ˜k−1 . PL (i) + + + `=1 α`,k pg (xk ; m`,k , S`,k ) 14 of 20
American Institute of Aeronautics and Astronautics
(27)
Finally, the weights are normalized as (i)
w ˜ (i) w k = PN k i=1
(i)
w ˜k
and complete the GMSREPF weight update. F.
Deduction and Refitting
The set of updated particles can be used to compute state mean and covariance estimates using ˆk = x
N X
(i)
(i)
wk xk
i=1
Pˆk =
N X
(i)
wk
�
(i)
ˆk xk − x
��
(i)
ˆk xk − x
�T
.
Downloaded by MISSOURI S & T on September 1, 2014 | http://arc.aiaa.org | DOI: 10.2514/6.2014-4308
i=1
Now that a set of updated particles describing an estimate of p(xk | Z k ) have been acquired, the cycle must return to the previously described predictor stage. This will require a new GMM to be fit to the set of updated particles. There are a number of ways in which this can be done, including an Expectation-Maximization (EM) algorithm that follows a resampling step or a Weighted Expectation-Maximization (WEM) step which eliminates the need for a resampling and instead makes use of the existing particle weights.5 Given the abundance of EM algorithms, such as EM, WEM, incremental EM,19 lazy EM,19 and sparse EM,19 the first approach is taken. This is done by first resampling a set of Nresample updated particles with equal weights from the a posteriori distribution and then by passing these particles to an EM algorithm seeded with the proposal distribution q(xk | Z k ). While it may be tempting to select a Nresample that is much larger than N to capture more features of a potentially complex posterior distribution, it has been observed that this can cause performance failings (and intense computational burden) during the EM computation of the GMM parameters and have found that seeding the EM process with the proposal distribution is sufficient in recovering a good GMM construction representative of the sample set. EM returns what are taken as + + α`,k−1 , m+ `,k−1 and S`,k−1 , and the GMM resulting from EM is taken to be p(xk−1 | Z k−1 ) =
L X
+ + α`,k−1 pg (xk−1 ; m+ `,k−1 , S`,k−1 )
`=1
to repeat the process for all subsequent measurements. A block diagram of the GMSREPF scheme can be seen in Figure 6.
IV.
Simulation and Results
A simulation was conducted to evaluate the performance of the described methods for IOD and followon tracking, and the GMSREPF outlined above will be compared to the performance of the GMSREKF described in previous work.8 For this discussion, consider the TLE set 1 04250U 69101A 13280.12704329 -.00000128 00000-0 10000-3 0 6498 2 04250 009.4765 318.6975 0027678 185.2325 174.6601 01.00272598 88037 for the satellite Skynet 1, in an inclined near-geosynchronous orbit, and 1 25740U 99027A 14003.15789442 -.00000206 00000-0 00000+0 0 4682 2 25740 000.0571 269.1843 0005521 034.0687 129.7857 01.00271241 53608 for the satellite Nimiq 1, in an equatorial near-geosynchronous orbit, retrieved from a public catalog at space-track.org. Synthetic optical measurement data for these objects are generated and assumed to be taken from a ground station in Albuquerque, NM. Both the GMSREPF and GMSREKF utilize the same data and are identically initialized with RoCAR. The generated data consist of three consecutive data arcs of six minutes each with measurements being made every 20 seconds. The constraints amax and emax were 15 of 20 American Institute of Aeronautics and Astronautics
{zp+1 , . . . , zk }
RoCAR Algorithm
Data
Zone Finding
Polynomial Construction
{z1 , . . . , zp }
GMM Approximation
RoCAR
Sturm’s Theorem
Region Intersection
p(x0 | z0 ) p(xk−1 | Z k−1 ) Predictor
EM (j)
Proposal Generation Downloaded by MISSOURI S & T on September 1, 2014 | http://arc.aiaa.org | DOI: 10.2514/6.2014-4308
(j)
xk ∼ p(xk | Z k ), wk = 1/Nresample j = 1, 2, . . . , Nresample
p(xk | Z k−1 )
Resample (i)
(i)
xk ∼ p(xk | Z k ), wk i = 1, 2, . . . , N
q(xk | Z k ) Weight Update p(xk | Z k )
Figure 6: Block diagram representation of RoCAR and the GMSREPF.
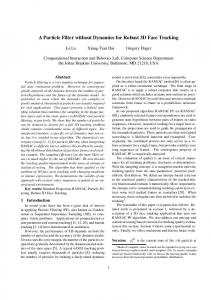
chosen to be 45, 000 km and 0.1 respectively and RoCAR is given the first p = 9 measurements to perform IOD. The standard deviation parameters for the GMM approximation of the constrained admissible region were selected to be σρ,max = 5.0 km and σρ,max = 0.1 km/s. For the GMSREPF, N = Nresample = 50, 000 ˙ was chosen, with the resampling amount selected based on the previously discussed observations of the effects of the Nresample value on EM performance. The data generated for the objects were used to run a Monte Carlo simulation of 100 trials where the measurement noise was resampled on each run. It was decided to perform a statistical analysis in Cartesian coordinates. Rather than simply mapping the state and covariance estimates offered by the GMSREPF, the posterior distribution at each measurement index was densely sampled and these samples were mapped to Cartesian coordinates to compute mean and covariance there. Since the distribution is sampled and those samples are mapped, the mean and covariance computed once mapped are representative of the distribution’s mean and covariance in that space. For each run, the Mahalanobis distance, given by q D = (x − µ)T P −1 (x − µ) , was chosen to be the performance metric for comparison and is computed with respect to the truth and averaged over the runs to develop an understanding of how statistically consistent each procedure is and how this consistency changes with additional measurements. Figure 7 shows the posterior Mahalanobis distance plotted against measurement index for Skynet 1 and Figure 8 represents the results for Nimiq 1. With the initializations being equal, that is, with both methods beginning with the exact same GMM approximation of the admissible region, the GMSREPF generates estimates with lower Mahalanobis distances over the tracking period than the GMSREKF. While both filters undergo the same initialization, the GMSREPF is able to capture the non-Gaussian characteristics of the proposal distribution with a vast sample set. It is able to better interpret the non-Gaussian nature of the proposal distribution. The GMSREKF, by contrast, has no sampling and relies solely on its component number L.
16 of 20 American Institute of Aeronautics and Astronautics
102
1
101
IOD 100
10−1
0
5
10
15
20
25
30
35
40
45
50
55
60
Measurement Index Figure 7: Mahalanobis distance history the GMSREPF and GMSREKF for the object Skynet 1. In both cases the Mahalanobis distances are computed in Cartesian coordinates. The first p = 9 measurements are utilized by the RoCAR IOD process.
102
1 GMSREKF GMSREPF
Mahalanobis Distance
Downloaded by MISSOURI S & T on September 1, 2014 | http://arc.aiaa.org | DOI: 10.2514/6.2014-4308
Mahalanobis Distance
GMSREKF GMSREPF
101
IOD 100
10−1
0
5
10
15
20
25
30
35
40
45
50
55
60
Measurement Index Figure 8: Mahalanobis distance history the GMSREPF and GMSREKF for the object Nimiq 1. In both cases the Mahalanobis distances are computed in Cartesian coordinates. The first p = 9 measurements are utilized by the RoCAR IOD process.
17 of 20 American Institute of Aeronautics and Astronautics
102
1 N = 10, 000 N = 20, 000 N = 50, 000
Mahalanobis Distance
Downloaded by MISSOURI S & T on September 1, 2014 | http://arc.aiaa.org | DOI: 10.2514/6.2014-4308
Previous work has shown that decreasing σρ,max and σρ,max , effectively adding components to the initial ˙ GMM, moves the GMSREKF closer to the performance of the GMSREPF, though it does add to the required computing time.20 As component number is increased, and accordingly the size of each component decreases, it is intuitive that the GMSREKF begins to behave more like the GMSREPF. This could prove to be an advantage over the GMSREPF, as the GMSREKF does not experience the shortfalls of repeatedly approximating a new GMM to fit a set of weighted particles. It has been observed that the selection of a robust and accurate EM algorithm is crucial to the success of the GMSREPF. This observation led to an analysis of how the number of particles N utilized by the particle filter affected its performance, so the GMSREPF was run at N = 10, 000, N = 20, 000, and N = 50, 000. The Mahalanobis distance of each of these cases (this time computed in equinoctial orbital elements) can be seen in Figures 9 and 10 for both objects. The Mahalanobis distance drops across the entire tracking period and is less affected by the gaps between the measurement arcs as samples are increased. This indicates that if the computing resources are available and the required time is affordable, increasing sample size would prove beneficial. It was also found that there are diminishing returns in increasing the number of samples. The filter performance is less influenced by sample size as N increases, and these diminishing returns are especially apparent in Figure 10.
101
100
IOD
0
5
10
15
20
25
30
35
40
45
50
55
60
Measurement Index Figure 9: Mahalanobis distance history for different values of N used by the GMSREPF for the object Skynet 1. In each case the Mahalanobis distances are computed in equinoctial orbital elements. The first p = 9 measurements are utilized by the RoCAR IOD process.
V.
Conclusions
An initial orbit determination and estimation framework using particle filters for space object tracking is described. The Robust Constrained Admissible Region approach is outlined and its individual facets and their value in the robust generation of a probabilistic initial orbit solution are detailed. The Gaussian mixture square-root extended particle filter algorithm is shown and a simulation is conducted to evaluate its performance compared to a Gaussian mixture square-root extended Kalman filter. The particle filter shown generates estimates with a lower Mahalanobis distance over the course of tracking than that of the Kalman filter; that is to say that its estimates are more statistically consistent. Further, it is found that increasing the number of samples to serve as particles in the particle filter improves its performance with respect to the metric chosen.
18 of 20 American Institute of Aeronautics and Astronautics
102
1
Downloaded by MISSOURI S & T on September 1, 2014 | http://arc.aiaa.org | DOI: 10.2514/6.2014-4308
Mahalanobis Distance
N = 10, 000 N = 20, 000 N = 50, 000
101
100
IOD
0
5
10
15
20
25
30
35
40
45
50
55
60
Measurement Index Figure 10: Mahalanobis distance history for different values of N used by the GMSREPF for the object Nimiq 1. In each case the Mahalanobis distances are computed in equinoctial orbital elements. The first p = 9 measurements are utilized by the RoCAR IOD process.
References 1 DeMars, K. J. and Jah, M. K., “Probabilistic Initial Orbit Determination via Gaussian Mixture Models,” Journal of Guidance, Control, and Dynamics, Vol. 36, No. 5, September-October 2013, pp. 1324–1335. 2 Escobal, P. R., Methods of Orbit Determination, Krieger Publishing Company, Malabar, FL, 1965. 3 Gooding, R., “A New Procedure for Orbit Determination Based on Three Lines of Sight (Angles Only),” No. 93004, Defense Research Agency, 1993. 4 Julier, S. J. and Uhlmann, J. K., “Unscented Filtering and Nonlinear Estimation,” Proceedings of the IEEE , Vol. 92, No. 3, March 2004, pp. 401–422. 5 van der Merwe, R., Sigma-Point Kalman Filters for Probabilistic Inference in Dynamic State-Space Models, Ph.D. thesis, Oregon Health and Science University, Portland, Oregon, 2004. 6 Milani, A., Gronchi, G., Vitturi, M. D. M., and Kneˇ zevi´ c, Z., “Orbit Determination with Very Short Arcs. I Admissible Regions,” Celestial Mechanics and Dynamical Astronomy, Vol. 90, No. 1–2, July 2004, pp. 59–87. 7 Tommei, G., Milani, A., and Rossi, A., “Orbit Determination of Space Debris: Admissible Regions,” Celestial Mechanics and Dynamical Astronomy, Vol. 97, No. 4, April 2007, pp. 289–304. 8 McCabe, J. S. and DeMars, K. J., “Coordinizatization Effects on Non-Gaussian Uncertainty for Track Initialization and Refinement,” Proceedings of the AAS/AIAA Space Flight Mechanics Meeting, Advances in the Astronautical Sciences, February 2014. 9 Ristic, B., Gordon, S., and Gordon, N., Beyond the Kalman filter : particle filters for tracking applications, Artech House, Boston, London, 2004. 10 Kaplan, M. H., Modern Spacecraft Dynamics & Control, John Wiley & Sons, New York, NY, 1976. 11 Jury, E. and Mansour, M., “Positivity and nonnegativity conditions of a quartic equation and related problems,” Automatic Control, IEEE Transactions on, Vol. 26, No. 2, 1981, pp. 444–451. 12 Sturm, C., M´ emoire sur la r´ esolution des ´ equations num´ eriques, .s.n., 1845. 13 Cayley, A., “A Second Memoir upon Quantics,” Philosophical Transactions of the Royal Society of London, Vol. 146, No. 1, January 1856, pp. 101–126. 14 Cayley, A., “A Discussion of the Sturmian Constants for Cubic and Quartic Equations,” The Collected Mathematical Papers, Vol. 4, No. 290, 1891, pp. 473–477. 15 J´ onsson, G. F. and Vavasis, S., “Solving Polynomials With Small Leading Coefficients,” SIAM J. Matrix Anal. Appl, 2004. 16 Montenbruck, O. and Gill, E., Satellite Orbits, Springer Berlin Heidelberg, 2000. 17 Brouke, R. and Cefola, P., “On the equinoctial orbital elements,” Celestial Mech., Vol. 5, September 1972, pp. 303–310. 18 Alspach, D. L. and Sorenson, H. W., “Nonlinear Bayesian Estimation using Gaussian Sum Approximations,” IEEE Transactions on Automatic Control, Vol. AC-17, No. 4, August 1972, pp. 439–448. 19 McLachlan, G. and Peel, D., Finite Mixture Models, Wiley series in probability and statistics: Applied probability and statistics, Wiley, 2004.
19 of 20 American Institute of Aeronautics and Astronautics
Downloaded by MISSOURI S & T on September 1, 2014 | http://arc.aiaa.org | DOI: 10.2514/6.2014-4308
20 DeMars, K. J. and McCabe, J. S., “Effects of Coordinate Systems on Non-Gaussian Uncertainty for Track Initialization and Refinement,” Uncertainty Quantification, Society for Industrial and Applied Mathematics.
20 of 20 American Institute of Aeronautics and Astronautics