Iran. J. Chem. Chem. Eng.
Vol. 34, No. 4, 2015
Prediction of the Liquid Vapor Pressure Using the Artificial Neural Network-Group Contribution Method Tarjomannejad, Ali*+ Department of Chemical Engineering, University of Tabriz, Tabriz, I.R. IRAN
ABSTRACT: In this paper, vapor pressure for pure compounds is estimated using the Artificial Neural Networks and a simple Group Contribution Method (ANN–GCM). For model comprehensiveness, materials were chosen from various families. Most of materials are from 12 families. Vapor pressure data of 100 compounds is used to train, validate and test the ANN-GCM model. Vapor pressure data were taken from literature for wide ranges of temperature (68.55-559.15 K). Based on results, the best structure for feed-forward back propagation neural network is Levenberg-Marquardt back propagation training algorithm, logsig transfer function for hidden layer and linear transfer function for output layer. The multiplayer network model consists of temperature, acentric factor, critical temperature, critical pressure and the structure of molecules as inputs, 10 neurons in the hidden layer and one neuron in the output layer corresponding to vapor pressure. The weights are optimized to minimize error between experimental and calculated data. Results show that optimum neural network architecture is able to predict vapor pressure data with an acceptable level. The trained network predicts the vapor pressure data with average relative deviation percent of 1.18%.
KEY WORDS: Artificial neural network, Group contribution method, Liquid vapor pressure, Equation of state.
INTRODUCTION Thermodynamic properties of pure fluids such as vapor pressure, density, heat capacity and thermal conductivity are very important in design of different chemical processes. Vapor pressure is one of the most important properties in chemical processes. The vapor pressure curve is unique for each substance, but the general shape of curve is similar for all of them [1]. For a limited number of substances vapor pressure has been reported in many points. The number of points is limited for most substances, so obtaining the equations for estimation and interpolation points is very important.
The vapor pressure can be obtained from equation of state. Two parameters equations of state such as PengRobinson [2], Soave-Redlich-Kwong [3] and Patel Teja [4] were widely used in predicting vapor pressure of compounds. For predicting thermodynamic properties including vapor pressure, it can be used of Group Contribution Method (GCM). Chein [5] predicted the vapor pressure using of GCM. He predicted the vapor pressure by average absolute percentage deviation of 5%. Avaullee et al. [6] presented a group contribution method
* To whom correspondence should be addressed. + E-mail:
[email protected]
1021-9986/15/4/97
15/$/3.50
97
Iran. J. Chem. Chem. Eng.
Tarjomannejad A.
for estimating the critical properties and acentric factors of paraffins, naphtenes and aromatics with emphasis on extrapolating to very heavy compounds. They predicted the properties with average deviation between 0.6 and 6.5%. Marrero et al. [7] predicted critical properties by using GCM. They showed the new method making significant improvements both in accuracy and applicability. Coutsikos et al. [8] presented a group-contribution model for the prediction of vapor pressures of organic solids. The obtained predictions by them are not very accurate. Moller et al. [9] presented a new group contribution method for the prediction of liquid vapor pressures for non-electrolyte organic compounds. They found the relative error of 5% in pressure. Nannoolal et al. [10] proposed a group contribution method for the estimation of the normal boiling point of nonelectrolyte organic compounds. Ceriani et al. [11] proposed a group contribution method for the estimation of vapor pressure and heat of vaporization of organic liquids. This method improved the prediction of normal boiling point. The artificial neural networks can be a suitable alternative to model the different thermodynamic properties. An Artificial Neural Network (ANN) is an information processing method inspired from the human brain functioning rules [12]. ANN models are composed of computational points called neurons which are able to store experimental knowledge. ANNs are an especially efficient algorithm to approximate any function with a finite number of discontinuities by learning the relationships between the input and output vectors [13]. Thus, ANNs are appropriate techniques to model the nonlinear behavior of chemical properties. Today, use of neural networks to predict thermodynamic properties such as vapor pressure is increasing. Potukuchi et al. [14] predicted vapor pressure of volatile inorganic compounds by using an artificial neural network. Kuhne et al. [15] investigated vapor pressure for hydrocarbons and halogenated hydrocarbons from chemical structure by using a Neural Network. Potukuchi et al. [14] predicted vapor pressure of volatile organic compounds including nitric acid, hydrochloric acid and ammonia. Gandhidasan et al. [16] predicted vapor pressures of
98
Vol. 34, No. 4, 2015
aqueous desiccants for cooling applications by using an artificial neural network. Aqueous desiccants investigated by them included calcium chloride, lithium chloride, and lithium bromide. Lazzus [17,18] estimated solid vapor pressure for inorganic and inorganic compounds by a neural network. He investigated solid vapor pressure for 250 compounds. He also predicted vapor pressure and density of ionic liquids by using a neural network [19]. Rohani et al. [20] compared artificial neural network systems and SAFT equation to obtain vapor pressure and liquid density of pure alcohols. In this paper, liquid vapor pressure is predicted by using a combined method that includes the Artificial Neural Networks and a simple Group Contribution Method (ANN–GCM). 100 substances have been investigated. To assess the accuracy of this model, calculated vapor pressure from ANN–GCM model and predicted by some EOSs, namely, Peng–Robinson, Soave–Redlich–Kwong and Patel Teja have been compared.
ARTIFICIAL NEURAL NETWORK Artificial neural networks are used in a wide range of applications such as prediction of thermodynamic properties. Neural networks generally consist of a number of interconnected neurons that are organized in one or more layers. Usually, artificial neural networks are comprised of one input layer, one hidden layer and an output layer [21]. Output of each neuron is calculated by using transfer function (Eq. (1)).
y j F Sj
(1)
Where Sj, yj and F are input of jth neuron before applying transfer function, output of jth neuron and transfer function. Input of each neuron is calculated from outputs of previous layers (Eq. (2)):
Sj
wij yi b j
(2)
i
Where wij and bj are weights connecting ith neuron (from previous layer) and bias of jth neuron. Common transfer functions are logarithmic function (logsig), hyperbolic tangent function (tansig) and linear
Iran. J. Chem. Chem. Eng.
Prediction of the Liquid Vapor Pressure ...
Vol. 34, No. 4, 2015
Table 1: Structural groups used in the proposed ANN+GCM method. No.
Group
No.
Group
1
>C
N
CH-
15
-F
3
-CH2-
16
-Cl
4
-CH3
17
-I
5
=CH2
18
-S-(Ring)
6
=CH-
19
–CH2–(Ring)
7
≡CH
20
>CH–(Ring)
8
-O-
21
=CH–(Ring)
9
-OH
22
>CC=O
23
–O–(Ring)
11
=O
24
-NO
12
–NH2
25
>NC
C=O
2
3
1
1
>C
C< (Ring)
8
2
C10H8
Table 3: The values of ARD% of different transfer functions with the optimal number of neurons in each case.
Logsig
No. of neuron Purelin
Tansig
12
Logsig
Logsig
13
Tansig
Tansig
Purelin
Tansig
Logsig
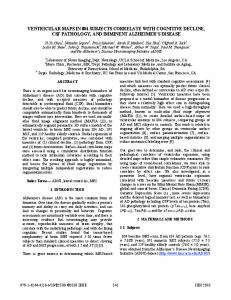
functions have been tested. Since no information about the optimal number of neurons has been reported for the calculation of liquid vapor pressure of substances, trial and error is the best way to determination the optimal number of neurons. The optimal number of neurons in the hidden layer was determined based on the minimum ARD%. RESULTS AND DISCUSSION Table 3 shows ARD% of different transfer functions with the optimal neurons number in each case. According to Table 3, neural network with tansig-purelin transfer functions with 10 neurons in hidden layer has the least ARD%. Fig. 1 shows the values of ARD% in contrast with different neurons number in hidden layer with tansig-purelin transfer function. Table 4 shows the ARD%, RDmax, Bias%, R2 and RMS for all data sets using the proposed neural network.
100
11
Logsig
Tansig
ARD% Train
1.4381
Test
1.5853
Train
1.7574
Test
1.9366
Train
3.0382
Test
4.3307
Train
1.1743
10 Test
1.2138
Train
1.6049
Test
1.8401
Train
2.6401
Test
3.1277
12
10
7 6 5
ARD%
Transfer function
4 3 2 1 0 0
2
4
6
8
10
12
14
16
18
20
Number of neuron
Fig. 1: Average absolute deviation (ARD%) as a function of the number of neurons in the hidden layer
Iran. J. Chem. Chem. Eng.
Prediction of the Liquid Vapor Pressure ...
Vol. 34, No. 4, 2015
Table 4: Statistical parameters for data sets. ARD%
RDmax
Bias%
RMS
R2
Training set
1.1743
14.0604
-0.0414
0.0210
0.999994
Validation set
1.1983
17.1748
-0.2848
0.0217
0.999997
Testing set
1.2138
10.5827
-0.0726
0.0214
0.999997
Total set
1.1830
17.1748
-0.0932
0.0212
0.999995
6000 6000 5000
Predicted
Predicted
5000 4000 3000 2000
3000 2000
1000
0
4000
1000
1000
2000
3000
4000
5000
6000
0
1000
2000
3000
4000
5000
6000
Experimental
Experimental
6000 6000 5000
Predicted
Predicted
5000 4000 3000 2000
3000 2000
1000
0
4000
1000 1000
2000
3000
4000
5000
6000
Experimental
0
1000
2000
3000
4000
5000
6000
Experimental
Fig. 2: Comparison between predicted and experimental data for training (a), validation (b), test (c) and total data (d) sets
The results show that the artificial neural network can be accurately trained and that can estimate the liquid vapor pressure with acceptable accuracy. In this estimating, the root mean square error is 0.021, 0.022 and 0.21 respectively for the training, validation and test data. Comparisons between experimental and calculated values for all data sets are shown in Fig. 2. The optimum weights and biases for the neural network are shown in Table 5. The weights and biases in Table 5 are able to recalculate the obtained results in this paper.
To assess the accuracy of the this model in prediction of liquid vapor pressure, the ARD% values between experimental and calculated vapor pressure from ANN–GCM model and predicted by some other methods, namely, Peng–Robinson, Soave–Redlich–Kwong and Patel Teja have been compared. The three equations of state were used for prediction of phase behavior of all substances. The results for each substance are illustrated in Table 6. Four last columns in the table show these average relative
101
Iran. J. Chem. Chem. Eng.
Tarjomannejad A.
Vol. 34, No. 4, 2015
Table 5: The weight and bias values of the optimal architecture. Neuron
1
2
3
4
5
6
7
8
9
10
T
3.1790
0.0389
0.0657
3.0672
2.5814
2.9727
0.0121
3.5517
-2.6035
-2.3839
Tc
-1.4526
-1.5128
1.8472
-0.9421
-3.0187
-4.4137
0.0023
1.2904
3.0202
3.0399
Pc
0.0873
0.7597
-1.1891
0.7637
1.1003
0.8235
-0.0218
-2.3599
-1.0282
-1.1226
ω
-1.5685
-0.3218
0.4540
-1.3973
-0.6499
-0.1957
-0.0094
3.1082
1.3910
0.5295
>C
CH-
-0.2717
0.3157
-0.3519
-0.3414
0.0418
-0.0058
-0.0121
-0.2721
-0.0772
-0.0636
-CH2-
-0.8591
0.2035
-0.1595
-0.6318
-0.5141
-0.3609
-0.0032
0.7454
1.9981
0.5384
-CH3
-0.0949
-1.0044
0.7774
-0.7547
-0.0578
0.4666
0.0451
1.3914
-1.4271
0.1194
=CH2
0.9999
0.1803
0.1364
0.3652
0.1123
-0.3379
-0.5894
-2.1147
0.8298
-0.1378
=CH-
-0.3575
-0.3952
0.0730
0.1725
-0.2121
-0.2495
0.0069
-0.6650
-0.2586
0.23066
≡CH
0.2799
0.0328
-0.4086
0.5553
-0.1781
-0.2455
0.5861
-0.4507
0.02183
0.1840
-O-
-0.8481
-0.6060
1.4125
-0.7676
-0.1553
-0.2706
-0.0029
2.1250
0.6684
0.1945
-OH
0.1854
-0.0402
-0.0862
-0.2753
0.0306
0.51007
0.0146
-0.3961
-1.5567
-0.0042
>C=O
0.1088
-0.1617
0.0668
-0.0200
-0.0187
0.1809
0.0098
0.5123
0.2643
0.0119
=O
-1.5366
-0.1316
-0.1018
-0.4519
0.0456
-0.0031
0.0331
-0.7124
1.1358
-0.0333
–NH2
0.4097
-0.5378
0.4475
-0.4758
-0.229
0.3351
0.0380
-0.7249
0.5088
0.2408
≡N
1.3794
-0.4204
-1.1464
1.4089
-0.2805
0.3370
0.7334
-0.6440
0.2434
0.0144
-F
1.0016
0.0841
-0.2830
0.8677
-0.1121
0.4453
0.0228
0.0033
-0.1356
0.2160
-Cl
0.6871
0.4427
-0.8256
0.6723
-0.2666
-0.0346
0.4349
-1.7958
-1.6765
0.3438
-I
0.6862
0.2578
-0.3742
0.7180
-0.0041
0.0302
0.0589
1.1860
-1.5286
-0.0889
-S-(ring)
1.5980
-0.0030
0.6069
0.2394
0.0392
0.5324
-0.0307
0.0256
-0.1789
-0.2143
–CH2–(ring)
0.1571
-0.1370
0.0527
-0.0681
-0.0284
-0.1840
0.0150
1.2048
-0.2807
0.0482
>CH–(ring)
-2.9784
-0.0606
0.2764
-3.2277
-0.1731
-0.6134
-0.0345
0.5368
0.5306
0.2110
=CH–(ring)
-0.0121
-0.5558
0.3832
-0.2617
-0.0222
0.0910
0.0229
0.8595
-0.5632
0.0335
>CNN
C
N
CH-
0
15
-F
0
3
-CH2-
2
16
-Cl
0
4
-CH3
3
17
-I
0
5
=CH2
0
18
-S-(Ring)
0
6
=CH-
0
19
–CH2–(Ring)
0
7
≡CH
0
20
>CH–(Ring)
0
8
-O-
1
21
=CH–(Ring)
0
9
-OH
0
22
>CC=O
1
23
–O–(Ring)
0
11
=O
0
24
-NO
0
12
–NH2
0
25
>N> input = [360.7778;567;3060;0.460990012;0;0;2; 1;0;0;0;;1;0;1;0;0;0;0;0;0;0;0;0;0;0;0;0;0;0;0]; >> Preesure = sim(net,input) Result is 39.4907, where its experimental value is equal to 33.4658 (ARD % is 0.0743).
Received : May 25, 2014 ; Accepted : Aug. 3, 2015
REFERENCES [1] Gandhidasan P., Mohandes M.A., Predictions of Vapor Pressures of Aqueous Desiccants for Cooling Applications by Using Artificial Neural Networks, Appl. Therm. Eng., 28: 126-135 (2008).
107
Iran. J. Chem. Chem. Eng.
Tarjomannejad A.
[2] Peng D.Y., Robinson D.B., A New Two-Constant Equation of State, Ind. Eng. Chem. Fundamen., 15: 59-64 (1976). [3] Soave G., Equilibrium Constants from a Modified Redlich–Kwong Equation of State, Chem. Eng. Sci., 27: 1197-1203 (1972). [4] Patel N.C., Teja A.S., A New Cubic Equation of State for Fluids and Fluid Mixtures, Chem. Eng. Sci., 37: 463-473 (1982). [5] Tu C.H., Group-contribution Method for the Estimation of Vapor Pressures, Fluid Phase Equilib., 99: 105-120 (1994). [6] Avaullee L., Trassy L., Neau E., Jaubert J.N., Thermodynamic Modeling for Petroleum Fluids I. Equation of State and Group Contribution for the Estimation of Thermodynamic Parameters of Heavy Hydrocarbons, Fluid Phase Equilib., 139: 155-170 (1997). [7] Marrero J., Gani R., Group-Contribution Based Estimation of Pure Component Properties, Fluid Phase Equilib., 183: 183-208 (2001). [8] Coutsikos P., Voutsas E., Magoulas K., Tassios D.P., Prediction of Vapor Pressures of Solid Organic Compounds with a Group-Contribution Method, Fluid Phase Equilib., 207: 263-281 (2003). [9] Moller B., Rarey J., Ramjugernath D., Estimation of the Vapour Pressure of Non-electrolyte Organic Compounds via Group Contributions and Group Interactions, J. Mol. Liq., 143: 52-63 (2008). [10] Nannoolal Y., Rarey J., Ramjugernath D., Estimation of Pure Component Properties, Part 3. Estimation of the Vapor Pressure of Non-Electrolyte Organic Compounds via Group Contributions and Group Interactions, Fluid Phase Equilib., 269: 117-133 (2008). [11] Ceriani R., Gani R., Liu Y.A., Prediction of Vapor Pressure and Heats of Vaporization of Edible Oil/Fat Compounds by Group Contribution, Fluid Phase Equilib., 337: 53-59 (2013). [12] Ehsani M., Bateni H., Razi Parchikolaei G., Modeling of Oxidative Coupling of Methane over Mn/Na2WO4/ SiO2 Catalyst Using Artificial Neural Network, Iran. J. Chem. Chem. Eng. (IJCCE), 32(3): 107-114 (2013). [13] Ahadian S., Moradian S., Mohseni, M. Determination of Surface Tension and Viscosity of Liquids by the Aid of the Capillary Rise Procedure Using Artificial Neural Network (ANN), Iran. J. Chem. Chem. Eng. (IJCCE), 27(1): 7-15 (2008).
108
Vol. 34, No. 4, 2015
[14] Potukuchi S., Wexler A.S., Predicting Vapor Pressures of Volatile Inorganic Components using Neural Networks, "14th Nucleation and Atmospheric Aerosols", p. 651 (1996). [15] Kuhne R., Ebert R.U., Schtrmann G., Estimation of Vapour Pressures for Hydrocarbons and Halogenated Hydrocarbons from Chemical Structure by a Neural Network, Chemosphere, 34: 671-686 (1997). [16] Potukuchi W., Wexler A.S., Predicting Vapor Pressure using Neural Networks, Atmos. Environ., 31: 741-753 (1997). [17] Lazzus J.A., Prediction of Solid Vapor Pressures for Organic and Inorganic Compounds Using a Neural Network, Thermochim. Acta., 489: 53-62 (2009). [18] Lazzus J.A., Estimation of Solid Vapor Pressures of Pure Compounds at Different Temperatures using a Multilayer Network with Particle Swarm Algorithm, Fluid Phase Equilib., 289: 176-184 (2010). [19] Lazzus J.A., ρ–T–P Prediction for Ionic Liquids Using Neural Networks, J. Taiwan Inst. Chem. E., 40: 213-232 (2009). [20] Rohani A.A., Pazuki G., Najafabadi H.A., Seyfi S., Vossoughi M., Comparison between the Artificial Neural Network System and SAFT Equation in Obtaining Vapor Pressure and Liquid Density of Pure Alcohols, Expert Syst. Appl., 38: 1738-1747 (2011). [21] Moosavi M., Soltani N., Prediction of Hydrocarbon Densities Using an Artificial Neural Network-Group Contribution Method up to High Temperatures and Pressures, Thermochim. Acta, 556: 89-96 (2013). [22] Laugier S., Richon D., Use of Artificial Neural Networks for Calculating Derived Thermodynamic Quantities from Volumetric Property Data, Fluid Phase Equilib., 210: 247-255 (2003). [23] Iliuta M.C., Iliuta I., Larachi F., Vapour-Liquid Equilibrium Data Analysis for Mixed SolventElectrolyte Systems Using Neural Network Models, Chem. Eng. Sci., 55: 2813-2825 (2000). [24] Miyamoto H., Takemura J., Uematsu M., Vapour Pressures of Isobutane at T=(310 to 407) K, J. Chem. Thermodyn., 36: 919-923 (2004). [25] Miyamoto H., Uematsu M., Measurements of Vapour Pressures and Saturated-Liquid Densities for n-Butane at T = (280 to 424) K, J. Chem. Thermodyn., 39: 827-832 (2007).
Iran. J. Chem. Chem. Eng.
Prediction of the Liquid Vapor Pressure ...
[26] Ewing M.B., Sanchez Ochoa J.C., The Vapour Pressures of n-Octane Determined Using Comparative Ebulliometry, Fluid Phase Equilib., 210: 277-285 (2003). [27] N’Guimbi J., Berro C., Mokbel I., Rauzy E., Jose J., Experimental Vapour Pressures of 13 Secondary and Tertiary Alcohols-Correlation and Prediction by a Group Contribution Method, Fluid Phase Equilib., 162: 143-158 (1999). [28] Censky M., Rohac V., Ruzicka K., Fulem M., Aim K., Vapor Pressure of Selected Aliphatic Alcohols by Ebulliometry. Part 1, Fluid Phase Equilib., 298: 192-198 (2010). [29] Vecchio S., Brunetti B., Vapor Pressures and Standard Molar Enthalpies, Entropies, and Gibbs Free Energies of Sublimation of 2,4- and 3,4Dinitrobenzoic Acids, J. Chem. Thermodyn., 41: 880-887 (2009). [30] Falleiro R.M.M., Silva L.Y.A., Meirelles A.J.A., Krähenbühl M.A., Vapor Pressure Data for Fatty Acids Obtained using an Adaptation of the DSC Technique, Thermochim. Acta, 547: 6-12 (2012). [31] Cervantes M.C., Mokbel I., Champion D., Jose J., Voilley, A. Saturated Vapour Pressure of Aaroma Compounds at Various Temperatures, Food Chem., 85: 221-229 (2004). [32] Shi L., Duan Y.Y., Zhu M.S., Han L.Z., Lei X., Vapor Pressure of 1,1,1,2,3,3,3-Heptafluoropropane, Fluid Phase Equilib., 163: 109-117 (1999). [33] Stull D.R., Vapor Pressure of Pure Substances Organic and Inorganic Compounds, Ind. Eng. Chem., 39: 517-540 (1947). [34] A.H.N. Mousa, Vapour Pressure and SaturatedVapour Volume of Acetonitrile, J. Chem. Thermodyn., 13: 201-202 (1981). [35] Felsing W.A., Durban S.A., The Vapor Pressure, Densities, and Some Derived Quantities for Acetone, J. Am. Chem. Soc., 48: 2885-2893 (1926). [36] Ambrose D., Hall D.J., Thermodynamic Properties of Organic Oxygen Compounds L. The Vapour Pressures of 1,2-ethanediol (Ethylene Glycol) and bis(2-hydroxyethyl) ether (diethylene glycol), J. Chem. Thermodyn., 13: 61-66 (1981). [37] Taylor R.S., Smith L.B., The Vapor Pressures, Densities and some Derived Quantities for Ether at Low Temperatures, J. Am. Chem. Soc., 44: 2450-2463 (1922).
Vol. 34, No. 4, 2015
[38] . Eon C, Pommier C., Guiochon G., Vapor Pressures and Second Virial Coefficients of Some FiveMembered Heterocyclic Derivatives, J. Chem. Eng. Data, 16: 408-410 (1971). [39] Ambrose D., Townsend R., Thermodynamic Properties of Organic Oxygen Compounds. Part IX. The Critical Properties and Vapour Pressures, above Five Atmospheres, of Six Aliphatic Alcohols, J. Chem. Soc. 54: 3614-3625 (1963). [40] Philippe R., Jambon C., Cléchet P., Thermodynamic Properties of Dimethylsulfoxide + Halomethane Mixtures II. Vapour Pressures and Excess Thermodynamic Functions, J. Chem. Thermodyn., 5: 431-444 (1973). [41] Li I.P.C., Lu B.C.Y., Chen E.C., Vapor-Liquid Equilibriums of Binary Systems Containing n-hexane, Cyclohexane, and Benzene at Low Temperatures, J. Chem. Eng. Data, 18: 305-309 (1973). [42] Plesnar Z., Fu Y.H., Sandler S.I., Orbey H., Vapor-Liquid Equilibrium of the Acetic Acid + Octane Binary System at 323.15 K and 343.15 K, J. Chem. Eng. Data, 41: 799-801 (1996). [43] Carruth G.F., Kobayashi R., Vapor Pressure of Normal Paraffins Ethane Through n-decane from Their Triple Points to About 10 mm Hg, J. Chem. Eng. Data, 18: 115-126 (1973). [44] Daubert T.E., Jalowka J.W., Goren V., Vapor Pressure of 22 Pure Industrial Chemicals, AIChE Symp. Ser., 83: 128-156 (1987). [45] Dejoz A., Alfaro V.G., Miguel P.J., Vázquez M.I., Isobaric Vapor-Liquid Equilibria of Tetrachloroethylene + 1-propanol and + 2-propanol at 20 and 100 kPa, J. Chem. Eng. Data, 41: 1361-1365 (1996). [46] Dever D.F., Finch A., Grunwald E., The Vapor Pressure of Methanol, J. Phys. Chem., 59: 668-669 (1955). [47] Gibbard H.F., Creek J.L., Vapor Pressure of Methanol from 288.15 to 337.65 K, J. Chem. Eng. Data, 19: 308-310 (1974). [48] Fowler L., Trump W.N., Vogler C.E., Vapor Pressure of Naphthalene. Measurements between 40 deg and 180 deg, J. Chem. Eng. Data, 13: 209-210 (1968). [49] Pividal K.A., Sterner C., Sandler S.I., Orbey H., Vapor-Liquid Equilibrium from Infinite Dilution Activity Coefficients: Measurement and Prediction of Oxygenated Fuel Additives with Alkanes, Fluid Phase Equilib., 72: 227-249 (1992).
109
Iran. J. Chem. Chem. Eng.
Tarjomannejad A.
[50] Rintelen J.C., Saylor J.H., Gross P.M., The Densities and Vapor Pressures of some Alkylbenzenes, Aliphatic Ketones and n-Amyl Chloride, J. Am. Chem. Soc., 59: 1129-1130 (1937). [51] Kassel L.S., Vapor Pressures of the Xylenes and Mesitylene, J. Am. Chem. Soc., 58: 670-671 (1936). [52] Camin D.L., Forziati A.F., Rossini F.D., Physical Properties of n-Hexadecane, n-Decylcyclopentane, n-Decylcyclohexane, 1-Hexadecene and n-Decylbenzene, J. Phys. Chem., 58: 440-442 (1954). [53] Lee F.M., Coombs D.M., Two-Liquid-Phase Extractive Distillation for Aromatics Recovery, Ind. Eng. Chem. Res., 26: 564-573 (1987). [54] Bryson C.E., Cazcarra V., Levenson L.L., Sublimation Rates and Vapor Pressures of H2O, CO2, N2O, and Xe, J. Chem. Eng. Data, 19: 107-110 (1974). [55] Kleinrahm R., Duschek W., Wagner W., (Pressure, Density, Temperature) Measurements in the Critical Region of Methane, J. Chem. Thermodyn., 18: 11031114 (1986). [56] Wagner W., New Vapour Pressure Measurements for Argon and Nitrogen and a New Method for Establishing Rational Vapour Pressure Equations, Cryogenics, 13: 470-482 (1973). [57] Barnett F.D., Harvey N.D., Vapor Pressure of Liquid Oxygen and Nitrogen, J. Am. Chem. Soc., 49: 610620 (1927). [58] Razzouk A., Hajjaji A., Mokbel I., Mougin P., Jose J., Experimental Vapor Pressures of 1,2bis(dimethylamino)ethane, 1-methylmorpholine, 1,2-bis(2-aminoethoxy)ethane and Nbenzylethanolamine between 273.18 and 364.97K, Fluid Phase Equilib., 282: 11-13 (2009). [59] Bejarano A., Poveda L.J., de la Fuente J.C., Supplementary Vapor Pressure Data of the Glycol Ethers, 1-methoxy-2-propanol, and 2-methoxyethanol at a Pressure Range of (15 to 177) kPa, J. Chem. Thermodyn., 53: 114-118 (2012). [60] Bejarano A., Quezada N., de la Fuente J.C., Complementary Vapor Pressure Data for 2-methyl1-propanol and 3-methyl-1-butanol at a Pressure Range of (15 to 177) kPa, J. Chem. Thermodyn., 41: 1020-1024 (2009).
110
Vol. 34, No. 4, 2015
[61] Mokbel I., Rauzy E., Loiseleur H., Berro C., Jose j., Vapor Pressures of 12 Alkylcyclohexanes, Cyclopentane, Butylcyclopentane and TransDecahydronaphthalene Down to 0.5 Pa. Experimental Results, Correlation and Prediction by an Equation of State, Fluid Phase Equilib., 108: 103-120 (1995). [62] Gregorowicz J., Kiciak K., Malanowski S., Vapour Pressure Data for 1-butanol, Cumene, n-octane and n-decane and Their Statistically Consistent Reduction with the Antoine Equation, Fluid Phase Equilib., 38: 97-107 (1987). [63] Rohac V., Ruzicka K., Ruzicka V., Zaitsau D.H., Kabo G.J., Diky V., Aim K., Vapour Pressure of Diethyl Phthalate, J. Chem. Thermodyn., 36: 929937 (2004). [64] Sawaya T., Mokbel I., Rauzy E., Saab J., Berro C., Jose J., Experimental Vapor Pressures of Alkyl and Aryl Sulfides Prediction by a Group Contribution Method, Fluid Phase Equilib., 226: 283-288 (2004). [65] Fu Y., Han L., Zhu M.S., PVT Properties, PVT Properties, Vapor Pressures and Critical Parameters of HFC-32, Fluid Phase Equilib., 111: 273-286 (1995). [66] Cui X., Chen G., Han X., Wang Q., Experimental Vapor Pressure Data and a Vapor Pressure Equation for Fuoroethane (HFC-161), Fluid Phase Equilib., 245: 155-157 (2006). [67] Feng X., Xu X., Lin H., Duan Y., Vapor Pressures of 1,1,1,2,3,3,3-heptafluoropropane, 1,1,1,3,3,3hexafluoropropane and 1,1,1,3,3pentafluoropropane, Fluid Phase Equilib., 290: 127136 (2010). [68] Ambrose, D. Ellender J.H., Lees E.B., Sprake C.H.S., Townsend R., Thermodynamic Properties of Organic Oxygen Compounds XXXVIII. Vapour Pressures of Some Aliphatic Ketones, J. Chem. Thermodyn., 7: 453-472 (1975). [69] Weber L.A., Ebulliometric Measurement of the Vapor Pressures of R123 and R141b, Fluid Phase Equilib., 80: 141-143 (1992). [70] Farkova J., Wichterle I., Vapour Pressures of Some Ethyl and Propyl Esters of Fatty Acids, Fluid Phase Equilib., 90: 143-148 (1993). [71] Straty G.C., Tsumura R., PVT and Vapor Pressure Measurements on Ethane, J. Res. Nbs. A Phys. Ch., 80: 35-39 (1976).
Iran. J. Chem. Chem. Eng.
Prediction of the Liquid Vapor Pressure ...
Vol. 34, No. 4, 2015
[72] Duan Y.Y., Zhu M.S., Han L.Z., Experimental Vapor Pressure Data and a Vapor Pressure Equation for Trifluoroiodomethane (CF3I), Fluid Phase Equilib., 121: 227-234 (1996). [73] Reid R.C., Prausnitz J.M., Poling B.E., "The Properties of Gases and Liquids", 4th ed., McGrawHill Book Company, New York (1987). [74] Perry, D. Green (Eds.), "Perry's Chemical Engineers Handbook", 7th Edition, McGraw-Hill, New York (1997). [75] The Dortmund Data Bank, http://www.ddbst.com/.
111