BMC Developmental Biology
BioMed Central
Open Access
Research article
Peanut gene expression profiling in developing seeds at different reproduction stages during Aspergillus parasiticus infection Baozhu Guo*1, Xiaoping Chen2, Phat Dang3, Brian T Scully1,4, Xuanqiang Liang5, C Corley Holbrook6, Jiujiang Yu7 and Albert K Culbreath2 Address: 1USDA-ARS, Crop Protection and Management Research Unit, Tifton, Georgia 31793, USA, 2University of Georgia, Department of Plant Pathology Tifton, Georgia 31793, USA, 3USDA-ARS, National Peanut Research Laboratory, Dawson, Georgia 39842, USA, 4University of Florida, Indian River Research and Education Center, Ft. Pierce, Florida 34945, USA, 5Guangdong Academy of Agricultural Sciences, Institute of Crop Sciences, Guangzhou, China, 6USDA-ARS, Crop Genetics and Breeding Research Unit, Tifton, Georgia 31793, USA and 7USDA-ARS, Southern Regional Research Center, New Orleans, Louisiana 70124, USA Email: Baozhu Guo* -
[email protected]; Xiaoping Chen -
[email protected]; Phat Dang -
[email protected]; Brian T Scully -
[email protected]; Xuanqiang Liang -
[email protected]; C Corley Holbrook -
[email protected]; Jiujiang Yu -
[email protected]; Albert K Culbreath -
[email protected] * Corresponding author
Published: 4 February 2008 BMC Developmental Biology 2008, 8:12
doi:10.1186/1471-213X-8-12
Received: 19 July 2007 Accepted: 4 February 2008
This article is available from: http://www.biomedcentral.com/1471-213X/8/12 © 2008 Guo et al; licensee BioMed Central Ltd. This is an Open Access article distributed under the terms of the Creative Commons Attribution License (http://creativecommons.org/licenses/by/2.0), which permits unrestricted use, distribution, and reproduction in any medium, provided the original work is properly cited.
Abstract Background: Peanut (Arachis hypogaea L.) is an important crop economically and nutritionally, and is one of the most susceptible host crops to colonization of Aspergillus parasiticus and subsequent aflatoxin contamination. Knowledge from molecular genetic studies could help to devise strategies in alleviating this problem; however, few peanut DNA sequences are available in the public database. In order to understand the molecular basis of host resistance to aflatoxin contamination, a large-scale project was conducted to generate expressed sequence tags (ESTs) from developing seeds to identify resistance-related genes involved in defense response against Aspergillus infection and subsequent aflatoxin contamination. Results: We constructed six different cDNA libraries derived from developing peanut seeds at three reproduction stages (R5, R6 and R7) from a resistant and a susceptible cultivated peanut genotypes, 'Tifrunner' (susceptible to Aspergillus infection with higher aflatoxin contamination and resistant to TSWV) and 'GT-C20' (resistant to Aspergillus with reduced aflatoxin contamination and susceptible to TSWV). The developing peanut seed tissues were challenged by A. parasiticus and drought stress in the field. A total of 24,192 randomly selected cDNA clones from six libraries were sequenced. After removing vector sequences and quality trimming, 21,777 high-quality EST sequences were generated. Sequence clustering and assembling resulted in 8,689 unique EST sequences with 1,741 tentative consensus EST sequences (TCs) and 6,948 singleton ESTs. Functional classification was performed according to MIPS functional catalogue criteria. The unique EST sequences were divided into twenty-two categories. A similarity search against the nonredundant protein database available from NCBI indicated that 84.78% of total ESTs showed significant similarity to known proteins, of which 165 genes had been previously reported in peanuts. There were differences in overall expression patterns in different libraries and genotypes. A number of sequences were expressed throughout all of the libraries, representing constitutive expressed sequences. In order to identify resistance-related genes with significantly differential expression, a statistical analysis to estimate the relative abundance (R) was used to compare the Page 1 of 16 (page number not for citation purposes)
BMC Developmental Biology 2008, 8:12
http://www.biomedcentral.com/1471-213X/8/12
relative abundance of each gene transcripts in each cDNA library. Thirty six and forty seven unique EST sequences with threshold of R > 4 from libraries of 'GT-C20' and 'Tifrunner', respectively, were selected for examination of temporal gene expression patterns according to EST frequencies. Nine and eight resistance-related genes with significant up-regulation were obtained in 'GT-C20' and 'Tifrunner' libraries, respectively. Among them, three genes were common in both genotypes. Furthermore, a comparison of our EST sequences with other plant sequences in the TIGR Gene Indices libraries showed that the percentage of peanut EST matched to Arabidopsis thaliana, maize (Zea mays), Medicago truncatula, rapeseed (Brassica napus), rice (Oryza sativa), soybean (Glycine max) and wheat (Triticum aestivum) ESTs ranged from 33.84% to 79.46% with the sequence identity ≥ 80%. These results revealed that peanut ESTs are more closely related to legume species than to cereal crops, and more homologous to dicot than to monocot plant species. Conclusion: The developed ESTs can be used to discover novel sequences or genes, to identify resistance-related genes and to detect the differences among alleles or markers between these resistant and susceptible peanut genotypes. Additionally, this large collection of cultivated peanut EST sequences will make it possible to construct microarrays for gene expression studies and for further characterization of host resistance mechanisms. It will be a valuable genomic resource for the peanut community. The 21,777 ESTs have been deposited to the NCBI GenBank database with accession numbers ES702769 to ES724546.
Background Peanut (Arachis hypogaea L.) is an important economical crop for oil production and nutritious food for human consumption. However, aflatoxin contamination caused by Aspergillus fungi is a great concern in peanut production worldwide. Aflatoxins are the most toxic and carcinogenic compounds associated with both acute and chronic toxicity in animals and humans [1,2]. Both drought stress and high geocarposphere temperature during the latter part of the growing season compromise peanut defense to fungal invasion and exacerbate aflatoxin formation in the seeds [3-6]. Drought stress, extreme temperature or fungal infection can also impair plant growth and yield performance. The development of adapted peanut germplasm and cultivars with improved host-plant resistance is one of our main research objectives. Resistance to several pathogens is known in peanut [7] indicating that peanuts have evolved a series of defense mechanisms against invasion by plant pathogens. A better understanding of the molecular mechanism for resistance to Aspergillus collonization will aid in designing strategies to develop new resistant peanut cultivars. The availability of genomic tools and bio-informatics softwares will significantly improve our ability to a better understanding of the genetic mechanisms of host-plant resistance and to facilitate the genetic improvement of cultivated peanut. Genomic research can also be used to discover novel genes with potential resistance and to develop molecular markers for use in marker-assisted selection. Recently, some genes and proteins associated with A. parasiticus or/ and drought stress were identified and studied utilizing genomic and proteomic tools [8-12]. With the completion of the rice and Arabidopsis whole genome sequencing
projects, a vast amount of valuable data has been generated to facilitate cross-species genome comparison in the plant Kingdom. The peanut genome size is significantly larger (2,800 Mb/1C) than the currently sequenced plants [13], such as Arabidopsis (128 Mb), rice (420 Mb), and Medicago (500 Mb) [14,15]. Financial requirement makes it unrealistic to completely sequence the whole peanut genome in the near future. Therefore, peanut Expressed Sequenced Tags (EST) would be the cost-effective strategy to identify important peanut genes involved in defense to fungal invasion and to study gene expression pattern as well as genetic regulation [16,17]. Expressed Sequence Tags (EST) is an effective genomic approach for rapid identification of expressed genes, and has been widely used in genome-wide gene expression studies in various tissues, developmental stages or under different environmental conditions [18-21]. In addition, the availability of cDNA sequences has accelerated further molecular characterization of genes of interest and provided sequence information for microarray construction and genome annotation [11,22-25]. As of March 23, 2007, large number of ESTs of the top five plant species including Arapidopsis (1,276,131), rice (1,211,154), maize (1,161,193), wheat (855,272) and barley (437,728) have been deposited to the GenBank database (dbEST release 032307) [26]. These sequences provide opportunities to accelerate the understanding of the genetic mechanisms that control plant growth and responses to the environment. In contrast, there were only 19,790 Arachis ESTs deposited in GenBank, among which 13,226 were derived from cultivated peanut A. hypogaea and the remaining 6,264 from the wild species of A. stenosperma. These ESTs submitted by different peanut Page 2 of 16 (page number not for citation purposes)
BMC Developmental Biology 2008, 8:12
http://www.biomedcentral.com/1471-213X/8/12
researchers were from different tissues and subjected to different abiotic and biotic stresses [11,27,28]. In this report, an effort for large-scale sequencing of cDNA was carried out with two goals: gene expression comparison between these two genotypes, 'Tifrunner' and 'GTC20', and providing genomic resource for discovery and understanding of novel defense-related genes involved in resistance to Aspergillus colonization and drought stress. To increase gene diversity in the EST population and the probability of identifying genes associated with drought tolerance and disease resistance, different cDNA libraries were prepared from developing seeds at late reproductive stages of a resistant and a susceptible peanut genotypes challenged by A. parasiticus and drought stress. Six libraries were constructed that resulted in a total of 21,777 high-quality EST sequences, from which 8,689 unique sequences were identified. To provide useful information on the expression profiling of resistant genes at various seed developmental stages and to offer valuable genomic resource for peanut functional genomics, an extensive analysis of these ESTs was performed using a variety of computational approaches. A functional catalog of expressed genes is reported here as well as a preliminary view of their expression profiles in developing seeds at different developmental stages. This functional catalog seeks to link genes and pathways, and to provide a list of features that could aid in the understanding of how resistance genes are involved in response to biotic and abiotic challenges and how their expression is regulated.
Results Generation of ESTs from developing seeds challenged by A. parasiticus and drought stress Six cDNA libraries were constructed from developing seeds of two varieties ('GT-C20' and 'Tifrunner') collected at three reproductive stages (R5, R6 and R7) after challenging by A. parasiticus and drought stress. From the six cDNA libraries, a total of 24,290 clones were randomly selected, sequenced and analyzed using Sequencher software. The vector sequences of the raw sequence reads were trimmed off and low-quality sequences (shorter than 100 bp in length) were removed. A total of 21,777 high-qual-
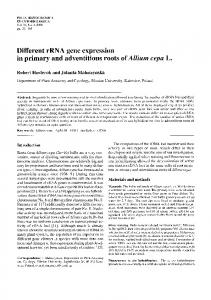
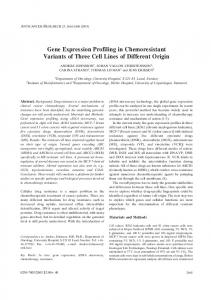
ity EST sequences (about 86%) were generated from the 24,290 clones. Total 8,672 ESTs were generated from 'GTC20' and 12,426 ESTs were generated from 'Tifrunner' (Table 1). The percentage of acceptable quality EST sequences from individual libraries varied from 81% to 88%. The average length of the ESTs is 411 bp ranging from 114 to 933 bp (Fig. 1). The sum of the total ESTs equal to 8.7 Mb of peanut genome. These quality ESTs combined from both genotypes at three stages were further assembled into 8,689 unique ESTs. Among them, 6,948 were singletons and 1,741 were TCs. The 21,777 ESTs have been deposited to the NCBI GenBank database with accession numbers ES702769 to ES724546. Overlapping of unique EST sequences and high redundancy of genes A comparison of unique EST sequences from the two genotypes and different stages of developing seeds allows the identification of common and unique sets of expressed genes among the six libraries. The unique ESTs from the six libraries were summarized in Table 1. A total of 1,825, 681, 685, 3,107, 1,768 and 622 unique sequences were present in the C20R5, C20R6, C20R7, TFR5, TFR6 and TFR7, respectively. The distribution and overlapping of these unique EST sequences is shown in Figure 3.
Among the unique ESTs from the C20R5, C20R6 and C20R7 libraries, only 96 ESTs (3%) were shown common to all three libraries (Fig. 2A). The number of ESTs that were common between any two libraries varied from 10.9% to 34.3%. When the same analysis was applied to the ESTs from the TFR5, TFR6 and TFR7, similar results were obtained (Fig. 2B). The ESTs that were common to all three 'Tifrunner' libraries were about 3.4%, similar to that of 'GT-C20'. There were 364 (8%) ESTs that were common to TFR5 and TFR6 libraries, 120 (2.6%) ESTs were found common to both TFR5 and TFR7 libraries, 37 (0.7%) ESTs were found common to both TFR6 and TFR7 libraries. In order to investigate differential gene expression between the resistant and susceptible genotypes, we also performed a comparative analysis between 'GT-C20' and 'Tifrunner' libraries at each seed developmental stage. There were 591 (11.74%), 197 (8.04%) and 152
Table 1: Summary of EST sequences, contigs, and singletons in six libraries from 'GT-C20' and 'Tifrunner' Library ID C20R5 C20R6 C20R7 TFR5 TFR6 TFR7 Total
Total No. of clones sequenced
Accepted sequences (%)
No. of TCs (%)
No. of Singletons (%)
Unique Sequence
5, 184 2, 304 2, 496 7, 104 4, 800 2, 304
4, 678 (88) 1, 977 (86) 2, 017 (81) 6, 132 (86) 4, 230 (88) 2, 046 (88)
390 (21) 101 (15) 138 (20) 669 (22) 302 (17) 141 (23)
1, 435 (79) 580 (85) 547 (80) 2, 438 (78) 1, 467 (83) 481 (77)
1, 825 681 685 3, 107 1, 768 622
24, 192
21, 098 (86)
1, 741 (20)
6, 948 (80)
8, 688
Page 3 of 16 (page number not for citation purposes)
BMC Developmental Biology 2008, 8:12
http://www.biomedcentral.com/1471-213X/8/12
8000
Number of EST
7000 6000 (375)
5000 4000
(1261)
(475)
(1710)
(2864)
(1230)
(375) (5077)
3000
(104)
(375)
(58)
(519)
2000
(6297)
1000 0
(295)
100
200
300
400
500
600
700
800
900
(458)
Length of trimmed sequence
B
A
removal The mitted Figure length to 1ofclustering of vector trimmed sequence EST sequence and low quality (cDNAsequences) length aftersubThe length of trimmed EST sequence (cDNA length after removal of vector sequence and low quality sequences) submitted to clustering. The number of EST within different categories of trimmed sequence length is presented on the Yaxis. The number on the X-axis represent ranges of trimmed sequence lengths (101–200, 201–300, 301–400 bp, etc, respectively).
(11.65%) genes were found common to 'GT-C20' and 'Tifrunner' at R5, R6 and R7, respectively (Fig. 2C, D, and 2E). These results indicated that the differences in transcript abundance might reflect genuine differences in the gene expression in the different libraries. These variations may be due to the differences in disease resistance, tolerance to abiotic stress or other genetic factors at the different developmental stages. Genes that are shared between or among the libraries included highly expressed transcripts. To further investigate the high frequency of transcripts, all six libraries were analyzed, clustered and assembled individually by genotype. Those highly expressed genes (TCs) assembled from more than 20 individual ESTs were listed in Table 2 for the 'GT-C20' libraries (C20R5, C20R6 and C20R7), and Table 3 for the 'Tifrunner' libraries (TFR5, TFR6 and TFR7). A total of 8,672 ESTs from 'GT-C20' and 12,426 ESTs from 'Tifrunner' non-normalized libraries were assembled into 599 and 1,119 TCs, respectively. There were 27 GT-C20' and 36 'Tifrunner' highly expressed transcripts assembled from more than 20 individual consensus ESTs were selected for distribution analysis (Table 2 and 3). These TCs were concurrently queried against GenBank nonredundant protein database (nr) in searching their putative functions. The BLAST results showed that all the highly expressed genes (TCs) were homologous to known fragments in the GenBank database (Table 2 and 3). There were 31 highly expressed genes, identified by BLAST search, to have the same putative function in both 'GTC20' and 'Tifrunner' libraries. These highly expressed genes encode constitutive proteins such as allergen protein (C20Contig14 and TFContig8 for iso-Arah3) (Guo et al., unpublished data), storage proteins (C20Contig51 and TFContig31 for 2S protein 1), structural protein
D
C
E
Figure 2 of unique peanut EST sequences Overlapping Overlapping of unique peanut EST sequences. A: Common and unique sets of expressed genes among the 'GT-C20' three libraries; B: Common and unique sets of expressed genes among the 'Tifrunner'; C: Common and unique sets of expressed genes between 'GT-C20' and 'Tifrunner' libraries at developmental R5 stage; D: Common and unique sets of expressed genes between 'GT-C20' and 'Tifrunner' libraries at developmental R6 stage; E: Common and unique sets of expressed genes between 'GT-C20' and 'Tifrunner' libraries at developmental R7 stage. The number in the parenthesis presents the number of clones assembled into unique ESTs.
(C20Congtig75 and TFContig44 for glycine-rich cell wall structural protein precursor), and stress-resistance associated proteins (C20Contig33 and TFContig29 for desiccation-related protein PCC13-62 precursor). Functional classification of unique EST sequences In order to further characterize the putative functions of unique ESTs and involvement in different biological processes, a similarity search against the MIPS Arabidopsis thaliana Database was performed. According to the MIPS Functional Catalogue criteria, 'GT-C20' unique sequences whose functions could be predicted from the similarity to Arabidopsis proteins with an E value of ≤ 1e-5 were classified into twenty-two categories (Fig. 4A) [29,30]. The same analytic procedure was applied to 'Tifrunner' unique ESTs (Fig. 4B). The 'Tifrunner' ESTs with significant protein homology were also sorted into 22 groups. These results suggested that the genes represented by these
Page 4 of 16 (page number not for citation purposes)
BMC Developmental Biology 2008, 8:12
http://www.biomedcentral.com/1471-213X/8/12
A B
C D E
F
G
H
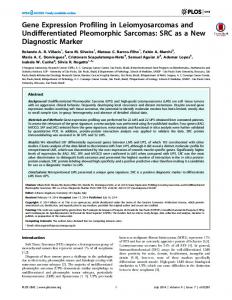
Hierarchical Figure 3 clustering analysis of differentially expressed transcripts for 'GT-C20' and 'Tifrunner' Hierarchical clustering analysis of differentially expressed transcripts for 'GT-C20' and 'Tifrunner'. TCs with R > 4 (84 in total) were used for hierarchical clustering analysis.
Page 5 of 16 (page number not for citation purposes)
BMC Developmental Biology 2008, 8:12
http://www.biomedcentral.com/1471-213X/8/12
Table 2: Gene expression frequency and BLAST results of the unique ESTs assembled from more than 20 consensus ESTs in the C20R5, C20R6 and C20R7 libraries NCBI BLAST Contig
C20R5
C20R6
C20R7
Accession no.
Species
Gene description
E Value
C20Contig14 C20Contig37 C20Contig52 C20Contig47 C20Contig35 C20Contig48 C20Contig51 C20Contig40 C20Contig19 C20Contig9 C20Contig34 C20Contig57 C20Contig33 C20Contig65 C20Contig50 C20Contig66 C20Contig28 C20Contig74 C20Contig24 C20Contig71 C20Contig58 C20Contig73 C20Contig68 C20Contig77 C20Contig31 C20Contig4 C20Contig75
369 283 205 245 173 192 145 103 86 79 59 36 21 20 15 29 24 21 16 24 13 6 18 12 13 9 18
231 123 94 116 73 117 74 97 60 41 17 25 14 15 32 6 8 5 3 3 9 14 4 6 6 5 0
183 67 170 95 165 46 96 44 70 47 25 26 34 23 8 7 4 3 9 0 4 6 2 6 2 6 3
gb|ABI17154.1| gb|AAU21490.1| gb|AAW56068.1| gb|AAG01363.1| sp|Q647G9| gb|ABL14270.1| gb|AAU21494.1| sp|P43238| gb|AAT00598.1| gb|AAU21499.2| gb|AAT00596.1| gb|AAU21501.1| gb|ABN09090.1| gb|AAU21496.1| gb|AAT00597.1| gb|AAZ20291.1| gb|AAW56067.1| gb|AAC15413.1| gb|AAT00599.1| gb|AAM48133.1| ref|XP_001377994.1| sp|P02872| gb|AAZ20276.1| gb|AAU21493.1| sp|P29828| gb|ABE81150.1| sp|P27483|
A. hypogaea A. hypogaea A. hypogaea A. hypogaea A. hypogaea A. hypogaea A. hypogaea A. hypogaea A. hypogaea A. hypogaea A. hypogaea A. hypogaea M. truncatula A. hypogaea A. hypogaea A. hypogaea A. hypogaea O. sativa A. hypogaea S. medusa M. domestica A. hypogaea A. hypogaea A. hypogaea M. sativa M. truncatula A. thaliana
iso-Ara h3 arachin Ahy-1 conglutin Gly1 Conglutin precursor (Allergen Ara h 6) arachin 6 2S protein 1 Allergen Ara h 1, clone P41B precursor (Ara h I) seed storage protein SSP1 oleosin 1 conarachin oleosin 3 Desiccation-related protein PCC13-62 precursor 2S protein 2 conarachin metallothionein-like protein arachin Ahy-4 translation elongation factor-1 alpha; EF-1 alpha seed storage protein SSP2 putative flavanone 3-hydroxylase PREDICTED: similar to formin 2 Galactose-binding lectin precursor (Agglutinin) (PNA) oleosin 1 conarachin Protein disulfide-isomerase precursor (PDI) Major intrinsic protein Glycine-rich cell wall structural protein precursor
0 0 6e-79 0 3e-79 0 9e-94 0 1e-104 1e-88 0 8e-88 1e-106 5e-80 1e-169 3e-46 0 0 3e-66 3e-65 4e-23 1e-152 5e-70 0 0 1e-131 5e-06
unique EST sequences may play roles in different biological process. The results of functional classification showed that the unknown genes, including those which had no hits or low identity (less than 95%) with the Arabidopsis protein database and those which matched the unclassified and unknown proteins, represented the largest set of genes (33.33% and 34.42% for 'GT-C20' and 'Tifrunner', respectively). The second largest proportion of genes was found to participate in the biological process of metabolism. The resistance-related and environment-interacted genes were 2.6% and 2.46% in 'GT-C20' and 'Tifrunner', respectively (Fig 4A and 4B). These results indicated that it may be possible to discover novel genes involved in biotic and abiotic responses using the EST profiling startegy. Expression profiles of cDNA from different genotypes at different developmental stages Without normalization or subtraction in library construction, the number of the cDNA clones (or sequenced ESTs) for a given gene reflected the abundance of the gene expression at the corresponding developmental stage. The number of the consensus ESTs that assembled into a
unique gene at the three developmental stages may represent the temporal expression pattern of this gene. Therefore, the temporal expression profile of a gene can be deduced by the comparison of the EST frequency at different developmental stage, while the temporal expression profile of a gene of different genotypes may be measured by comparison of the EST frequency of the different genotypes. Given the fact that the absolute EST counts varies in different libraries (Table 1), a meaningful measure of expression profile similarity is independent of these absolute numbers. To test the independence of EST distribution within the libraries, an estimation of the relative abundance defined as R (Stekel et al. 2000) was employed to identify the most highly significant differences in EST abundance for each TC among the libraries. The unequal distribution of specific ESTs with statistically significance within each library implied that these ESTs expressed at a higher level in some libraries than others. In order to limit the analysis to those genes which differentially expressed at different developmental stages, only TCs with R value larger than 4 were used for hierarchical clustering analysis. This R value provided an 82.2% true positive rate [31]. According to the cutoff threshold of R > 4, 37 TCs from 'GT-C20' libraries and 47 from 'Tifrunner' libraries were
Page 6 of 16 (page number not for citation purposes)
BMC Developmental Biology 2008, 8:12
http://www.biomedcentral.com/1471-213X/8/12
Table 3: Gene expression frequency and BLAST results of the unique ESTs assembled from more than 20 consensus ESTs in the TFR5, TFR6 and TFR7 libraries NCBI BLAST Contig
R5
R6
R7
Accession no.
Species
Gene description
E Value
TFContig7 TFContig8 TFContig25 TFContig13 TFContig31 TFContig16 TFContig30 TFContig20 TFContig27 TFContig35 TFContig5 TFContig28 TFContig1 TFContig29 TFContig39 TFContig33 TFContig41 TFContig42 TFContig36 TFContig46 TFContig51 TFContig4 TFContig50 TFContig60 TFContig63 TFContig48 TFContig64 TFContig65 TFContig66 TFContig67 TFContig44
250 104 130 112 95 124 138 89 88 87 54 34 56 10 32 41 35 27 26 20 8 15 15 15 22 14 14 10 7 14 20
360 257 119 90 137 230 135 118 126 79 56 35 14 28 13 13 10 18 18 16 9 14 12 13 6 13 7 9 14 7 2
158 190 104 150 119 78 65 114 57 34 23 27 14 40 33 3 5 5 1 3 16 1 3 2 2 1 6 8 6 3 1
gb|AAG01363.1| gb|ABI17154.1| sp|P43237| gb|AAU21494.1| gb|AAW56068.1| sp|P43238| gb|AAU21490.1| sp|Q647G9| gb|ABL14270.1| gb|AAU21499.2| gb|AAW56067.1| gb|AAU21501.1| gb|AAZ20291.1| gb|ABN09090.1| gb|AAU21496.1| gb|AAT40509.2| gb|AAZ20290.1| gb|ABC75834.1| gb|AAC15413.1| gb|AAA99868.1| sp|P02872| gb|AAZ20276.1| gb|AAC17529.1| gb|ABE80997.1| gb|ABM45856.1| sp|P29828| gb|AAB84262.1| gb|ABE81150.1| gb|AAL73404.1| gb|ABF51006.1| sp|P27483|
A. hypogaea A. hypogaea A. hypogaea A. hypogaea A. hypogaea A. hypogaea A. hypogaea A. hypogaea A. hypogaea A. hypogaea A. hypogaea A. hypogaea A. hypogaea M. truncatula A. hypogaea S. demissum A. hypogaea G. max O. sativa G. hirsutum A. hypogaea A. hypogaea S. saman M. truncatula A. hypogaea M. sativa A. hypogaea M. truncatula C. avellana A. hypogaea A. thaliana
0 0 0 7e-98 3e-79 0 0 6e-79 0 4e-90 0 7e-88 3e-46 1e-106 3e-81 2e-07 3e-45 0 0 1e-170 1e-152 7e-70 1e-154 0 1e-142 0 0 1e-131 1e-118 3e-83 5e-06
TFContig61 TFContig70 TFContig38 TFContig71 TFContig72
10 13 8 19 13
8 8 8 1 7
5 1 5 1 1
dbj|BAD99508.1| gb|ABE82912.1| gb|AAM48133.1| gb|ABE83728.1| gb|AAS18240.1|
V. angularis M. truncatula S. medusa M. truncatula G. max
Gly1 iso-Ara h3 Allergen Ara h 1, clone P17 precursor (Ara h I) 2S protein 1 conglutin Allergen Ara h 1, clone P41B precursor (Ara h I) arachin Ahy-1 Conglutin precursor (Allergen Ara h 6) arachin 6 oleosin 1 arachin Ahy-4 oleosin 3 metallothionein-like protein Desiccation-related protein PCC13-62 precursor 2S protein 2 Hyoscyamine 6-dioxygenase, putative type 2 metallothionein [Arachis hypogaea] glyceraldehyde-3-phosphate dehydrogenase translation elongation factor-1 alpha; EF-1 alpha peroxidase Galactose-binding lectin precursor (Agglutinin) (PNA) oleosin 1 aquaporin 2 Phosphoglycerate kinase cytosolic ascorbate peroxidase Protein disulfide-isomerase precursor (PDI) omega-6 desaturase Major intrinsic protein 11S globulin-like protein Cu-Zn superoxide dismutase Glycine-rich cell wall structural protein precursor dbj|BAA94983.1| unnamed protein product gibberellin 2-oxidase Ribosomal protein S4, bacterial and organelle form putative flavanone 3-hydroxylase Histidine triad (HIT) protein enolase
selected to search against GenBank non-redundant protein database (nr) (Table 4 and 5). Based on the abundance and the R statistic, a clustering analysis was performed to assess the relatedness of each library in terms of gene expression profiles. As Ewing et al. (1999) described [32], we compiled the 84 TCs into a matrix file comprised of the frequency of ESTs corresponding to each contig in the library that represented different seed developmental stages and performed hierarchical clustering analysis. From hierarchical clustering analysis, the 84 TCs with different redundant and similar expression patterns could be grouped into eight major clusters from A to H as shown in Figure 4. Each cluster represents a different expression profile. Hierarchical cluster-
1e-127 1e-104 3e-64 3e-28 0
ing analysis showed that most of high abundant genes with same putative functions from 'GT-C20' libraries and 'Tifrunner' libraries could be grouped into the same cluster. These genes usually encode constitutive proteins (such as arachin, conglutin and oleosin) and their expression patterns are not genotype dependent. Some putative genes related to resistance such as PR10 protein and defensin 2.1 precursors were found only in 'GT-C20' and the expression pattern was up-regulated (Fig. 3). The results of hierarchical clustering and similarity search indicated that the 84 unique ESTs (R > 4) with similar DNA sequence were not equally distributed between the 'GT-C20' and 'Tifrunner' libraries. In comparison, only 32 unique ESTs (R > 4) were not equally distributed within
Page 7 of 16 (page number not for citation purposes)
BMC Developmental Biology 2008, 8:12
http://www.biomedcentral.com/1471-213X/8/12
Figure Functional 4 classification of peanut unique ESTs by comparison to Arabidopsis Sequencing Project functional categories Functional classification of peanut unique ESTs by comparison to Arabidopsis Sequencing Project functional categories. A: functional categories of 'GT-C20' unique EST sequences; B: functional categories of 'Tifrunner' unique ESTs.
different 'GT-C20' libraries (Table 4 and Fig. 3). There were seven, ten and eight unique TCs were observed in the C20R5, C20R6 and C20R7 libraries, respectively. Three unique TCs (C20Contig40 for allergen Ara1, C20Contig48 for arachin 6 and C20Contig37 for arachin Ahy-1) were observed between C20R5 and C20R6 librar-
ies. These three unique EST contigs (C20Contig35 for conglutin precursor, C20Contig52 for conglutin and C20Congtig86 for gibberellin 2-oxidase) were primarily found in the C20R5 and C20R7 libraries. Only one unique EST (C20Contig62 for Ca+2-binding EF hand protein) had cDNA clones represented only in C20R6 and
Page 8 of 16 (page number not for citation purposes)
BMC Developmental Biology 2008, 8:12
http://www.biomedcentral.com/1471-213X/8/12
Table 4: Top hits of C20 unique EST sequences with R > 4 NCBI BLAST Contig
R5
R6
R7
R
Accession no.
Species
Gene description
E Value
C20Contig35 C20Contig52 C20Contig40 C20Contig48 C20Contig50 C20Contig63 C20Contig37 C20Contig33 C20Contig14 C20Contig80 C20Contig71 C20Contig19 C20Contig14 8 C20Contig95 C20Contig75 C20Contig73 C20Contig30 C20Contig11 0 C20Contig87 C20Contig62 C20Contig15 2 C20Contig65 C20Contig51 C20Contig84
156 205 103 192 15 0 283 21 369 1 24 86 0
69 94 97 117 32 0 123 14 231 0 3 60 0
150 170 44 46 8 9 67 34 183 9 0 70 6
26.01 20.2 17.48 16.71 16 13.13 12.27 11.87 10.58 10.49 9.83 8.96 8.75
sp|Q647G9| gb|AAW56068.1| sp|P43238| gb|ABL14270.1| gb|AAT00597.1| gb|AAU21491.1| gb|AAU21490.1| gb|ABN09090.1| gb|ABI17154.1| gb|AAY54009.1| gb|AAM48133.1| gb|AAT00598.1| gb|AAU81922.1|
A. hypogaea A. hypogaea A. hypogaea A. hypogaea A. hypogaea A. hypogaea A. hypogaea M. truncatula A. hypogaea A. hypogaea S. medusa A. hypogaea A. hypogaea
Conglutin precursor (Allergen Ara h 6) conglutin Allergen Ara h 1, clone P41B precursor (Ara h I) arachin 6 conarachin arachin Ahy-2 arachin Ahy-1 Desiccation-related protein PCC13-62 precursor, putative iso-Ara h3 LEA protein putative flavanone 3-hydroxylase seed storage protein SSP1 PR10 protein
3e-79 6e-79 0 0 1e-169 1e-23 0 1e-106 0 2e-44 3e-65 1e-104 8e-67
4 16 6 3 10
0 0 14 10 0
10 1 6 4 0
8.68 7.53 6.89 6.17 6.17
gb|AAY59891.1| sp|P27483| sp|P02872| gb|AAL73404.1| gb|ABE83769.1|
A. hypogaea A. thaliana A. hypogaea C. avellana M. truncatula
serine protease inhibitor Glycine-rich cell wall structural protein precursor Galactose-binding lectin precursor (Agglutinin) (PNA) 11S globulin-like protein Actin/actin-like
4e-59 5e-06 1e-152 1e-117 0
14 0 1
2 4 5
0 3 0
5.57 5.51 5.31
gb|ABC75834.1| gb|AAB71227.1| gb|AAF73006.1
G. max G. max R. communis
glyceraldehyde-3-phosphate dehydrogenase Ca+2-binding EF hand protein NADP-dependent malic protein
0 1e-113 0
20 145 13
15 74 0
23 96 6
5.21 5.17 4.93
A. hypogaea A. hypogaea M. sativa
2S protein 2 2S protein 1 putative wound-induced protein
1e-79 9e-94 4e-12
C20Contig99 C20Contig86
11 11
0 0
1 6
4.81 4.5
gb|AAU21496.1| gb|AAU21494.1| emb|CAB65284.1 | gb|AAS18240.1| dbj|BAD99508.1|
enolase gibberellin 2-oxidase
0 1e-127
C20Contig22 9 C20Contig27 6 C20Contig28 1 C20Contig29 2 C20Contig60 C20Contig64 C20Contig94 C20Contig12 9 C20Contig89 C20Contig16 2
0
3
0
4.44
ref|NP_851111.1|
G. max Vigna angularis A. thaliana
putative N-hydroxycinnamoyl/benzoyltransferase
2e-76
0
3
0
4.44
gb|ABE82094.1|
M. truncatula
RNA-binding region RNP-1 (RNA recognition motif)
2e-17
0
3
0
4.44
gb|ABE81198.1|
M. truncatula
conserved hypothetical protein
3e-58
0
3
0
4.44
ref|NP_567466.1|
A. thaliana
unknown protein
1e-86
0 0 3 7
0 0 8 0
3 3 3 0
4.38 4.38 4.34 4.32
gb|AAR02860.1| gb|AAV85438.1| gb|AAT67997.1| No hits found
A. hypogaea M. sativa M. truncatula
storage protein putative defensin 2.1 precursor 1-cys peroxiredoxin
5e-31 2e-26 1e-105
3 1
1 4
7 0
4.08 4.03
gb|AAG37451.1| sp|P17928|
G. tomentella M. sativa
seed maturation protein LEA 4 Calmodulin (CaM)
3e-59 4e-79
C20R7 libraries. Four unique ESTs (C20Contig14 for isoAra h3, C20Contig19 for seed storage protein SSP1, C20Contig65 for 2S protein 2 and C20Contig51 for 2S protein 1) had cDNA clones equally distributed across the three libraries of 'GT-C20'. In the three 'Tifrunner' libraries, there were 38 unique ESTs (R > 4) whose cDNA clones were not equally distributed (Table 5 and Fig. 3). Comparison within all 'Tifrun-
ner' libraries, fourteen, five and seven unique EST sequences were observed in TFR5, TFR6 and TFR7 libraries, respectively. Six unique ESTs were observed only in TFR5 and TFR6 but absent in TFR7 libraries. Two unique ESTs were predominately present in the TFR6 and TFR7. The remaining unique ESTs with R > 4 had cDNA clones equally distributed across the three 'Tifrunner' libraries. Defense-related genes identified by database search
Page 9 of 16 (page number not for citation purposes)
BMC Developmental Biology 2008, 8:12
http://www.biomedcentral.com/1471-213X/8/12
Table 5: Top hits of TF unique EST sequence with R > 4 NCBI BLAST Contig
R5
R6
R7
R
Accession no.
Species
Genes description
E Value
TFContig8 TFContig13 TFContig31 TFContig7 TFContig20 TFContig29 TFContig16 TFContig25 TFContig27 TFContig39 TFContig22 TFContig105 TFContig91 TFContig51 TFContig120 TFContig71 TFContig82
104 112 95 250 89 10 104 130 88 32 20 2 16 8 13 19 13
257 90 137 360 118 28 182 119 126 13 48 1 0 9 0 1 0
190 150 119 158 114 40 58 104 57 33 20 11 0 16 0 1 1
124.92 69.23 49.24 48.2 46.85 34.14 31.57 22.09 17.08 16.13 13.98 13.30 11.09 9.81 9.01 8.08 7.23
A. hypogaea A. hypogaea A. hypogaea A. hypogaea A. hypogaea M. truncatula A. hypogaea A. hypogaea A. hypogaea A. hypogaea A. hypogaea G. tomentella G. max A. hypogaea A. thaliana M. truncatula O. sativa
iso-Ara h3 2S protein 1 conglutin Gly1 Conglutin precursor (Allergen Ara h 6) Desiccation-related protein PCC13-62 precursor, putative Allergen Ara h 1, clone P41B precursor (Ara h I) Allergen Ara h 1, clone P17 precursor (Ara h I) arachin 6 2S protein 2 major allergen Arah1 seed maturation protein LEA 4 subtilisin-like protease Galactose-binding lectin precursor (Agglutinin) (PNA) structural constituent of ribosome Histidine triad (HIT) protein 60S ribosomal protein L7A
0 7e-98 3e-79 0 6e-79 1e-106 0 0 0 1e-80 1e-172 2e-56 1e-168 1e-152 2e-63 3e -28 1e-132
TFContig250 TFContig44 TFContig1 TFContig33 TFContig88 TFContig159 TFContig304 TFContig43 TFContig28 TFContig30 TFContig527
1 20 56 41 9 9 0 14 34 138 0
0 2 14 13 0 0 1 2 35 135 0
5 1 14 3 0 0 4 0 27 65 3
7.09 7.04 6.6 6.43 6.24 6.24 5.86 5.85 5.81 5.72 5.46
M. truncatula A. thaliana A. hypogaea S.demissum N. tabacum
Peptidase A1, pepsin Glycine-rich cell wall structural protein precursor metallothionein-like protein Hyoscyamine 6-dioxygenase, putative ribosomal protein L3A
1e-131 5e-06 3e-46 2e-07 1e-125
M. truncatula M. truncatula A. hypogaea A. hypogaea O. sativa
Heat shock protein Hsp20 Probable histone H2B.1 oleosin 3 arachin Ahy-1 putative protein phosphatase
4e-63 2e-71 7e-88 0 1e-105
TFContig541 TFContig103
0 0
0 5
3 0
5.46 5.43
A. thaliana C. arietinum
unknown protein putative imbibition protein
4e-15 1e-125
TFContig26 TFContig243 TFContig36 TFContig97 TFContig74 TFContig403
6 2 26 2 0 0
11 0 18 8 4 4
0 4 1 5 0 0
5.06 4.84 4.81 4.61 4.34 4.34
A. hypogaea H. vulgare O. sativa A. hypogaea A. hypogaea N. tabacum
arachin Ahy-3 HvCBF7 translation elongation factor-1 alpha; EF-1 alpha serine protease inhibitor ubiquitin fusion protein photosystem II 23 kDa polypeptide
0 3e-44 0 4e-59 1e-67 1e-72
TFContig411
0
1
3
4.29
A. thaliana
pectinesterase-like protein
5e-47
TFContig81 TFContig235 TFContig237 TFContig251
8 6 6 6
0 0 0 0
1 0 0 0
4.22 4.16 4.16 4.16
C. glauca M. truncatula O. sativa P. sativum
Acyl carrier protein 1, chloroplast precursor (ACP 1) Cyclin-like F-box; F-box protein interaction domain hypothetical protein OsJ_018007 Cu/Zn superoxide dismutase II
4e-40 1e-47 2e-23 7e-89
TFContig260 TFContig262 TFContig263 TFContig41 TFContig101
6 6 0 35 12
0 0 4 10 3
0 0 2 5 0
4.16 4.16 4.16 4.12 4.07
gb|ABI17154.1| gb|AAU21494.1| gb|AAW56068.1| gb|AAG01363.1| sp|Q647G9| gb|ABN09090.1| sp|P43238| sp|P43237| gb|ABL14270.1| gb|AAU21496.1| gb|AAL27476.1| gb|AAG37451.1| gb|AAQ23176.1| sp|P02872| ref|NP_187143.1| gb|ABE83728.1| ref|NP_00106155 0.1| gb|ABD32384.1| sp|P27483| gb|AAZ20291.1| gb|AAT40509.2| gb|AAQ96335.1| No hits found gb|ABD32352.1| sp|Q1S9I9| gb|AAU21501.1| gb|AAU21490.1| ref|NP_00106277 4.1| gb|AAL87284.1| emb|CAB71135.1 | gb|AAU21492.1| gb|AAX23704.1| gb|AAC15413.1| gb|AAY59891.1| gb|AAZ20285.1| emb|CAA41713.1 | emb|CAB82677.1 | sp|P93092| gb|ABE77917.1| gb|EAZ34524.1| emb|CAA39819.1 | gb|ABF93903.1| emb|CAI51313.1| gb|AAD49719.1| gb|AAZ20290.1| gb|AAS57913.1|
O. sativa C. chinense G. max A. hypogaea V. radiata
60S ribosomal protein L21, putative, expressed arachidonic acid-induced DEA1 maturation protein pPM32 type 2 metallothionein 70 kDa heat shock cognate protein 2
3e-83 3e-25 2e-32 3e-45 0
The information provided by ESTs from plant tissues challenged by specific biotic and abiotic stress conditions offered an opportunity for gene discovery. The unique EST sequences from 'GT-C20' and 'Tifrunner' were compared
individually to the non-redundant protein sequence database available from NCBI by BLASTx program with a minimum E cutoff value < 1e-5. In reference to the results of differential expression and hierarchical clustering analysis
Page 10 of 16 (page number not for citation purposes)
BMC Developmental Biology 2008, 8:12
http://www.biomedcentral.com/1471-213X/8/12
Table 6: Putative resistance-related genes with significantly differential expression (R > 4) in 'GT-C20' and 'Tifrunner' libraries
Putative Gene function
Organism
'GT-C20'
'Tifrunner'
Desiccation-related protein PCC13-62 precursor, putative seed maturation protein LEA 4 metallothionein-like protein Heat shock protein Hsp20 serine protease inhibitor Cu/Zn superoxide dismutase II type 2 metallothionein 70 kDa heat shock cognate protein 2 LEA protein PR10 protein Ca+2-binding EF hand protein putative wound-induced protein putative defensin 2.1 precursor Calmodulin (CaM)
M. truncatula G. tomentella A. hypogaea M. truncatula A. hypogaea P. sativum A. hypogaea V. radiata A. hypogaea A. hypogaea G. max M. sativa M. sativa M. truncatula
+ + + + + + + + +
+ + + + + + + + -
+: the putative resistance-related gene was identified in the libraries. -: no putative resistance-related gene was identified in the libraries.
(Table 4 and 5), only those genes whose expression were significant up or down regulated at different stages were selected. The other defense-related genes whose E value > 1e-5 treated as false positive and were excluded from the analysis. Among the unique EST sequences with R > 4, only three up-regulated putative defense-related genes (putative desiccation-related protein PCC13-62 precursor, serine protease inhibitor and seed maturation protein LEA 4) were identified in both 'GT-C20' and 'Tifrunner' libraries (Table 6 and Fig. 3). Six up-regulated unique EST sequences were observed only in 'GT-C20' libraries, and matched previous reported known protein including PR10 protein, defensin protein and calmodulin (Table 6). In the 'Tifrunner' libraries, five defense-related genes such as metallothionein-like protein, heat shock protein and Cu/Zn superoxide dismutase II were detected with significant upregulation.
Comparison of these EST data to other plant EST sequences In order to compare these peanut ESTs to other publicly available plant ESTs, a similarity search against several plant EST databases in TIGR Gene Indices was performed (Table 7). When DNA sequence identity was at ≥ 90%, the percentages of peanut ESTs matching soybean and Medicago truncatula were 16.45% and 9.82%, respectively. When DNA sequence identity was decreased to ≥ 80%, the percentages of peanut ESTs matched to soybean and M. truncatula greatly increased to 79.46% and 72.53%, respectively. In contrast, the percentages of peanut ESTs that matched to Arabidopsis, rape seed, rice, maize and wheat ESTs were less than 50%, ranging from 33.84% to 45.69%, when DNA sequence identity was set at ≥ 80%. Although peanut and rape seed are both oilseed crops, when the DNA sequence identity was set at ≥ 80%, the similarity of peanut ESTs matching rape seed ESTs was only 38.5%, far less than that of the legume crops soybean and M. truncatula. As expected, peanut ESTs showed a
Table 7: Peanut unique EST homologs identified in soybean, Medicago truncatula, Arabidopsis, rapeseed, rice, maize and wheat in TIGR gene indices TIGR Gene Indices
Soybean (Glycine max) Medicago truncatula Arabidopsis thaliana Rapeseed (Brassica napus) Rice (Oryza sativa) Maize (Zea mays) Wheat (Triticum aestivum) aThe
Number of ESTs matched to TIGR Gene Indices (Percent in Parentheses)a Identity ≥ 80%
Identity ≥ 90%
6904 (79.46) 6302 (72.53) 3970 (45.69) 3345 (38.50) 3128 (36.00) 2716 (31.26) 2940 (33.84)
1429 (16.45) 853 (9.82) 470 (5.41) 465 (5.35) 484 (5.57) 402 (4.63) 469 (5.40)
criteria for stand-alone BLASTn were: (1) extract-match bp ≥ 11; (2) E value ≤ 1e-5; and (3) identity ≥ 80% and 90% at DNA sequence level.
Page 11 of 16 (page number not for citation purposes)
BMC Developmental Biology 2008, 8:12
higher similarity to ESTs of the legume species than to those of cereal crops, and also present a higher homology to ESTs of the dicot plants than to those of the monocots.
Discussion Larger-scale sequencing of Expressed Sequence Tags (EST) is an effective method for gene discovery. The available peanut EST database in GenBank is 19,790 entries as of March 23, 2007, which were derived from leaf, root, pod, cotyledon and other tissues of cultivated peanut (13,526) and wild species (6,264), respectively. Compared to maize, wheat, rice and soybean, the number and scale of peanut ESTs deposited in GenBank are far behind those major crops and it is inadequate to meet the need of peanut genetic and genomic research. Many successful EST projects have been reported for a number of species and from a variety of tissues under various conditions [6,11,17,27,33,34]. However, most of these EST projects were restricted to different tissues from one genotype or different tissues from different genotypes. The EST project reported in this study is uniquely and systematically designed using the same tissues (developing seeds) from two genotypes, 'GT-C20' and 'Tifrunner' with different characters in terms of resistance and susceptibility to diseases, under the same environmental conditions (challenged by A. parasiticus and drought stress) at specific seed developmental stages (R5, R6 and R7). The completion of this peanut EST project makes the available peanut ESTs in the GenBank database doubled for the research community to share. In addition, the six libraries were neither normalized nor subtracted so that the frequency of a unique EST (gene) within each stage could be determined and could provide a hint for the expression level of that specific gene. To understand the molecular basis of host resistance to A. flavus/parasiticus and consequent aflatoxin contamination, we monitored the transcript changes at these three developmental stages in developing seeds. The 8,689 unique ESTs were categorized into different functional groups based on the MIPS criteria [29,30]. The highly expressed overlapping ESTs also helped in assembling full-length unique transcripts expressed in peanut seed, such as the putative allergen protein (iso-Ara h3, GenBank accession no. DQ855115). The putative functions of those identified unique ESTs have been predicted by similarity search according to MIPS (Fig. 4). Comparing to the Arabidopsis sequence data, 65.99% of total peanut unique ESTs matched Arabidopsis protein sequences with a known function and 17.58% had significant similarity to Arabidopsis protein sequences with unknown function. About 16.43% of the total unique ESTs showed no significant similarity to Arabidopsis al all. Those peanut ESTs matched Arabidopsis know functions were divided into nineteen categories [29,30]. A major portion of these genes with
http://www.biomedcentral.com/1471-213X/8/12
known functions fall in the category of metabolism (24.47%) followed by transcription (8.85%, Fig. 4). To further identify novel peanut sequences, a comprehensive similarity search against GenBank non-redudant (nr) database using the stand-alone BLASTx algorithm was performed and resulted in the identification of an additional 967 putative novel sequences including 165 unique peanut ESTs matching reported known peanut genes. The BLAST result revealed that significant number of unique peanut seed ESTs match soybean (396), Arabidopsis (2952), rice (682), and other plant species. In this study, some previously reported defense-related genes have been confirmed to be expressed. Desiccationrelated proteins could be induced by drought stress and were relatively sensitive to cellular dehydration [35,36]. The LEA (late embryogenesis abundant) proteins are known to be involved in protecting higher plants from damage caused by environmental stresses, especially dehydration from drought [37-39]. Serine protease inhibitors are involved in plant defense against pathogens and could be induced in response to infection by pathogens [40-42]. These three different classes of genes were up-regulated in the three reproduction stages of both 'GT-C20' and 'Tifrunner' libraries. Other related-genes with significant differential expression were present either in 'GTC20' or in 'Tifrunner'. For example, the PR10 protein family is induced by plants in response to pathogen infection as well as abiotic stress, and showed transcriptional upregulation upon biotic and abiotic stresses [43-45]. Calmodulin (CaM) is a ubiquitous Ca2+ sensor found in all eukaryotes and has been shown to participate in the regulation of diverse calcium-dependent physiological processes [46]. Calmodulin plays an important role in sensing and transducing changes in cellular Ca2+ concentration in response to several biotic and abiotic stresses [47]. CaM has been implicated in plant-pathogen interactions [48,49]. PR10 and Calmodulin were significantly up-regulated in 'GT-C20' libraries but not in 'Tifrunner' (Table 6). In contrast, two heat shock proteins, synthesized in response to heat stress [50-52], were detected up-regulated in 'Tifrunner' libraries but not in 'GT-C20' (Table 6). This raises questions of why certain genes are present or absent or show differential expression in different genotypes, such as 'GT-C20' and 'Tifrunner'. There are two possible hypothetic explanations. One is that in this study we randomly selected clones for cDNA sequencing and might have missed some clones that could be in 'GT-C20' or 'Tifrunner' libraries. The other is that the presence, absence or significantly differential expressions of certain genes, especially defense-related genes, are a result of the genetic differences (resistance and susceptibility) of these two genotypes. In order to verify the assumption that variability of expression might be a result of genetic differences in disease resistance or stresses tolerance, two genes (an
Page 12 of 16 (page number not for citation purposes)
BMC Developmental Biology 2008, 8:12
allergen protein iso ara h3, highly abundant and a constitutively expressed genes, and an LEA 4, a up-regulated and defense-related gene) were selected for sequence similarity analysis. As expected, the similarity of iso ara h3 between 'GT-C20' and 'Tifrunner' was 97%, however, LEA 4 sequences shared only 91% identity over 709 bases. For iso ara h3, among 1,692 consensus sequences, 6 gaps were found. For LEA 4, among 709 consensus sequences, 19 gaps were found (data not shown). The results implied that the allelic differences of defense-related genes were higher than that of constitutively expressed genes. Further investigations are necessary to characterize their gene functions and to analyze the patterns of their gene expressions.
Conclusion This is a unique study using both resistance and susceptibilities genotypes under the same environmental conditions as challenged by A. parasiticus and drought stress at specific seed developmental stages (R5, R6 and R7). The large number of peanut ESTs obtained provides an important resource for gene discovery, for gene expression profiling, and for microarray design [12,53]. The frequency of the individual EST demonstrated the temporal expression patterns of a given gene. The information from this study will significantly improve our understanding the mechanism of host resistance and provide a useful genomic resource for peanut breeding and aflatoxin research community.
Methods Libraries construction and sequencing The peanut varieties 'Tifrunner', susceptible to A. parasiticus but resistant to TSWV (tomato spotted wilt virus, the No.1 disease in southeastern US) and 'GT-C20', resistant to Aspergillus parasiticus but susceptible to TSWV, were selected for this experiment. The peanut plant materials used for RNA extraction were grown in the field and inoculated by A. parasiticus NRRL 2999 at mid-bloom (60 days after planting). Drought stress was imposed during the final 40 days before harvest through the use of rain-out shelters. Immature pods at the R5 (beginning seed), R6 (full seed) and R7 (beginning maturity) stages [54] from two peanut genotypes, 'GT-C20' and 'Tifrunner', were collected, frozen in liquid nitrogen, and stored at -80°C until RNA extraction.
Developing seeds were removed from the sampled immature pods for total RNA extraction. Six cDNA libraries from developing seeds were constructed according to the protocol reported previously [55]. The cDNA inserts were ligated to the pBlueScript vector. Each of the six cDNA libraries was named using first 2 letters from genotype followed by corresponding developing stage. For example,
http://www.biomedcentral.com/1471-213X/8/12
TFR5 refers to 'Tifrunner' at developing stage R5, and so on. Sequencing was performed using ABI 3730xl Genetic analyzer (Applied Biosystems) with the ABI Prism BigDye terminator cycle sequencing kit (Foster City, CA) from 5' end of cDNA using T3 sequencing primer. EST processing and clustering The short vector sequences were trimmed off from the raw sequence reads and the poor-quality sequences (less than 100 nucleotides) were removed by the Sequencher 4.6 software (Gene Codes, Ann Arbor, MI). The cleaned cDNA sequences from 'GT-C20' and 'Tifrunner' were separately assembled into TCs through the use of Phrap [56] with 90% minimum match. Sequences sharing greater than 90% identity over 40 or more contiguous bases with unmatched overhang less than 30 bases in length were placed into clusters. Overlaps exclusively on low complexity regions were excluded. Frequency of cDNAs in different libraries The six cDNA libraries were neither normalized nor subtracted. Therefore, the number of cDNA clones comprised of contigs may represent gene expression profiles at the different developmental stage. An "electronic Northern" was conducted through analyzing the frequency of cDNA clones within each contig. Six libraries were divided into two groups for analysis according to source genotype. Either group including three libraries constructed from the same peanut genotype at different stage was separately compiled and analyzed. Each of the three libraries represented different developmental stages (R5, R6 and R7) which were subjected to different lengths of fungal challenge and drought stress was analyzed to identify cDNAs whose presence was specific to that developmental stage and environmental challenge. Functional annotation of unique ESTs and bioinformatics In order to identify the putative functions of unique ESTs by BLAST against the NCBI (National Center for Biotechnology Information) non-redundant protein database (nr) and the Munich Information Center for Protein Sequences (MIPS), Arabidopsis Sequencing Project functional categories [29,30] were downloaded and localized.
A sequence similarity comparison between EST sequences and nr database was performed using the BLASTx algorithm [57,58] with NCBI default parameters. The unique sequences were considered to be homologous to known proteins in nr database when the E value of BLAST was less than 10-5 (the probability that alignment would be generated randomly is 1 4 were used for hierarchical clustering analysis.
2.
References 1.
3.
4. 5.
Comparative genome analysis between our ESTs and the currently available major crop EST gene indice in the databases was performed. These include Arabidopsis thaliana (81,826 ESTs), rape seed (Brassica napus) (25,929 ESTs), maize (Zea mays) (115,744 ESTs), Medicago truncatula (36,878 ESTs), rice (Oryza sativa) (181,796 ESTs), soybean (Glycine max) (63,676 ESTs), and wheat (Triticum aestivum) (122,282 ESTs). These TIGR EST gene indice (currently curated at Harvard University) were downloaded from the FTP site [60]. The following criteria were used in BLAST with the TIGR gene index, E-value less than 1e-5 and DNA identity more than 80% and 90%.
6.
7. 8.
9.
10.
Authors' contributions BZG conceived of the study was responsible for its design, participated in its coordination and cDNA library construction, and drafted and revised the manuscript. XC performed the data analysis, bioinformatics and helped to draft the manuscript. PD performed the library construction, sequencing and data analysis. BTS participated in the sequencing and coordination. XL participated in the design and collected the samples. CCH participated in the design, the field study and sample preparation. JY participated in the sequencing analysis. AKC participated in the field evaluation. All authors have read and approved the final manuscript.
11.
12.
13. 14. 15. 16.
Acknowledgements We thank Ernest Harris and Kippy Lewis for technical assistance in the field and the laboratory. The sequencing was done in the U.S. Horticultural Laboratory, USDA-ARS-SAA, Fort Pierce, Florida. We thank Dr. Huiping Chen for assistance in cDNA library construction and clone preparation for sequencing, and Drs. Marie-Michele Cordonnier-Pratt and Steve Knapp for their times and efforts in sequence processing. Sequence processing and assemblies were done in the Laboratory for Genomics and Bioinformatics, University of Georgia. We also thank Dr. Junjie Fu (China Agricultural University, Beijing) for his assistance in computer analysis. This research was supported by USDA Specific Cooperative Agreement 58-6602-6-121 with the University of Georgia, and partially supported by funds provided by USDA Agricultural Research Service, USDA Multi-Crop Aflatoxin Elimination Project, Peanut Foundation and Georgia Agricultural Commodity Commission for peanut. Mention of trade names or commercial products
17.
18.
19.
20.
Samuels GL: Toxigenic fungi as Ascomycetes. In Toxigenic FungiTheir Toxins and Health Hazards Edited by: Kurata H, Ueno Y. Elsevier. New York; 1984:119-128. Stoloff L: A rational for the control of aflatoxin in human foods. In Mycotoxins and Phytotoxins Edited by: Steyn PS, Vleggaar R. Elsevier. Amsterdam, Netherlands; 1985:457-471. Hill RA, Blankenship PD, Cole RJ, Sanders TH: Effects of soil moisture and temperature on preharvest invasion of peanuts by the Aspergillus flavus group and subsequent aflatoxin development. Appl Environ Microbiol 1983, 45:628-33. Holbrook CC, Kvien CK, Ruckers KS, Wilson DM, Hook JE: Preharvest aflatoxin contamination in drought tolerant and intolerant peanut genotypes. Peanut Sci 2000, 27:45-48. Sanders TH, Cole RJ, Blankenship PD, Dorner JW: Aflatoxin contamination of peanut from plants drought stressed in pod or root zones. Peanut Sci 1993, 20:5-8. Guo BZ, Holbrook CC, Yu J, Lee RD, Lynch RE: Application of technology of gene expression in response to drought stress and elimination of preharvest aflatoxin contamination. In Aflatoxin and Food Safety Edited by: Abbas HD. CRC Press, Boca Raton; 2005:313-331. Holbrook CC, Stalker HT: Peanut breeding and genetic resources. Plant Breed Rev 2003, 22:297-356. Guo BZ, Xu G, Cao YG, Holbrook CC, Lynch RE: Identification and characterization of phospholipase D and its association with drought susceptibilities in peanut (Arachis hypogaea). Planta 2006, 223:512-520. Liang XQ, Holbrook CC, Lynch RE, Guo BZ: β-1,3-Glucanase activity in peanut seed (Arachis hypogaea) is induced by inoculation with Aspergillus flavus and copurifies with a conglutinlike protein. Phytopathology 2005, 95:506-511. Liang XQ, Luo M, Guo BZ: Resistance mechanisms to Aspergillus flavus infection and aflatoxin contamination in peanut (Arachis hypogaea). Plant Pathol J 2006, 5:115-124. Luo M, Dang P, Guo BZ, He G, Holbrook CC, Bausher MG, Lee RD: Generation of expressed sequence tags (ESTs) for gene discovery and marker development in cultivated peanut. Crop Sci 2005, 45:346-353. Luo M, Liang XQ, Dang P, Holbrook CC, Bausher MG, Lee RD, Guo BZ: Microarray-based screening of differentially expressed genes in peanut in response to Aspergillus parasiticus infection and drought stress. Plant Sci 2005, 169:695-703. Temsch EM, Greilhuber J: Genome size variation in Arachis hypogaea and A. monticola re-evaluated. Genome 2000, 43:449-451. Sasaki T: Rice genome analysis: understanding the genetic secrets of the rice plant. Breed Sci 2003, 53:281-289. Bennett MD, Leitch IJ: Nuclear DNA amounts in angiosperms: progress, problems and prospects. Ann Bot (Lond) 2005, 95:45-90. Nelson RT, Shoemaker R: Identification and analysis of gene families from the duplicated genome of soybean using EST sequences. BMC Genomics 2006, 7:204. Houde M, Belcaid M, Ouellet F, Danyluk J, Monroy AF, Dryanova A, Gulick P, Bergeron A, Laroche A, Links MG, MacCarthy L, Crosby WL, Sarhan F: Wheat EST resources for functional genomics of abiotic stress. BMC Genomics 2006, 7:149. Adams MD, Kerlavage AR, Fleischmann RD, Fuldner RA, Bult CJ, Lee NH, Kirkness EF, Weinstock KG, Gocayne JD, White O: Initial assessment of human gene diversity and expression patterns based upon 83 million nucleotides of cDNA sequence. Nature 1995, 377:3-174. Ogihara Y, Mochida K, Nemoto Y, Murai K, Yamazaki Y, Shin IT, Kohara Y: Correlated clustering and virtual display of gene expression patterns in the wheat life cycle by large-scale statistical analyses of expressed sequence tags. Plant J 2003, 33:1001-1011. Ronning CM, Stegalkina SS, Ascenzi RA, Bougri O, Hart AL, Utterbach TR, Vanaken SE, Riedmuller SB, White JA, Cho J, Pertea GM, Lee Y, Karamycheva S, Sultana R, Tsai J, Quackenbush J, Griffiths HM,
Page 14 of 16 (page number not for citation purposes)
BMC Developmental Biology 2008, 8:12
21.
22.
23.
24.
25.
26. 27.
28. 29.
30.
31. 32. 33.
34. 35.
36.
37.
Restrepo S, Smart CD, Fry WE, Van Der Hoeven R, Tanksley S, Zhang P, Jin H, Yamamoto ML, Baker BJ, Buell CR: Comparative analyses of potato expressed sequence tag libraries. Plant Physiol 2003, 131:419-429. Yu J, Whitelaw CA, Nierman WC, Bhatnagar D, Cleveland TE: Aspergillus flavus expressed sequence tags for identification of genes with putative roles in aflatoxin contamination of crops. FEMS Microbiol Lett 2004, 237:333-40. Firnhaber C, Puhler A, Kuster H: EST sequencing and time course microarray hybridizations identify more than 700 Medicago truncatula genes with developmental expression regulation in flowers and pods. Planta 2005, 222:269-283. Forment J, Gadea J, Huerta L, Abizanda L, Agusti J, Alamar S, Alos E, Andres F, Arribas R, Beltran JP, Berbel A, Blazquez MA, Brumos J, Canas LA, Cercos M, Colmenero-Flores JM, Conesa A, Estables B, Gandia M, Garcia-Martinez JL, Gimeno J, Gisbert A, Gomez G, Gonzalez-Candelas L, Granell A, Guerri J, Lafuente MT, Madueno F, Marcos JF, Marques MC, Martinez F, Martinez-Godoy MA, Miralles S, Moreno P, Navarro L, Pallas V, Perez-Amador MA, Perez-Valle J, Pons C, Rodrigo I, Rodriguez PL, Royo C, Serrano R, Soler G, Tadeo F, Talon M, Terol J, Trenor M, Vaello L, Vicente O, Vidal C, Zacarias L, Conejero V: Development of a citrus genome-wide EST collection and cDNA microarray as resources for genomic studies. Plant Mol Biol 2005, 57:375-391. Lan L, Li M, Lai Y, Xu W, Kong Z, Ying K, Han B, Xue Y: Microarray analysis reveals similarities and variations in genetic programs controlling pollination/fertilization and stress responses in rice (Oryza sativa L.). Plant Mol Biol 2005, 59:151-164. Lo J, Lee S, Xu M, Liu F, Ruan H, Eun A, He Y, Ma W, Wang W, Wen Z, Peng J: 15000 unique zebrafish EST clusters and their future use in microarray for profiling gene expression patterns during embryogenesis. Genome Res 2003, 13:455-466. GenBank EST Dabase [http://www.ncbi.nlm.nih.gov/dbEST/ dbEST_summary.html] Proite K, Leal-Bertioli SC, Bertioli DJ, Moretzsohn MC, da Silva FR, Martins NF, Guimaraes PM: ESTs from a wild Arachis species for gene discovery and marker development. BMC Plant Biol 2007, 7:7. Yan YS, Lin XD, Zhang YS, Wang L, Wu KQ, Huang SZ: Isolation of peanut genes encoding arachins and conglutins by expressed sequence tags. Plant Sci 2005, 169:439-445. Schoof H, Ernst R, Nazarov V, Pfeifer L, Mewes HW, Mayer KF: MIPS Arabidopsis thaliana Database (MAtDB): an integrated biological knowledge resource for plant genomics. Nucleic Acids Res 2004, 32:D373-376. Mewes HW, Frishman D, Guldener U, Mannhaupt G, Mayer K, Mokrejs M, Morgenstern B, Munsterkotter M, Rudd S, Weil B: MIPS: a database for genomes and protein sequences. Nucleic Acids Res 2002, 30:31-4. Stekel DJ, Git Y, Falciani F: The comparison of gene expression from multiple cDNA libraries. Genome Res 2000, 10:2055-61. Ewing RM, Ben Kahla A, Poirot O, Lopez F, Audic S, Claverie JM: Large-scale statistical analyses of rice ESTs reveal correlated patterns of gene expression. Genome Res 1999, 9:950-959. Kim TH, Kim NS, Lim D, Lee KT, Oh JH, Park HS, Jang GW, Kim HY, Jeon M, Choi BH, Lee HY, Chung HY, Kim H: Generation and analysis of large-scale expressed sequence tags (ESTs) from a full-length enriched cDNA library of porcine backfat tissue. BMC Genomics 2006, 7:36. Yamamoto K, Sasaki T: Large-scale EST sequencing in rice. Plant Mol Biol 1997, 35:135-144. Oliver MJ, Dowd SE, Zaragoza J, Mauget SA, Payton PR: The rehydration transcriptome of the desiccation-tolerant bryophyte Tortula ruralis: transcript classification and analysis. BMC Genomics 2004, 5:89. Mariaux JB, Bockel C, Salamini F, Bartels D: Desiccation- and abscisic acid-responsive genes encoding major intrinsic proteins (MIPs) from the resurrection plant Craterostigma plantagineum. Plant Mol Biol 1998, 38:1089-99. Ditzer A, Bartels D: Identification of a dehydration and ABAresponsive promoter regulon and isolation of corresponding DNA binding proteins for the group 4 LEA gene CpC2 from C. plantagineum. Plant Mol Biol 2006, 61:643-663.
http://www.biomedcentral.com/1471-213X/8/12
38. 39.
40.
41.
42. 43.
44. 45.
46.
47.
48.
49.
50.
51.
52.
53.
54. 55.
56. 57. 58.
Hong-Bo S, Zong-Suo L, Ming-An S: LEA proteins in higher plants: structure, function, gene expression and regulation. Colloids Surf B Biointerfaces 2005, 45:131-135. Finkelstein RR: Abscisic acid-insensitive mutations provide evidence for stage-specific signal pathways regulating expression of an Arabidopsis late embryogenesis-abundant (lea) gene. Mol Gen Genet 1993, 238:401-408. Tian M, Huitema E, Da Cunha L, Torto-Alalibo T, Kamoun S: A Kazal-like extracellular serine protease inhibitor from Phytophthora infestans targets the tomato pathogenesis-related protease P69B. J Biol Chem 2004, 279:26370-26377. Qiao Y, Prabhakar S, Coccia EM, Weiden M, Canova A, Giacomini E, Pine R: Host defense responses to infection by Mycobacterium tuberculosis. Induction of IRF-1 and a serine protease inhibitor. J Biol Chem 2002, 277:22377-22385. Tiffin P, Gaut BS: Molecular evolution of the wound-induced serine protease inhibitor wip1 in Zea and related genera. Mol Biol Evol 2001, 18:2092-2101. Liu JJ, Ekramoddoullah AK, Piggott N, Zamani A: Molecular cloning of a pathogen/wound-inducible PR10 promoter from Pinus monticola and characterization in transgenic Arabidopsis plants. Planta 2005, 221:159-69. Srivastava S, Fristensky B, Kav NN: Constitutive expression of a PR10 protein enhances the germination of Brassica napus under saline conditions. Plant Cell Physiol 2004, 45:1320-1324. Hashimoto M, Kisseleva L, Sawa S, Furukawa T, Komatsu S, Koshiba T: A novel rice PR10 protein, RSOsPR10, specifically induced in roots by biotic and abiotic stresses, possibly via the jasmonic acid signaling pathway. Plant Cell Physiol 2004, 45:550-559. Mura A, Medda R, Longu S, Floris G, Rinaldi AC, Padiglia A: A Ca2+/ calmodulin-binding peroxidase from Euphorbia latex: novel aspects of calcium-hydrogen peroxide cross-talk in the regulation of plant defenses. Biochemistry 2005, 44:14120-14130. Reddy VS, Ali GS, Reddy AS: Characterization of a pathogeninduced calmodulin-binding protein: mapping of four Ca2+dependent calmodulin-binding domains. Plant Mol Biol 2003, 52:143-59. Takabatake R, Karita E, Seo S, Mitsuhara I, Kuchitsu K, Ohashi Y: Pathogen-induced calmodulin isoforms in Basal resistance against bacterial and fungal pathogens in tobacco. Plant Cell Physiol 2007, 48:414-423. Park CY, Heo WD, Yoo JH, Lee JH, Kim MC, Chun HJ, Moon BC, Kim IH, Park HC, Choi MS, Ok HM, Cheong MS, Lee SM, Kim HS, Lee KH, Lim CO, Chung WS, Cho MJ: Pathogenesis-related gene expression by specific calmodulin isoforms is dependent on NIM1, a key regulator of systemic acquired resistance. Mol Cells 2004, 18:207-213. Charng YY, Liu HC, Liu NY, Hsu FC, Ko SS: Arabidopsis Hsa32, a novel heat shock protein, is essential for acquired thermotolerance during long recovery after acclimation. Plant Physiol 2006, 140:1297-1305. de la Fuente van Bentem S, Vossen JH, de Vries KJ, van Wees S, Tameling WI, Dekker HL, de Koster CG, Haring MA, Takken FL, Cornelissen BJ: Heat shock protein 90 and its co-chaperone protein phosphatase 5 interact with distinct regions of the tomato I-2 disease resistance protein. Plant J 2005, 43:284-298. Ohba S, Wang ZL, Baba TT, Nemoto TK, Inokuchi T: Antisense oligonucleotide against 47-kDa heat shock protein (Hsp47) inhibits wound-induced enhancement of collagen production. Arch Oral Biol 2003, 48:627-633. Luo M, Dang P, Bausher MG, Holbrook CC, Lee RD, Lynch RE, Guo BZ: Identification of transcripts involved in resistance responses to leaf spot disease caused by Cercosporidium personatum in peanut (Arachis hypogaea). Phytopathology 2005, 95:381-387. Boote KJ: Growth stages of peanut (Arachis hypogaea L.). Peanut Sci 1982, 9:35-40. Luo M, Dang P, Guo BZ, He G, Holbrook CC, Bausher MG, Lee RD: Generation of Expressed Sequence Tags (ESTs) for Gene Discovery and Marker Development in Cultivated Peanut. Crop Sci 2005, 45:346-353. Phrap [http://www.phrap.org/] Altschul SF, Gish W, Miller W, Myers EW, Lipman DJ: Basic local alignment search tool. J Mol Biol 1990, 215:403-410. Altschul SF, Madden TL, Schaffer AA, Zhang J, Zhang Z, Miller W, Lipman DJ: Gapped BLAST and PSI-BLAST: a new generation of
Page 15 of 16 (page number not for citation purposes)
BMC Developmental Biology 2008, 8:12
59.
60.
http://www.biomedcentral.com/1471-213X/8/12
protein database search programs. Nucleic Acids Res 1997, 25:3389-3402. Saeed AI, Sharov V, White J, Li J, Liang W, Bhagabati N, Braisted J, Klapa M, Currier T, Thiagarajan M, Sturn A, Snuffin M, Rezantsev A, Popov D, Ryltsov A, Kostukovich E, Borisovsky I, Liu Z, Vinsavich A, Trush V, Quackenbush J: TM4: a free, open-source system for microarray data management and analysis. Biotechniques 2003, 34:374-378. TIGR EST gene indice FTP site [ftp://occams.dfci.harvard.edu/ pub/bio/tgi/data/]
Publish with Bio Med Central and every scientist can read your work free of charge "BioMed Central will be the most significant development for disseminating the results of biomedical researc h in our lifetime." Sir Paul Nurse, Cancer Research UK
Your research papers will be: available free of charge to the entire biomedical community peer reviewed and published immediately upon acceptance cited in PubMed and archived on PubMed Central yours — you keep the copyright
BioMedcentral
Submit your manuscript here: http://www.biomedcentral.com/info/publishing_adv.asp
Page 16 of 16 (page number not for citation purposes)