CIT. Journal of Computing and Information Technology, Vol. 24, No. 2, June 2016, 165–179 doi: 10.20532/cit.2016.1002745
165
Penguins Search Optimisation Algorithm for Association Rules Mining Youcef Gheraibia1, Abdelouahab Moussaoui2, Youcef Djenouri3, Sohag Kabir4 and Peng Yeng Yin5 Faculty of Science, Department of Computer Science and Mathematics, University of Mohammed Cherif Messaadia, Algeria Department of Computer Science, University of Feraht Abaas, Setif, Algeria 3 Computer Science Department, Saad Dahlab University, Blida, Algeria 4 Department of Computer Science, University of Hull, Hull, UK 5 Department of Information Management, National Chi Nan University, Puli, Taiwan 1 2
Association Rules Mining (ARM) is one of the most popular and well-known approaches for the decisionmaking process. All classic exhaustive ARM algorithms are time consuming and generate a very large number of association rules, even the recent proposed meta-heuristics based methods generate a small number of high quality rules but with high overlapping. To deal with this issue, we propose a new ARM approach based on penguins search optimisation algorithm (Pe-ARM for short). Moreover, an efficient measure is incorporated into the main process to evaluate the amount of overlapping among the generated rules. The proposed approach also ensures a good diversification over the whole solutions space. To demonstrate the effectiveness of the proposed approach, several experiments have been carried out on different data sets and specifically on the biological ones. The results reveal that the proposed approach outperforms the well known meta-heuristics ARM algorithms in both execution time and solution quality. ACM CCS (2012) Classification: Information systems → Information systems applications → Data mining → Association rules; Theory of computation → Design and analysis of algorithms → Mathematical optimization → Mixed discrete-continuous optimization → Bio-inspired optimization Keywords: association rules mining, penguins search optimisation algorithm, overlap measure, biological data-set, ARM
1. Introduction Association Rules Mining (ARM) is one of the most challenging and important tasks in data mining [1]. ARM problem was first introduced
by Agrawal and Shafer in [2]. It can be formalised as: Let I = {i1, i2, i3, ..., in} be a set of items and T = {t1, t2, t3, ..., tm} be a set of transactions. An association rule is an implication of the form ∅. X → Y such as X ⊆ I , Y ⊆ I , and X ∩ Y = The set of items X and Y are called antecedent (left-hand-side or LHS) and consequent (right-hand-side or RHS) of the given rule respectively. The ARM problem consists of extracting among the transactional database T, all pertinent rules respecting minimum support and minimum confidence constraints. Association rules are the core of many applications like data warehousing for indexing problem [3], information retrieval for request processing and educational data mining for improving education system [4]. Describing hidden patterns and different dependencies between the sets of data has the potential to efficiently improve the problem solving process. In the literature, ARM algorithms can be divided into two main categories: exact approaches and meta-heuristics based approaches. The exact approaches such as Apriori [5], FPGrowth [6], DIC [7], DHP [8] and Eclat [9] aim to extract all possible association rules. However, these algorithms are high time and space consuming when dealing with very large databases with many items and transactions. To reduce the computation time of such algorithms, a second category, meta-heuristics based approaches, have been proposed. Examples of such approaches include ARMGA [10] and G3PARM [11] for evolutionary algorithms,
166
PSO-ARM [12], ACOR [13] and BSO-ARM [14] for swarm intelligence. Authors in [15] have presented a survey on swarm intelligence (SI) approaches used for automatic programming. These algorithms have the potential to give only a subset of all relevant rules. Therefore, two challenges can be derived, the computation time of exact algorithms by exploring all rules space on one hand and the quality of extracted rules using meta-heuristics based approaches by taking into account the similar rules on the other hand. The penguins search optimisation algorithm (PeSOA) [16] is a nature inspired approach based on the collaborative hunting strategies of penguins. The penguins synchronise their dives to reduce the expenditure of energy in their hunting process. This strategy is used in the algorithm to quickly converge towards an optimal solution. The diversification strategy of the penguins search algorithm allows penguins to explore the whole solution space efficiently. The search process of penguins is based on the reserve of oxygen which allows penguins to decide whether to accelerate or decelerate while exploring the search space and also to decide whether to search or not in a given region. This has motivated the use of the PeSOA for the association rules mining problem to facilitate efficient exploration of the solution space. The objective function of the algorithm is to maximise the average of the statistical measure of the confidence and the support. We incorporate a new distance measure called overlapping distance to compute the amount of overlap between the generated rules. The rules that satisfy the maximum accepted overlap will be evaluated for the optimisation process. The overlapping distance helps the penguins search process to generate only the non redundant rules with low amount of overlapping among them. In this paper, a new algorithm called Pe-ARM (PeSOA: for association rules mining) is proposed to find a set of consistent, high quality rules with low amount of overlapping. This set of rules must cover the maximum number of transactions in the database. The rest of the paper is organised as follows: in the next section, relevant works on association rule mining with diverse applications are presented. Then, the penguins search optimisation algorithm is introduced in Section 3, followed by the proposed Pe-ARM approach in Section 4.
Y. Gheraibia et al.
The experimental results with both standard and biological data sets are reported in Section 5. Conclusion and future perspectives of the present work are provided in Section 6.
2. Related Works ARM approaches can be divided into two main categories, exact and meta-heuristic based methods. This section reports some existing ARM approaches from both categories. 2.1. ARM with Exact Methods The well known ARM exact algorithms are Apriori [5], AIS (Agrawal, Imielinski, Swami) [2], Eclat [9] and FP-Growth [6]. The Apriori algorithm is the most used exact algorithm for association rule mining. It starts by finding all item sets that satisfy minimum support (frequent item sets) also called large item sets. After that, Apriori uses these frequent item sets to generate association rules. AIS is the first proposed algorithm for mining association rules. The main drawbacks of this algorithm are that it requires multiple scanning of database, i.e., it is time consuming and requires more storage space. FP-growth uses FP-tree structure to compress the database, where a divide-and-conquer strategy is performed to decompose the mining tasks and the database as well. When dealing with large transactional database, these algorithms become high time and memory consuming. Thereafter, different approaches have been proposed to ameliorate the exact methods such as reducing the number of passes over the database, sampling the database, using parallelism, and adding constraints on the structure of rules [17]. 2.2. ARM with Metaheuristics Metaheuristics have been used to reduce the run time of the existing ARM algorithms. Genetic algorithm (GA) is the first evolutionary algorithm used to solve the ARM problem, such as GENAR [18], GAR [19]. Those two methods used the standard version of the genetic algorithm with poor representation of the solutions. Authors in [20] proposed a new application of GA for mining multi-dimension association rule
Penguins Search Optimisation Algorithm for Association Rules Mining
called Adaptive Genetic Algorithm (AGA). This approach uses a matrix for the mutation and the crossover. Two major differences between the classical GENAR and AGA are the mutation and the crossover. AGA uses parameter-free for the genetic operators, which means that the selection, the mutation, and the crossover are chosen automatically by the problem at a particular stage of evolution. Afterwards, several methods for improving genetic algorithm for association rule mining have been proposed to ameliorate genetic operators and the representation of solutions, such as ARMGA [10]. Often a hybrid method is used to reduce the cost, as well as to improve the original methods. A novel hybrid genetic based algorithm called PQGMA has been applied for association rules mining with the use of simulated annealing for the mutation and the crossover operations respectively. Quantum computing based method [21] uses an adaptive mutation rate, and provides a diversified population. G3APRM [11] is a new method for association rule mining with the use of genetic programming based on the Grammar Guided Genetic Programming to avoid invalid individuals found by genetic programming process. Authors in [22] proposed an ARM algorithm based on an evolutionary algorithm to extract rare association rules. The proposed approach is developed for the learning management system to extract information about unusual student behaviour. In [23], the authors reviewed all association rule mining algorithms based on genetic algorithm and its hybridisation. Other methods based on swarm intelligence have been designed for ARM problem. Particle swarm optimisation algorithm has been applied for association rule mining by [12]. In this algorithm the particle moves randomly on different neighbourhood and optimises the selection process with the best neighbour. The main difference between this method and the AGA is the use of neighbourhood points to improve the search intensification strategy. Other swarm intelligence algorithms have also been applied for ARM problem. Firstly, an Ant colony optimisation was employed in health application to deal with the health insurance databases [24]. ARMBGSA [25] is an association rule mining algorithm based on Newton's law of universal gravitation, namely a gravitational emulation local search algorithm, which is a nature inspired optimisation algorithm. In this
167
approach, each rule is modelled as a mass and all the masses attract each other according to the law of motion. Each iteration is based on the previous one and takes only the k-heaviest masses in order to influence the new masses. The algorithm generates few rules because the search space is reduced at each iteration. Authors in [26] proposed an ARM algorithm based on Ant programming. The aim of the approach is to discover the rare association rule by using two algorithms. The first algorithm evaluates each association rule with single-objective function to evaluate each individual separately, then the second algorithm considers simultaneously several objectives to evaluate individuals' fitness discovery of rare association rules. Authors in [27] proposed a new hybrid algorithm called (HBSO-TS) for association rule mining based on hybrid method based on Bees Swarm Optimisation (BSO) and Tabu Search (TS). BSO is used to explore the search space so that it can cover most of its neighbours. 2.3. ARM Applications for Genomic Algorithms for Association Rule Mining have been extensively developed in market basket analysis, and further studies concerning biological data sets are already available. In [28], the authors apply association rule mining process for genomic. Ant based Association Rule Mining (Ant-ARM) is employed to discover classification of rules for one particular class only, each ant is used to construct one Classification Association Rule and change one item set at a time. An improved method for integrated analysis of gene expression has been proposed using additional data [29]. Temporal association rules have been used to represent dependencies between different factors on gene regulatory network [30]. Recent works on biological data analysis based on association rules mining are reviewed in [31].
3. Penguins Search Optimisation Algorithm Penguins search optimisation algorithm (PeSOA) is a new swarm based meta-heuristic algorithm which was proposed in [16]. The PeSOA algorithm has been used to solve combinatorial
168
problems such as automotive safety integrity levels allocation [32], capitated vehicle routing problem [33] and optimal spaced seed finding [34]. The dietary behaviour of penguins may be explained by economic reasoning: it comes to a profitable food search activity when the gain of energy is greater than the expenditure required to obtain this gain. Penguins, behaving along the line of foraging predators, must extract information about the time and cost to get food and the energy content of prey in order to choose the course for making their next dive. PeSOA is inspired by the penguins' hunting behaviour and it generally works as follows. The population of penguins locates initial positions (solution spaces), this population is divided into a set of groups, and each group is assigned to a region in the whole solution space. Each penguin then dives and swims under the water to hunt fish while consuming its oxygen reserve. Different forms of the communication between penguins are occasionally taking place and the quantities of eaten fish increase. The process is repeated until a specified amount of fish is obtained or the maximum number of iterations is reached. The authors of [16] have shown that the PeSOA outperforms genetic algorithms and particle swarm optimisation in obtaining better values for benchmark optimisation functions. After a number of dives, a penguin returns to the surface and shares with its group affiliates the position and quantity of the food found. So the local best of each group continuously improves as more members report the food sources. After an entire cycle of the intra-group communication among all the penguin groups, the penguins might migrate to another group's habitat according to the probability of nutrition existence of each group in terms of the quantity of food found by all its members. The oxygen reserve depends on both the gain of the food source and the swimming duration a penguin endures. If the energy gain is positive, the longer the penguin stays under the water, the larger quantities of food it catches and thus becomes healthier. Otherwise, the longer the swimming duration, the more oxygen the penguin consumes. Hence, the oxygen reserve is updated according to the amelioration of the objective function. The oxygen reserve increases if the new solution is better than the previous one, and the oxygen reserve decreases in the opposite case. Local search strategy has been used with different swarm based meta-heu-
Y. Gheraibia et al.
ristics algorithm to compensate errors from discretisation [35]. A neighbourhood search strategy is implemented to explore around the penguins' position based on the oxygen reserve.
4. Pe-ARM: PeSOA for Association Rules Mining 4.1. Encoding When using the individual rule presentation, using a vector to encode a given individual, binary and integer encodings are the most used [36]. In binary encoding, each solution is represented by a vector S of n elements where n is the number of items. The i th element of a given solution S is set to 1 if the item i is in the rule and 0 otherwise. However, in integer encoding, the solution is represented by a vector S of k + 1 elements where k is the size of the rule. The first element is the separator index between the antecedent and the consequent parts of the solution. For all other elements i in S, if S[i] = j then the item j appears in the i th position of the rule. In Pe-ARM, both representations are combined to make an application of the penguins search operations and the fitness computation process easier. Indeed, three values (0, 1, 2) are used to interpret the presence of a given item in the rule. The value 0 means that the item is absent from the rule. The value 1 means that the item is present in the antecedent part of the rule. The value 2 means that the item participates in the consequent part of the rule. More formally, we have: 1. S [i] = 0 if the item i is not in the solution S. 2. S [i] = 1 if the item i belongs to the antecedent part of the solution S. 3. S [i] = 2 if the item i belongs to the consequent part of the solution S. This representation allows to separate the antecedent part from the consequent part where each single position of a given solution has the full interpretable information. Moreover, such representation is flexible and helps us in the calculation of the overlap measure. Example: Let I = {i1, i2, ..., i10} be a set of items. The solution S1 = {0, 0, 0, 1, 2, 1, 0, 0, 0, 0} represents the rule r1 : i4, i6 ⇒ i5.
Penguins Search Optimisation Algorithm for Association Rules Mining
4.2. Overlapping Measure The optimisation of ARM aims to maximise the average of the confidence and of the support to the generated rules. Optimisation algorithm gives only a set of the pertinent rules having a high confidence and support values. However, the generated rules may be redundant or similar [37]. To deal with this problem, we propose a new measure to evaluate the correlation between the generated rules, allowing to maximise the coverage of the target data. This new measure thus gives a set of consistent rules with minimum overlap. Definition. Let I = {i1, ..., im} be a set of items; D = {r1, ..., rn} be a set of association rules which can be defined as follows: rx = {(X, Y) / X ⊆ I, Y ⊆ I and X ∩ Y = ∅} Let μ be a function that computes the dissimilarity between two rules:
µ:
D ∗ D → R+
µ (ri , rj ) → ∑ k =0 σ k (ri , rj ) |ri |
0 if [(ik ∈ X r1 ) & (ik ∈ X r2 ) or [(ik ∈ Yr1 ) & (ik ∈ Yr 2 )] 1 r2 ) if [(ik ∈ X r1 ) & (ik ∈ Yr2 ) σ k (r1 ,= 2 or [(ik ∈ Yr1 ) & (ik ∈ X r2 )] otherwise 1 if While Xr1, Xr2 are the X parts of r1 and r2 element (rule) respectively, and Yr1, Yr2 are the Y parts of r1 and r2 element (rule) respectively. Proposition 1. μ satisfies the usual conditions for a distance metric: (i) μ(r1, r2) ≥ 0 and μ(r1, r2) = 0 if and only if r1 = r2 (ii) μ(r1, r2) = μ(r2, r1) (iii) μ(r1, r3) ≤ μ(r1, r2) + μ(r2, r3) for any r1, r2, r3 ∈E*E. Proof. (i) μ(r1, r2) = 0 if and only if r1, r2 agree in all items and this happens if and only if r1{x} = r2{x} and r1{y} = r2{y}.
169
(ii) The number of items in which r1 differs from r2 is equal to the number of items in which r2 differs from r1, because the distance metric is equal to the sum of all items |r1| + |r2| (iii) μ(r1, r2) is equal to the minimum number of items which change their position, or necessary to add, to get r2 from r1. In its turn, μ(r2, r3) is equal to the minimum number of items which change their position, or necessary to add, to get r3 from r2. So μ(r1, r2) + μ(r2, r3) changes r1 to r3. Hence, μ(r1, r2) + μ(r2, r3) ≥ μ(r1, r3) which is the minimum number of items that change position, or necessary to add, to get r3 from r1. Example. Let I = {A, B, C, D, E, F} be a set of items and (r1, r2) are two rules defined as follows: r1: A, C → D r2: C, D → E μ(r1, r2) = 2.5 μ(r1, r2) represents the amount of overlap between the two association rules r1 and r2. The amount of overlap for the two given rules can take a range of values from 0, which represents that the two rules are identical, to the sum of all items of the two rules |r1| + |r2| which represents that the two rules are absolutely distinct. In this example, the maximum overlap that can be found between the two rules is equal to six, so the amount of overlap μ(r1, r2) = 2.5 means that the two rules are 41% distinct. 4.3. Fitness Function The main goal of penguins search algorithm is to optimise the expenditure of energy (run time) and to improve the quality of generated rules. The generated rules have both individual and collective quality. The first quality represents the statistical measure (confidence and support) which is calculated only from the rule and the transactional database, whereas the second one aims to represent the correlation between the rules (overlap) which is well explained in the previous section. In the fitness computing, we
170
Y. Gheraibia et al.
are focused on the first aspect by taking the rules which maximise the average of the support (Supp) and the confidence (Conf). The fitness value is computed only for the rules satisfying the maximum accepted overlap where the maximum Overlap (Max-Overlap) is a predefined value that represents the maximum accepted distance between each pair of rules. More formally, the fitness function F for a given solution S can be formulated as: Fmax ( S ) =
Supp ( S ) + Conf ( S ) 2
where Supp ( S ) = Conf ( S ) =
| {t ∈ T | S [i ] ≠ 0 ⇒ S [i ] ⊆ t , ∀i ∈ [1...n ]} | |T | | {t ∈ T | S [i ] ≠ 0 ⇒ S [i ] ⊆ t , ∀i ∈ [1...n ]} | | {t ∈ T | S [i ] = 1 ⇒ S [i ] ⊆ t , ∀i ∈ [1...n ]} |
Example. Table1. Illustration of transactional database for fitness computing. Transaction t1
Item A
Item B
A
B
C
D
E
D
C
A
t2
t3 t4 t5
Item C
Let us consider the transactional database (see Table 1) that contains 5 transactions T = {t1, t2, t3, t4, t5} and 5 items I = {A, B, C, D, E}. For instance, to compute the support and the confidence of the solution S = (1, 2, 0, 0, 0) equivalent to the rule (A → B), the number of occurrences of the item set (A) and the item set (A, B) should be first determined. We notice that (A) is repeated 3 times and (A, B) are repeated together twice. As a result, the support of (A) is 3/5 and the support of (A, B) 25 is 2/5. So, the confidence of (A → B) is that 35 equals to 2/3. Now, using equation (1), the fitness 1 2 1 2 of S is calculated as: Fmax ( S ) = × + × , which equals to
8 15
.
( ) ( ) 2
5
2
3
Penguins Search Optimisation Algorithm for Association Rules Mining
171
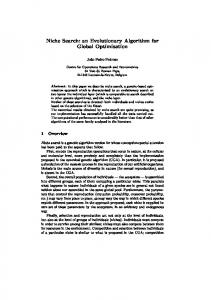
4.4. Algorithm of Pe-ARM Pe-ARM algorithm (see Figure 1) starts with generating a random population of penguins (each penguin represents a rule). This population is divided into groups, each group contains a variable number of penguins which is updated according to the penguins' health. The division of the initial population is based on the amount of overlapping between population rules. At first, a random penguin (Pr) is selected (will be the center of the first group) and all penguins that have a distance (amount of overlapping) from Pr less than the (Min-distance) will be added to this group. The Min-distance is equal to the average of distances between any two rules in the entire population. A new group is created if all other remaining penguins have a distance from Pr greater than Min-distance. The diversification generation strategy is used to generate K diversified groups in the initial penguin population. Pe-ARM starts with a population distributed in K groups, and each group is placed in a separate region with a maximum distance from one to another. The purpose is to start the search with a set of diversified initial solutions which have contrasting features benefiting future solution improvement and to control the non visited region in the coming iterations. Our main goal is to generate a set of consistent rules that have good fitness with small amount of overlap between them. The objective function of a given solution F(Pi) is formulated to maximise the average of statistical measure (confidence and support). Each penguin generates from its rule another set of rules (neighbours). The best rule among these rules that optimises the objective function is selected. Two (or more) individuals could obtain the same value for the objective function. In such a situation, the rule that has the minimum amount of overlap with the set of generated rule is selected. If two (or more) rules have the same value for the objective function and the same amount of overlap, the algorithm selects one randomly from them. The penguin can move to another position and generate these neighbours if and only if its oxygen reserve Oi is not depleted. This oxygen reserve is updated according to the objective function, and it represents the health of the penguin. After each iteration, the fitness of the solution of the previous iter-
Figure 1. Penguins search optimisation algorithm for ARM.
ation is subtracted from the fitness of the new solution to obtain the value of the oxygen reserve. If the result of the subtraction is positive, the oxygen reserve is increased to allow this penguin to move to other positions in the next iteration, otherwise the oxygen reserve is decreased. The oxygen reserve controls the energy of the penguins in the whole search process. If the oxygen reserve is depleted (equal to zero) the penguins move to another location, either in an existing group or to a new unexplored area. All generated rules are firstly validated with the overlap measure μ(Pi) before they are evaluated by the objective function. Any solution is validated (passed to the objective function evaluation) if it guarantees the maximum amount of overlap, allowed by other accepted rules. The objective function evaluation is performed only for the valid rules because it is usually a very time consuming task for any meta-heuristics based algorithm. The number of neighbours changes from one penguin to another and it is updated accord-
ing to the penguin's health (penguin's oxygen reserve). In each iteration, if the oxygen reserve increases, the number of neighbours also increases, in the opposite case the number of neighbours decreases. The number of neighbours is initialised to '1', in such situation the penguin can generate only one new position by swapping between the possible values (0, 1, 2) for one item set. The amount of oxygen allows the penguins to decide to search or not in a given area and the number of neighbours allows penguins to decide on evaluation of only a new position or a set of new positions. After each iteration, the penguins communicate with each other the best rule, GLbest, found to converge to the best group, update the oxygen reserve and the number of neighbours for each penguin. Computation of the health of each group is performed to define the probabilities of improvement in each group, and finally we redistribute the penguins in the new population according to the health of the penguins in each group (probabilities).
170
Y. Gheraibia et al.
are focused on the first aspect by taking the rules which maximise the average of the support (Supp) and the confidence (Conf). The fitness value is computed only for the rules satisfying the maximum accepted overlap where the maximum Overlap (Max-Overlap) is a predefined value that represents the maximum accepted distance between each pair of rules. More formally, the fitness function F for a given solution S can be formulated as: Fmax ( S ) =
Supp ( S ) + Conf ( S ) 2
where Supp ( S ) = Conf ( S ) =
| {t ∈ T | S [i ] ≠ 0 ⇒ S [i ] ⊆ t , ∀i ∈ [1...n ]} | |T | | {t ∈ T | S [i ] ≠ 0 ⇒ S [i ] ⊆ t , ∀i ∈ [1...n ]} | | {t ∈ T | S [i ] = 1 ⇒ S [i ] ⊆ t , ∀i ∈ [1...n ]} |
Example. Table1. Illustration of transactional database for fitness computing. Transaction t1
Item A
Item B
A
B
C
D
E
D
C
A
t2
t3 t4 t5
Item C
Let us consider the transactional database (see Table 1) that contains 5 transactions T = {t1, t2, t3, t4, t5} and 5 items I = {A, B, C, D, E}. For instance, to compute the support and the confidence of the solution S = (1, 2, 0, 0, 0) equivalent to the rule (A → B), the number of occurrences of the item set (A) and the item set (A, B) should be first determined. We notice that (A) is repeated 3 times and (A, B) are repeated together twice. As a result, the support of (A) is 3/5 and the support of (A, B) 25 is 2/5. So, the confidence of (A → B) is that 35 equals to 2/3. Now, using equation (1), the fitness 1 2 1 2 of S is calculated as: Fmax ( S ) = × + × , which equals to
8 15
.
( ) ( ) 2
5
2
3
Penguins Search Optimisation Algorithm for Association Rules Mining
171
4.4. Algorithm of Pe-ARM Pe-ARM algorithm (see Figure 1) starts with generating a random population of penguins (each penguin represents a rule). This population is divided into groups, each group contains a variable number of penguins which is updated according to the penguins' health. The division of the initial population is based on the amount of overlapping between population rules. At first, a random penguin (Pr) is selected (will be the center of the first group) and all penguins that have a distance (amount of overlapping) from Pr less than the (Min-distance) will be added to this group. The Min-distance is equal to the average of distances between any two rules in the entire population. A new group is created if all other remaining penguins have a distance from Pr greater than Min-distance. The diversification generation strategy is used to generate K diversified groups in the initial penguin population. Pe-ARM starts with a population distributed in K groups, and each group is placed in a separate region with a maximum distance from one to another. The purpose is to start the search with a set of diversified initial solutions which have contrasting features benefiting future solution improvement and to control the non visited region in the coming iterations. Our main goal is to generate a set of consistent rules that have good fitness with small amount of overlap between them. The objective function of a given solution F(Pi) is formulated to maximise the average of statistical measure (confidence and support). Each penguin generates from its rule another set of rules (neighbours). The best rule among these rules that optimises the objective function is selected. Two (or more) individuals could obtain the same value for the objective function. In such a situation, the rule that has the minimum amount of overlap with the set of generated rule is selected. If two (or more) rules have the same value for the objective function and the same amount of overlap, the algorithm selects one randomly from them. The penguin can move to another position and generate these neighbours if and only if its oxygen reserve Oi is not depleted. This oxygen reserve is updated according to the objective function, and it represents the health of the penguin. After each iteration, the fitness of the solution of the previous iter-
Figure 1. Penguins search optimisation algorithm for ARM.
ation is subtracted from the fitness of the new solution to obtain the value of the oxygen reserve. If the result of the subtraction is positive, the oxygen reserve is increased to allow this penguin to move to other positions in the next iteration, otherwise the oxygen reserve is decreased. The oxygen reserve controls the energy of the penguins in the whole search process. If the oxygen reserve is depleted (equal to zero) the penguins move to another location, either in an existing group or to a new unexplored area. All generated rules are firstly validated with the overlap measure μ(Pi) before they are evaluated by the objective function. Any solution is validated (passed to the objective function evaluation) if it guarantees the maximum amount of overlap, allowed by other accepted rules. The objective function evaluation is performed only for the valid rules because it is usually a very time consuming task for any meta-heuristics based algorithm. The number of neighbours changes from one penguin to another and it is updated accord-
ing to the penguin's health (penguin's oxygen reserve). In each iteration, if the oxygen reserve increases, the number of neighbours also increases, in the opposite case the number of neighbours decreases. The number of neighbours is initialised to '1', in such situation the penguin can generate only one new position by swapping between the possible values (0, 1, 2) for one item set. The amount of oxygen allows the penguins to decide to search or not in a given area and the number of neighbours allows penguins to decide on evaluation of only a new position or a set of new positions. After each iteration, the penguins communicate with each other the best rule, GLbest, found to converge to the best group, update the oxygen reserve and the number of neighbours for each penguin. Computation of the health of each group is performed to define the probabilities of improvement in each group, and finally we redistribute the penguins in the new population according to the health of the penguins in each group (probabilities).
172
Y. Gheraibia et al.
5. Experimentation and Results In order to evaluate effectiveness of the proposed algorithm, several evaluation criteria have been used in the experimentation process. Firstly, the statistical measure is computed which is represented as the average of the confidence and the support of the generated rules. Secondly, the execution time of each approach is determined. The last measure is the coverage formula which represents the similarities between the generated rules according to the number of common transactions. Indeed, the rules are similar when they verify together many transactions and dissimilar when they do not verify any transaction [37]. The coverage formula is given as follows: Let Tr be the set of transactions verified by ri, i and n is the number of generated rules.
∑ ∑ Coverage = n
n
η (ri , rj )
=i 1 =j 1
n(n − 1) i= j otherwise
0 η (ri , rj ) = Tri ∪ Tr j − Tri ∩ Tr j 5.1. Parameter Settings
The penguins search algorithm needs many parameters to ensure the diversification and the
intensification properties of the search process. The parameter values have a decisive influence on the quality of a solution and the time required to achieve the solution. The aim of this experiment is to find good parameter values to maximise the ratio between the fitness function (F) of generated rules and the CPU run time (T). Finding the optimal values for each parameter of an optimisation algorithm is a difficult task. These parameter values strongly depend on the used data and a large number of possible values for each parameter is possible. In the parameter settings, the value of each parameter is changed iteratively in order to find the best stabilised average values (Fitness function / CPU run time). For each parameter, the values are changed from small values to high values. The available data set can be divided into three categories: small, average and big data set. Each new parameter value is tested with the IBM-Quest data set which is one of the average data sets. As shown in Table 2, we see that when small number of penguins is used, the CPU run time is low. Consequently, small part of rule space is explored, which reduces the quality of the generated rules. Otherwise, when the number of penguins increases, we get a set of good rules but with increased CPU run time (we have used 100 generations for all tests). For the number of iterations (Table 3), we aim to stabilise the average of the fitness of the
Table 2. Performance of the Pe-ARM with different numbers of penguins. Data sets N Penguins
Bolts F
Sleep t
F
t
Pollution F
t
Basket-Ball IBM-Quest F
t
F
t
Quack F
t
Chess F
t
Mushroom F
t
10
0.81 0.03 0.88 0.24 0.79 0.21 0.91
0.14
0.81 0.19 0.81 0.54 0.80 0.61 0.78 1.21
15
0.85 0.05 0.93 0.31 0.91 0.28 0.95
0.20
0.86 0.21 0.89 0.61 0.83 0.70 0.79 1.41
20
0.98 0.08 0.97 0.39 0.97 0.35 0.98
0.29
0.90 0.25 0.90 0.69 0.87 0.76 0.81 1.58
25
0.99 0.10 0.99 0.46
1
0.37 0.99
0.31
0.92 0.28 0.90 0.76 0.88 0.80 0.84 1.67
30
1
0.13 0.99 0.52
1
0.44 0.99
0.37
0.92 0.35 0.90 0.82 0.88 0.87 0.84 1.72
35
1
0.18 0.99 0.57
1
0.49 0.99
0.44
0.92 0.39 0.89 0.87 0.88 0.93 0.84 1.79
40
1
0.21 0.97 0.62
1
0.56 0.98
0.46
0.91 0.42 0.90 0.93 0.87 0.99 0.84 1.83
0.99 0.25 0.99 0.75
1
0.62 0.98
0.53
0.92 0.56 0.90 1.10 0.88 1.15 0.82 1.99
50 60
1
0.30 0.98 0.82
1
0.81 0.99
0.61
0.92 0.63 0.90 1.25 0.88 1.32 0.84 2.18
75
1
0.41 0.99 0.91
1
0.95 0.99
0.82
0.92 0.75 0.90 1.39 0.88 1.49 0.84 2.32
100
1
0.62 0.99 1.14
1
1.24 0.99
1.02
0.92 0.92 0.90 1.52 0.88 1.81 0.84 2.61
173
Penguins Search Optimisation Algorithm for Association Rules Mining
Table 3. Performance of the Pe-ARM with different numbers of iterations Data sets N Iteration
Bolts F
Sleep t
F
Pollution t
F
Basket-Ball
t
F
IBM-Quest
t
F
t
Quack F
t
Chess F
t
Mushroom F
t
50
0.94 0.04 0.81 0.21 0.91 0.19 0.89
0.17
0.79
0.15 0.82 0.44 0.75 0.52 0.77 0.85
75
0.98 0.07 0.92 0.29 0.95 0.25 0.92
0.21
0.85
0.19 0.88 0.54 0.80 0.61 0.79 1.19
100
1
0.11 0.98 0.41 0.99 0.28 0.96
0.26
0.89
0.23 0.91 0.69 0.82 0.68 0.85 1.44
125
1
0.13 0.99 0.45
1
0.34 0.99
0.30
0.92
0.27 0.90 0.75 0.88 0.77 0.84 1.59
150
1
0.15
1
0.48
1
0.37
1
0.32
0.91
0.30 0.90 0.81 0.89 0.82 0.88 1.64
175
1
0.18
1
0.50
1
0.41
1
0.36
0.92
0.32 0.91 0.92 0.89 0.88 0.87 1.71
200
1
2.1
1
0.56 0.99 0.43 0.99
0.39
0.92
0.36 0.91 1.05 0.88 0.95 0.88 1.79
225
1
2.5
1
0.57 0.99 0.46
1
0.44
0.91
0.38 0.92 1.17 0.89 1.00 0.85 1.85
250
1
2.7
1
0.62
0.50
1
0.49
0.92
0.43 0.90 1.26 0.89 1.14 0.84 1.93
275
1
3.0
1
0.64 0.99 0.54
1
0.51
0.92
0.45 0.91 1.32 0.87 1.21 0.86 2.05
300
0.99
3.3
1
0.68 0.99 0.59
1
0.53
0.92
0.49 0.90 1.56 0.88 1.32 0.88 2.21
325
1
3.8
0.98 0.70
0.56
0.92
0.52 0.91 1.62 0.89 1.38 0.87 2.33
350
1
4.2
0.99 0.71 0.98 0.66
0.59
0.92
0.53 0.91 1.75 0.89 1.42 0.88 2.43
375
1
4.5
1
0.73
1
0.68 0.99
0.63
0.91
0.54 0.91 1.86 0.88 1.49 0.89 2.49
400
0.99
4.7
1
0.72
1
0.73 0.99
0.67
0.92
0.61 0.92 1.96 0.89 1.55 0.87 2.58
425
1
5.1
1
0.77
1
0.75
1
0.69
0.91
0.63 0.90 2.10 0.78 1.61 0.87 2.63
450
1
5.5
0.99 0.79
1
0.78
1
0.73
0.92
0.65 0.92 2.23 0.89 1.64 0.88 2.71
475
1
5.4
1
0.82
1
0.75
0.92
0.69 0.91 2.32 0.88 1.70 0.87 2.88
1
0.81
1
1
0.62 0.99 1
solutions with the execution time as well. It is evident from the table that the smaller the number of iterations, the smaller the average confidence and support and the smaller the execution time. This is due to the fact that with a fewer number of iterations a fewer number of rules are generated. However, if the number of iterations is increased the average of confidence and support is also increased, but with a higher execution time. Based on the obtained results, the number of iterations is set to 100 and the number of penguins is set to 25. For instance, the number of penguins is a prominent parameter since the number of penguins has a high correlation with the number of groups (one penguin will form only one group, so the higher the number of penguins, the higher the probability of forming a new group). 5.2. Evaluation with Standard Data Sets The following data sets were prepared by [38] from the UCI data sets and PUMSB, though
they have been converted to apriori binary format. It has been widely used in the evaluation and comparison process for association rule mining problem. These data sets can be classified into three categories ‒ small, medium and large [39]. Table 4 describes the size of the used data sets, the number of transactions and the number of items in each of the transactions. Table 4. Standard data sets description. Data set
Transactions size
Items size
Bolts
40
8
Sleep
56
8
Pollution
60
16
Basket-Ball
96
5
IBM-Quest
1000
40
Quack
2178
4
Chess
3196
75
Mushroom
8124
119
174
Y. Gheraibia et al.
We have compared the performance of the PeARM with a set of well known association rule mining algorithms (BSO-ARM [27], ACOR [13], SA [40], G3PARM [11], ARMBGSA [25]). The parameters used by these algorithms are the optimal values proposed by the authors. Tables 5, 6 and 7 summarise all the results obtained by applying Pe-ARM and the above mentioned approaches on various standard data sets. The aim is to maximise the average of the statistical measures (confidence and support)
and to minimise the overlap between rules in order to maximise the coverage. The proposed Pe-ARM algorithm with the new overlap measure gives the best coverage values compared to other algorithms. This is due to the fact that the set of association rules generated by the PeARM (with the overlap measure) has low overlap between them. The mechanism of the penguins algorithm ensures a good intensification on the way to ameliorate the execution time. In the experimentation of standard data sets cases,
Table 5. Comparison of Pe-ARM with different approaches for confidence and support average. Data sets
Pe-ARM
BSO-ARM
ACOR
SA
G3PARM
ARMBGSA
Bolts
1.00
1.00
0.69
0.60
0.92
0.45
Sleep
1.00
1.00
0.67
0.53
0.90
0.39
Pollution
1.00
1.00
0.66
0.50
0.92
0.56
Basket-Ball
1.00
1.00
0.61
0.66
0.93
0.45
IBM-Quest
0.92
0.89
0.45
0.30
0.88
0.40
Quack
0.91
0.89
0.73
0.52
0.90
0.39
Chess
0.89
0.86
0.3
0.15
0.86
0.38
Mushroom
0.88
0.84
0.1
0.05
0.85
0.35
Table 6. Run time (in seconds) comparison among the Pe-ARM and other approaches. Data sets
Pe-ARM
BSO-ARM
ACOR
SA
G3PARM
ARMBGSA
Bolts
0.12
0.22
1.23
1.04
0.59
1.17
Sleep
0.48
0.95
2.1
2.4
0.87
1.38
Pollution
0.35
0.62
1.1
1.6
0.67
1.87
Basket-Ball
0.28
0.56
1.3
1.5
0.42
2.10
IBM-Quest
0.251
0.32
0.9
1.9
0.87
1.45
Quack
0.67
0.75
1.5
2.4
1.00
1.94
Chess
0.725
0.85
2.4
3.02
0.99
2.41
Mushroom
1.474
1.5
3.6
2.8
1.84
3.98
Table 7. Run time (in seconds) comparison among the Pe-ARM and other approaches. Data sets
Pe-ARM
BSO-ARM
ACOR
SA
G3PARM
ARMBGSA
Bolts
11
11
5
4.12
8.24
6.25
Sleep
11.23
11.23
5
5.65
6.01
5.9
Pollution
11.25
11.25
6.24
5.32
5.98
6.02
Basket-Ball
12.65
12.65
4.10
7.01
6.8
5
IBM-Quest
15.2
6.14
6.98
4.28
6.87
7.82
Quack
21.51
10.25
9.24
8.24
11.08
10.01
Chess
29.41
9.27
8.21
10.36
8.52
9.88
Mushroom
35.25
12.34
10.01
9.85
12.38
12.01
175
Penguins Search Optimisation Algorithm for Association Rules Mining
we have used 0.50 as the maximum overlap accepted, meaning that half of the two rules can be similar. The minimum support and minimum confidence threshold values are not required, the algorithm provides the best solutions obtained (the maximum support/confidence values depend on the data sets under study). The use of the overlap distance gives meaning to the right and the left side of the rule. If the average support is 0.6 and the average confidence is 0.7, then the average of both is 0.65. At the same time, another algorithm could obtain the same average, i.e., 0.65, but with different support and confidence values (e.g. 0.59 for support and 0.71 for confidence). The results could show that both algorithms behave similarly (0.65 as the value for the average of support and confidence), but the difference between these two rules is in the amount of overlap. 5.3. Evaluation with Biological Data Sets One of the useful applications of association rules mining is in bio-informatics [41]. In this section, we have used several biological data sets for gene expression under a (sub)set of conditions [42]. In the context of market basket analysis, gene expression data can be used as a single transaction, and each condition as an item. Also, each condition can be validated or not in a given transaction (gene expression). Since the gene expression data belong to continuous real values, a discretisation preprocessing for the gene expression data is needed [43]. Data set values are discretised into two values:
Table 8. Biological data sets description. Data set
Transactions size Items size
Leukemia
12457
72
Arabidopsis Thaliana
73
69
Saccharomyces Cerevisiae
190
170
Yeast
94
174
Alpha Factor
911
17
Cdc15
607
607
Elutriation
5632
15
0 if the condition is less than or equal to 0; and 1 otherwise. Table 8 presents the description of the gene expression data set. The main motivation behind using biological data sets for evaluation is the specificity of gene expression data sets that contain comprehensive and integrated biological information, enabling the discovery of functional relationships between those information. Table 9 shows that the maximum confidence and support for the rules are obtained by using the proposed approach. Interestingly, although the Pe-ARM provides maximum average confidence and support, it takes the minimum amount of run time compared to other approaches (see Table 10). It is evident from Table 11 that the Pe-ARM provides maximum coverage among all other approaches. It is also seen that the coverage of the final set of association rules for the data set elutriation is very high as well as the average confidence and sup-
Table 9. Comparison of Pe-ARM with different approaches for confidence and support average (Biological data sets). Data sets
Pe-ARM
BSO-ARM
ACOR
SA
G3PARM
ARMBGSA
Leukemia
0.78
0.68
0.45
0.41
0.65
0.51
0.64
0.51
0.41
0.48
0.54
0.39
0.59
0.38
0.34
0.31
0.37
0.35
0.55
0.38
0.37
0.37
0.40
0.41
Alpha factor
0.64
0.46
0.43
0.39
0.44
0.50
Cdc15
0.62
0.43
0.43
0.48
0.43
0.39
Elutriation
0.69
0.43
0.50
0.40
0.41
0.38
Arabidopsis Thaliana Saccharomyces Cerevisiae Yeast
174
Y. Gheraibia et al.
We have compared the performance of the PeARM with a set of well known association rule mining algorithms (BSO-ARM [27], ACOR [13], SA [40], G3PARM [11], ARMBGSA [25]). The parameters used by these algorithms are the optimal values proposed by the authors. Tables 5, 6 and 7 summarise all the results obtained by applying Pe-ARM and the above mentioned approaches on various standard data sets. The aim is to maximise the average of the statistical measures (confidence and support)
and to minimise the overlap between rules in order to maximise the coverage. The proposed Pe-ARM algorithm with the new overlap measure gives the best coverage values compared to other algorithms. This is due to the fact that the set of association rules generated by the PeARM (with the overlap measure) has low overlap between them. The mechanism of the penguins algorithm ensures a good intensification on the way to ameliorate the execution time. In the experimentation of standard data sets cases,
Table 5. Comparison of Pe-ARM with different approaches for confidence and support average. Data sets
Pe-ARM
BSO-ARM
ACOR
SA
G3PARM
ARMBGSA
Bolts
1.00
1.00
0.69
0.60
0.92
0.45
Sleep
1.00
1.00
0.67
0.53
0.90
0.39
Pollution
1.00
1.00
0.66
0.50
0.92
0.56
Basket-Ball
1.00
1.00
0.61
0.66
0.93
0.45
IBM-Quest
0.92
0.89
0.45
0.30
0.88
0.40
Quack
0.91
0.89
0.73
0.52
0.90
0.39
Chess
0.89
0.86
0.3
0.15
0.86
0.38
Mushroom
0.88
0.84
0.1
0.05
0.85
0.35
Table 6. Run time (in seconds) comparison among the Pe-ARM and other approaches. Data sets
Pe-ARM
BSO-ARM
ACOR
SA
G3PARM
ARMBGSA
Bolts
0.12
0.22
1.23
1.04
0.59
1.17
Sleep
0.48
0.95
2.1
2.4
0.87
1.38
Pollution
0.35
0.62
1.1
1.6
0.67
1.87
Basket-Ball
0.28
0.56
1.3
1.5
0.42
2.10
IBM-Quest
0.251
0.32
0.9
1.9
0.87
1.45
Quack
0.67
0.75
1.5
2.4
1.00
1.94
Chess
0.725
0.85
2.4
3.02
0.99
2.41
Mushroom
1.474
1.5
3.6
2.8
1.84
3.98
Table 7. Run time (in seconds) comparison among the Pe-ARM and other approaches. Data sets
Pe-ARM
BSO-ARM
ACOR
SA
G3PARM
ARMBGSA
Bolts
11
11
5
4.12
8.24
6.25
Sleep
11.23
11.23
5
5.65
6.01
5.9
Pollution
11.25
11.25
6.24
5.32
5.98
6.02
Basket-Ball
12.65
12.65
4.10
7.01
6.8
5
IBM-Quest
15.2
6.14
6.98
4.28
6.87
7.82
Quack
21.51
10.25
9.24
8.24
11.08
10.01
Chess
29.41
9.27
8.21
10.36
8.52
9.88
Mushroom
35.25
12.34
10.01
9.85
12.38
12.01
175
Penguins Search Optimisation Algorithm for Association Rules Mining
we have used 0.50 as the maximum overlap accepted, meaning that half of the two rules can be similar. The minimum support and minimum confidence threshold values are not required, the algorithm provides the best solutions obtained (the maximum support/confidence values depend on the data sets under study). The use of the overlap distance gives meaning to the right and the left side of the rule. If the average support is 0.6 and the average confidence is 0.7, then the average of both is 0.65. At the same time, another algorithm could obtain the same average, i.e., 0.65, but with different support and confidence values (e.g. 0.59 for support and 0.71 for confidence). The results could show that both algorithms behave similarly (0.65 as the value for the average of support and confidence), but the difference between these two rules is in the amount of overlap. 5.3. Evaluation with Biological Data Sets One of the useful applications of association rules mining is in bio-informatics [41]. In this section, we have used several biological data sets for gene expression under a (sub)set of conditions [42]. In the context of market basket analysis, gene expression data can be used as a single transaction, and each condition as an item. Also, each condition can be validated or not in a given transaction (gene expression). Since the gene expression data belong to continuous real values, a discretisation preprocessing for the gene expression data is needed [43]. Data set values are discretised into two values:
Table 8. Biological data sets description. Data set
Transactions size Items size
Leukemia
12457
72
Arabidopsis Thaliana
73
69
Saccharomyces Cerevisiae
190
170
Yeast
94
174
Alpha Factor
911
17
Cdc15
607
607
Elutriation
5632
15
0 if the condition is less than or equal to 0; and 1 otherwise. Table 8 presents the description of the gene expression data set. The main motivation behind using biological data sets for evaluation is the specificity of gene expression data sets that contain comprehensive and integrated biological information, enabling the discovery of functional relationships between those information. Table 9 shows that the maximum confidence and support for the rules are obtained by using the proposed approach. Interestingly, although the Pe-ARM provides maximum average confidence and support, it takes the minimum amount of run time compared to other approaches (see Table 10). It is evident from Table 11 that the Pe-ARM provides maximum coverage among all other approaches. It is also seen that the coverage of the final set of association rules for the data set elutriation is very high as well as the average confidence and sup-
Table 9. Comparison of Pe-ARM with different approaches for confidence and support average (Biological data sets). Data sets
Pe-ARM
BSO-ARM
ACOR
SA
G3PARM
ARMBGSA
Leukemia
0.78
0.68
0.45
0.41
0.65
0.51
0.64
0.51
0.41
0.48
0.54
0.39
0.59
0.38
0.34
0.31
0.37
0.35
0.55
0.38
0.37
0.37
0.40
0.41
Alpha factor
0.64
0.46
0.43
0.39
0.44
0.50
Cdc15
0.62
0.43
0.43
0.48
0.43
0.39
Elutriation
0.69
0.43
0.50
0.40
0.41
0.38
Arabidopsis Thaliana Saccharomyces Cerevisiae Yeast
176
Y. Gheraibia et al.
Table 10. Run time (in seconds) comparison among the Pe-ARM and other approaches (Biological data sets). Data sets
Pe-ARM
BSO-ARM
ACOR
SA
G3PARM
ARMBGSA
Leukemia
1.8
2.4
3.8
3.1
2.61
3.01
0.867
1.875
2.1
1.9
1.12
2.10
1.283
3.025
3.85
2.08
2.02
1.54
0.571
1.457
1.98
0.86
1.42
1.04
Alpha factor
0.822
1.958
2.35
2.87
2.01
0.99
Cdc15
0.704
2.656
2.99
1.05
2.31
1.11
Elutriation
1.339
2.38
3.01
2.81
2.15
2.51
Arabidopsis Thaliana Saccharomyces Cerevisiae Yeast
Table 11. Comparison of Pe-ARM with different approaches for the coverage of 100 generated rules (Biological data sets). Data sets
Pe-ARM
BSO-ARM
ACOR
SA
G3PARM
ARMBGSA
Leukemia
1273.82
645.56
512.01
496.58
715.54
544.60
Arabidopsis Thaliana Saccharomyces Cerevisiae Yeast
48.46
27.45
25.14
25.27
21.14
24.98
169.02
92.46
53.27
51.14
48.74
68.24
84.19
80.04
84.21
64.25
64.25
88.00
Alpha factor
461.41
221.15
102.46
98.57
184.54
113.56
Cdc15
520.62
252.98
232.97
201.62
412.32
199.85
Elutriation
1545.62
915.75
814.65
901.54
754.62
865.25
port. This can be interpreted as: the set of generated rules are diverse and cover maximum number of different transactions. This is very important for biological data sets because they can grow very large, consist of small items and therefore require more coverage. From the results shown in Tables 9, 10, and 11, we can conclude that the Pe-ARM approach outperforms the well known meta-heuristics based ARM approaches in all aspects (e.g. execution time, coverage, etc.).
6. Conclusion In this work, a new association rules mining algorithm based on penguins search optimisation algorithm (Pe-ARM) has been proposed. To evaluate the amount of overlapping between generated rules, a new way of overlapping measure is incorporated into the main method of the Pe-ARM. This incorporation helps to generate
a set of consistent rules. Pe-ARM has been compared with a set of well known meta-heuristics based methods for association rule mining. The comparison was made to evaluate the performance of different methods in terms of computational time, statistical measures (confidence and support) and finally the coverage measure. Two different types of data sets, e.g., standard and biological, were used to help the evaluation process. The use of biological data sets allows us to validate the approach with the data that contain a huge number of associations between item sets. The gene expression data sets are made to facilitate different functionalities like extracting rules between conditions of genes. The experiments confirm that the proposed Pe-ARM outperforms other well known meta-heuristics based ARM approaches in terms of statistical measures, coverage, and execution time for both standard and biological data sets. Currently, we are investigating to develop a new method to represent large data, in order to further improve the execution time.
Penguins Search Optimisation Algorithm for Association Rules Mining
References [1] N. Sharma and H. Om, "Framework for early detection and prevention of oral cancer using data mining", International Journal of Advances in Engineering & Technology, vol. 4, pp. 302–310, 2012. [2] R. Agrawal et al., "Mining association rules between sets of items in large databases", in ACM SIGMOD Record, vol. 22, pp. 207–216, ACM, 1993. [3] Z. Chen, Intelligent Data Warehousing: From data preparation to data mining, CRC press, 2001. http://dx.doi.org/10.1201/9781420040616 [4] C. Romero et al., "Data mining in course management systems: Moodle case study and tutorial", Computers & Education, vol. 51, no. 1, pp. 368–384, 2008. http://dx.doi.org/10.1016/j.compedu.2007.05.016 [5] R. Agrawal et al., "Fast algorithms for mining association rules", in Proc. of the 20th int. conf. on very large data bases, VLDB, vol. 1215, pp. 487–499, 1994. [6] J. Han et al., "Mining frequent patterns without candidate generation", in ACM SIGMOD Record, vol. 29, pp. 1–12, ACM, 2000. [7] S. Brin et al., "Dynamic itemset counting and implication rules for market basket data", in ACM SIGMOD Record, vol. 26, pp. 255–264, ACM, 1997. [8] J. S. Park et al., An effective hash-based algorithm for mining association rules, vol. 24. ACM, 1995. http://dx.doi.org/10.1145/223784.223813 [9] M. Zaki, "Scalable algorithms for association mining", Knowledge and Data Engineering, IEEE Transactions on, vol. 12, no. 3, pp. 372–390, 2000. http://dx.doi.org/10.1109/69.846291 [10] X. Yan et al., "Genetic algorithm-based strategy for identifying association rules without specifying actual minimum support", Expert Systems with Applications, vol. 36, no. 2, pp. 3066–3076, 2009. http://dx.doi.org/10.1016/j.eswa.2008.01.028 [11] J. L. Olmo et al., "Association rule mining using a multi-objective grammar-based ant programming algorithm", in Intelligent Systems Design and Applications (ISDA), 2011 11th International Conference on, pp. 971–977, IEEE, 2011. http://dx.doi.org/10.1109/isda.2011.6121784 [12] R. J. Kuo et al., "Application of particle swarm optimization to association rule mining", Applied Soft Computing, vol. 11, no. 1, pp. 326–336, 2011. http://dx.doi.org/10.1016/j.asoc.2009.11.023
177
[13] P. Moslehi et al., "Multi-objective numeric association rules mining via ant colony optimization for continuous domains without specifying minimum support and minimum confidence", International Journal of Computer Science Issues (IJCSI), vol. 8, no. 5, 2011. [14] Y. Djenouri et al., "Bees swarm optimisation using multiple strategies for association rule mining", International Journal of Bio-Inspired Computation, vol. 6, no. 4, pp. 239–249, 2014. http://dx.doi.org/10.1504/IJBIC.2014.064990 [15] J. L. Olmo et al., "Swarm-based metaheuristics in automatic programming: a survey", Wiley Interdisciplinary Reviews: Data Mining and Knowledge Discovery, vol. 4, no. 6, pp. 445–469, 2014. http://dx.doi.org/10.1002/widm.1138 [16] Y. Gheraibia and A. Moussaoui, "Penguins search optimization algorithm (pesoa)", in Recent Trends in Applied Artificial Intelligence, pp. 222–231, Springer, 2013. http://dx.doi.org/10.1007/978-3-642-38577-3_23 [17] J. Hipp et al., "Algorithms for association rule mininga general survey and comparison", ACM sigkdd explorations newsletter, vol. 2, no. 1, pp. 58–64, 2000. [18] J. Mata et al., "Mining numeric association rules with genetic algorithms", in Artificial Neural Nets and Genetic Algorithms, pp. 264–267, Springer, 2001. http://dx.doi.org/10.1007/978-3-7091-6230-9_65 [19] J. Mata et al., "An evolutionary algorithm to discover numeric association rules", in Proceedings of the 2002 ACM Symposium on Applied computing, pp. 590–594, ACM, 2002. http://dx.doi.org/10.1145/508791.508905 [20] M. Wang et al., "Multi dimensions association rules mining on adaptive genetic algorithm", in IEEE International Conference on Uncertainly Reasoning on Knowledge Engineering, 2011. http://dx.doi.org/10.1109/urke.2011.6007931 [21] M. Ykhlef, "A quantum swarm evolutionary algorithm for mining association rules in large databases", Journal of King Saud University-Computer and Information Sciences, vol. 23, no. 1, pp. 1–6, 2011. http://dx.doi.org/10.1016/j.jksuci.2010.03.001 [22] J. Luna et al., "An evolutionary algorithm for the discovery of rare class association rules in learning management systems", Applied Intelligence, vol. 42, no. 3, pp. 501–513, 2015. http://dx.doi.org/10.1007/s10489-014-0603-4 [23] M. Zhang and C. He, "Survey on association rules mining algorithms", in Advancing Computing, Communication, Control and Management,
178
Y. Gheraibia et al.
pp. 111–118, Springer, 2010. http://dx.doi.org/10.1007/978-3-642-05173-9_15 [24] K. Thangavel and P. Jaganathan, "Rule mining algorithm with a new ant colony optimization algorithm", in Conference on Computational Intelligence and Multimedia Applications, 2007. International Conference on, vol. 2, pp. 135–140, IEEE, 2007. http://dx.doi.org/10.1109/iccima.2007.225 [25] F. Khademolghorani et al., "Efficient mining of association rules based on gravitational search algorithm", International Journal of Computer Science Issues (IJCSI), vol. 8, no. 4, 2011. [26] J. L. Olmo et al., "Single and multiobjective ant programming for mining interesting rare association rules", International Journal of Hybrid Intelligent Systems, vol. 11, no. 3, pp. 197–209, 2014. [27] Y. Djenouri et al., "A hybrid bees swarmoptimization and tabu search algorithm for association rule mining", in Nature and Biologically Inspired Computing (NaBIC), 2013 World Congress on, pp. 120–125, IEEE, 2013. [28] M. Anandhavalli et al., "Association rule mining in genomics", International Journal of Computer Theory and Engineering, vol. 2, no. 5, 2010. [29] P. Carmona-Saez et al., "Integrated analysis of gene expression by association rules discovery", BMC bioinformatics, vol. 7, no. 1, p. 54, 2006. http://dx.doi.org/10.1186/1471-2105-7-54 [30] J. M. Luna et al., "G3parm: a grammar guided genetic programming algorithm for mining association rules", in Evolutionary Computation (CEC), 2010 IEEE Congress on, pp. 1–8, IEEE, 2010. http://dx.doi.org/10.1109/cec.2010.5586504 [31] G. Atluri et al., "Association analysis techniques for bioinformatics problems", in Bioinformatics and Computational Biology, pp. 1–13, Springer, 2009. http://dx.doi.org/10.1007/978-3-642-00727-9_1 [32] Y. Gheraibia et al., "Can aquatic flightless birds allocate automotive safety requirements?", in 2015 IEEE Seventh International Conference on Intelligent Computing and Information Systems (ICICIS), pp. 1–6, IEEE, 2015. http://dx.doi.org/10.1109/IntelCIS.2015.7397214 [33] M. Ammi and S. Chikhi, "Cooperative parallel metaheuristics based penguin optimization search for solving the vehicle routing problem", International Journal of Applied Metaheuristic Computing (IJAMC), vol. 7, no. 1, pp. 1–18, 2016. http://dx.doi.org/10.4018/IJAMC.2016010101 [34] Y. Gheraibia et al., "Penguin search optimisation algorithm for finding optimal spaced seeds", International Journal of Software Science and Com-
putational Intelligence (IJSSCI), vol. 7, no. 2, pp. 85–99, 2015. http://dx.doi.org/10.4018/IJSSCI.2015040105 [35] Y. Wang and L. Li, "Heterogeneous redundancy allocation for series-parallel multi-state systems using hybrid particle swarm optimization and local search", Systems, Man and Cybernetics, Part A: Systems and Humans, IEEE Transactions on, vol. 42, no. 2, pp. 464–474, 2012. http://dx.doi.org/10.1109/TSMCA.2011.2159585 [36] X. Yan et al., "Genetic algorithm-based strategy for identifying association rules without specifying actual minimum support", Expert Systems with Applications, vol. 36, no. 2, pp. 3066–3076, 2009. http://dx.doi.org/10.1016/j.eswa.2008.01.028 [37] Y. Djenouri et al., "An efficient measure for evaluating association rules", in 2014 6th International Conference of Soft Computing and Pattern Recognition (SoCPaR), pp. 406–410, IEEE, 2014. http://dx.doi.org/10.1109/socpar.2014.7008041 [38] K. Bache and M. Lichman, "Uci machine learning repository", University of California, School of Information and Computer Science, Irvine, CA 2013. [39] S. Ozel and H. Guvenir, "An algorithm for mining association rules using perfect hashing and database pruning", in 10th Turkish Symposium on Artificial Intelligence and Neural Networks, pp. 257–264, Citeseer, 2001. [40] S. Naulaerts et al., "A primer to frequent itemset mining for bioinformatics", Briefings in bioinformatics, p. bbt074, 2013. [41] A. Gyenesei et al., "Mining co-regulated gene profiles for the detection of functional associations in gene expression data", Bioinformatics, vol. 23, no. 15, pp. 1927–1935, 2007. http://dx.doi.org/10.1093/bioinformatics/btm276 [42] D. Liu, "Improved genetic algorithm based on simulated annealing and quantum computing strategy for mining association rules", Journal of Software, vol. 5, no. 11, pp. 1243–1249, 2010. http://dx.doi.org/10.4304/jsw.5.11.1243-1249 [43] G. Li et al., "Qubic: a qualitative biclustering algorithm for analyses of gene expression data", Nucleic acids research, vol. 37, no. 15, pp. e101–e101, 2009. http://dx.doi.org/10.1093/nar/gkp491
Received: July, 2015 Revised: December, 2015 Accepted: February, 2016
Penguins Search Optimisation Algorithm for Association Rules Mining
179
Contact addresses: Youcef Gheraibia Faculty of Science Department of Computer Science and Mathematics University of Mohammed Cherif Messaadia Souk Ahras, 41000 Algeria e-mail:
[email protected]
Youcef Gheraibia received the PhD degree in Computer Science from the University of Annaba in 2016. Currently, he is a lecturer at the Department of Computer Science, Mohamed-Cherif Messaadia University - Souk Ahras, Algeria. His researches projects are currently devoted to data mining, machine learning, combinatorial optimization, bioinformatics and computational biology.
Abdelouahab Moussaoui Department of Computer Science University of Feraht Abaas, Setif Campus El Bez. Sétif 19000 Algerie e-mail:
[email protected]
Abdeoulahab Moussaoui is Professor at Ferhat Abbas University. He received his BSc in Computer Science in 1990 from the Department of Computer Science at the University of Science and Technology of Houari Boumedienne (USTHB), Algeria. His current research interests include the fuzzy neuronal network and non-parametric classification using unsupervised knowledge system applied to biomedical image segmentation and bioinformatics.
Youcef Djenouri Computer Science Department Université Saad Dahlab de Blida route de Soumâa BP 270 Blida (09000) Algerie e-mail:
[email protected]
Youcef Djenouri received his PhD from USTHB University in 2015. He currently has active collaboration with LITA Laboratory at the University of Metz. Currently, he is a lecturer at the Department of Computer Science, Saad Dahlb University ‒ Blida, Algeria. His research interests include data mining, intelligent agent, and parallel paradigm.
Sohag Kabir Department of Computer Science University of Hull, Hull, UK Cottingham Rd, Hull East Riding of Yorkshire HU6 7RX United Kingdom e-mail:
[email protected] Peng Yeng Yin Department of Information Management National Chi Nan University, Puli (545) Daxue Rd., Puli Township Nantou County 545 Taiwan e-mail:
[email protected]
Sohag Kabir received the PhD degree in Computer Science from the University of Hull, UK in 2016. He received the MSc degree in Embedded Systems from the University of Hull in 2012 and BSc degree in Computer Science and Engineering from Military Institute of Science and Technology (MIST), Bangladesh in 2010. His research interests include model-based safety assessment, probabilistic risk and safety analysis, dynamic safety and reliability analysis, stochastic modelling and analysis, and information encoding.
Peng Yeng Yin received his B.S., M.S. and Ph.D. degrees in Computer Science from National Chiao Tung University, Hsinchu, Taiwan. His current research interests include artificial intelligence, evolutionary computation, educational informatics, metaheuristics, pattern recognition, image processing, machine learning, software engineering, computational intelligence, and operations research.