Open Access Article
Meteorologische Zeitschrift, Vol. 18, No. 3, 253-265 (June 2009) c by Gebr¨uder Borntraeger 2009
Performance and application of a multi-wavelength, ground-based microwave radiometer in intense convective weather PAK WAI C HAN∗ Hong Kong Observatory, Hong Kong, China (Manuscript received September 3, 2008; in revised form March 20, 2009; accepted March 20, 2009)
Abstract Thermodynamic and dynamic quantities, such as the K-index and GUSTEX (a wind gust estimate), are commonly used in the nowcasting of intense convective weather. In the past, they were derived from conventional upper-air ascent measurements, which were normally only available twice a day. In the tropics, the thermodynamic property of the troposphere could change rapidly in rain episodes and the conventional upper-air ascent data alone are not sufficient for nowcasting purposes. This paper discusses the use of a multi-wavelength, ground-based microwave radiometer to provide frequently updated (once every 5 minutes) thermodynamic profiles of the troposphere up to 10 km for the nowcasting of severe convective weather during a field experiment in Hong Kong in 2004. The accuracy of the radiometer’s measurements is first established by comparing with the temperature and humidity profiles of upper-air ascents and the integrated water vapour of Global Positioning System (GPS) receivers. The humidity profile and K-index from the radiometer in a number of rainstorm cases are then studied. They are found to give useful indications of the accumulation of water vapour and the increasing degree of instability of the troposphere before the occurrence of the heavy rain. The continuous availability of the thermodynamic profiles from the radiometer also makes it possible to study the correlation between K-index and the degree of instability of the troposphere. In this study, the tropospheric instability is expressed in terms of the total number and the rate of lightning strikes within 20 km or so from the radiometer. It is found to have good correlation with the time-averaged K-index from the radiometer during the heavy rain episodes in the field experiment period. Furthermore, the feasibility of combining the thermodynamic profiles from the radiometer and wind profiles given by radar wind profilers in the continuous estimation of wind gusts is studied. The estimated and the actual gusts are reasonably well correlated. The wind gusts so estimated are found to provide better indications of the strength of squalls, with a lead time of about one hour, compared with those based on radiosonde measurements. Overall speaking, the microwave radiometer is able to provide very useful data in the nowcasting of intense convective weather. Zusammenfassung Thermodynamische und dynamische Gr¨oßen wie der K-Index und der B¨oensch¨atzwert GUSTEX werden vielfach bei der Unwettervorhersage benutzt. Fr¨uher wurden sie aus u¨ blicherweise zweimal t¨aglich verf¨ugbaren Radiosondenaufstiegsdaten berechnet. In den Tropen k¨onnen sich diese Gr¨oßen in Regenepisoden aber rasch a¨ ndern, so dass zwei Aufstiege pro Tag f¨ur eine K¨urzestfristvorhersage nicht ausreichend sind. Die vorliegende Arbeit diskutiert die Ableitung thermodynamischer Profile in der Troposph¨are bis 10 km H¨ohe mit einem bodengest¨utzten Multiwellenl¨angen-Mikrowellen-Radiometer w¨ahrend einer Messkampagne in Hong Kong im Jahre 2004. Die Genauigkeit der Messungen wird durch Vergleich mit Temperaturund Feuchteprofilen aus Radiosondenaufstiegen und mit dem von GPS-Empf¨angern ermittelten Wasserdampfs¨aulengehalt gepr¨uft. Anschließend werden Feuchteprofile und Werte des K-Index bei Gewittern aus Radiometer-Daten untersucht. Es zeigt sich, dass sie brauchbare Hinweise auf die Ansammlung von Wasserdampf und auf eine wachsende instabile Schichtung der Troposph¨are vor schweren Gewittern geben. Die kontinuierliche Verf¨ugbarkeit von thermodynamischen Profilen aus Radiometer-Daten erlaubt es auch, die Korrelation zwischen dem K-Index und der Instabilit¨at der Troposph¨are zu untersuchen. Die troposph¨arische Instabilit¨at wird hier u¨ ber die Gesamtzahl und die H¨aufigkeit von Blitzen in ca. 20 km Umkreis um das Radiometer ausgedr¨uckt. Es zeigt sich, dass dieses Maß w¨ahrend der Messkampagne gut mit dem zeitlich gemittelten K-Index aus den Radiometer-Daten korrelierte. Weiter wird die Machbarkeit der Verbindung thermodynamischer Profile vom Radiometer mit Windprofilen aus Windprofiler-Daten f¨ur die kontinuierliche Absch¨atzung von B¨oen untersucht. Gesch¨atzte und beobachtete B¨oen erweisen sich als zufriedenstellen korreliert. Die so abgesch¨atzten B¨oen geben eine Stunde im Voraus bessere Hinweise auf die St¨arke von B¨oenlinien, als solche aus Radiosondendaten. Insgesamt kann festgestellt werden, dass ein MikrowellenRadiometer sehr brauchbare Daten f¨ur die K¨urzestfristvorhersage bereitstellt.
1 Introduction In operational weather forecasting, it is a common practice to examine the temperature and humidity profiles ∗ Corresponding author: Pak Wai Chan, Hong Kong Observatory, 134A Nathan Road, Kowloon, Hong Kong, China, e-mail:
[email protected]
DOI 10.1127/0941-2948/2009/0375
measured by radiosondes and the derived instability indices in nowcasting heavy rain and thunderstorms. Reference is also made to the wind gust estimate based on the temperature, humidity and wind measurements from the radiosondes (M C C ANN, 1994; G EERTS, 2001
0941-2948/2009/0375 $ 5.85 c Gebr¨uder Borntraeger, Berlin, Stuttgart 2009
254
P.W. Chan: Intense convective weather
and L EE, 2007). However, radiosonde measurements are normally only available twice a day and, during rain episodes, thermodynamic properties of the troposphere could change rapidly in between measurements, especially in subtropical coastal areas like Hong Kong. More frequently available thermodynamic information, together with wind data up to the upper troposphere (e.g. from radar wind profilers, C HAN and Y EUNG, 2003), would greatly benefit severe weather nowcasting. Ground-based microwave radiometers (ROSE and C ZEKALA, 2003; K NUPP et al., submitted) retrieve the temperature and humidity profiles up to 10 km by measuring the radiation intensity at a number of frequency channels in the microwave spectrum that are dominated by atmospheric water vapor, cloud liquid water and molecular oxygen emissions. These profiles are available nearly continuously, at intervals of several minutes. They are mainly used in non-precipitating conditions because the radiometer measurements become less accurate in the presence of a water film on the outer housing (radome) of the equipment. Moreover, the radiometer retrieval normally does not include the scattering and emission/absorption effects of rain. Recently there are some progress in applying rain-effect mitigation methods to the radiometer, such as a hydrophobic radome and forced airflow over the radome surface. As a result, reasonably accurate thermodynamic profiles can be obtained at a rainfall rate up to 10 mm/hour (e.g. R ADIOMETER P HYSICS, 2008). However, this rainfall rate is still much lower than that observed in typical heavy rain episodes in the subtropical areas, which normally far exceeds 30 mm/hour. This paper presents the performance and application of a multi-wavelength, ground-based microwave radiometer in intense convective weather during a field experiment conducted in Hong Kong in 2004. The equipment setup of the experiment is described in Section 2. The accuracy of the temperature and humidity profiles as well as precipitable water vapour (PWV) from the radiometer is first assured by comparing with measurements from the radiosonde, a wind profiler/Radio Acoustic Sounding System (RASS) and Global Positioning System (GPS) receivers in Section 3. The performance of the radiometer data in a rain episode is described in Section 4, which suggests that there is reasonable degree of correlation between the instability index of the troposphere as calculated from the radiometer data and the occurrence of lightning flashes. This relationship is studied further in Section 4. Section 5 discusses the application of the radiometer data in the nowcasting of squall associated with intense convective weather. Conclusion of this paper is given in Section 6.
2 Equipment setup The radiometer in this study (similar to that in K NUPP et al., submitted) measures the radiation intensity at
Meteorol. Z., 18, 2009
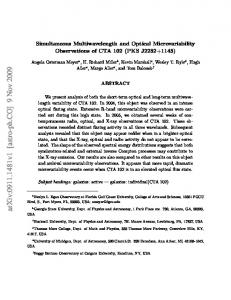
Figure 1: The radiometer has been placed at Hong Kong Observatory (HKO) Headquarters, Cheung Chau and Sha Lo Wan for the periods in parenthesis during the experiment. The map shows the network of surface anemometers (red dots) and radar wind profilers (green triangles) in Hong Kong. The radiosonde station (orange) and the two GPS receivers mentioned in this paper (blue) are also shown. Height contours are in 100 m.
7 oxygen channels (51–59 GHz) and 5 water-vapour channels (22–30 GHz) to obtain the temperature and humidity profiles. It is equipped with a hydrophobic radome surface and a blower of heated air over the radome to minimize the effect of rain on radiometer measurement. During the field experiment, the radiometer was configured to make both zenith scans and elevation scans at fixed angles. Following other similar studies (e.g. H EWISON et al., 2004 and K NUPP et al., submitted), only the zenith scan data are used in this paper to retrieve the thermodynamic profiles of the troposphere up to 10 km, which are normally available every 5 minutes. Retrieval of temperature and humidity profiles from the radiation intensity measurements of the radiometer is accomplished by neural network methods based on historical radiosonde data, using a radiative transfer model to simulate the observations of a radiometer (K NUPP et al., (submitted). In this study, the neural network was trained by a high-resolution radiosonde dataset collected at King’s Park (location in Figure 1) with a data availability rate of 0.5 Hz during the ascent of the balloon (which translates to a spatial resolution of around 10 m for the typical ascent speed). Radiosonde data of a whole year (2003) were used in the neural network. The field experiment was conducted in Hong Kong from February to June 2004. The radiometer was placed at three locations and its data are compared with those from the radiosonde, a wind profiler/RASS and GPS receivers (Figure 1). In studying the thermodynamic index given by the radiometer, we also refer to the data from a lightning location network (M URPHY and C UM MINS, 2000), which detects cloud-to-ground flashes out to about 100 km from Hong Kong.
Meteorol. Z., 18, 2009
P.W. Chan: Intense convective weather
(a)
255
(b)
Figure 2: The biases and standard deviations of the radiometer measurements with respect to the concurrent radiosonde data. The sample size at each height is about 400.
3.1 Comparison with radiosondes
Figure 3: The relative humidity profiles from the radiometer and the radiosonde at 00 UTC, 31 May 2004, showing the wet bias of the radiometer in the middle troposphere and dry bias in the upper troposphere (red arrows).
In estimating the wind gust associated with thunderstorms, reference is also made to the vertical wind profiles provided by radar wind profilers (locations in Figure 1). These profilers are of the boundary-layer type and operate at a frequency of 1299 MHz. They measure in two modes, viz. the low and the high modes. The low mode starts at 116 m above ground, with a height increment of 60 m up to about 1500 m; the high mode starts at 260 m above ground, with a height increment of 200 m up to about 9000 m. Wind profiles are available every 10 minutes.
3 Comparison of data from radiometer and other instruments The quality of the radiometer data is established by comparison with the measurements from other meteorological instruments in Hong Kong, namely, radiosonde, wind profiler/RASS and GPS receivers.
Temperature and humidity profiles from the radiometer are compared with those from the radiosonde launched at King’s Park. Their biases and standard deviations with respect to the radiosonde measurements are shown in Figure 2. The sample size is about 400. The comparison results are considered to be statistically significant (a sample size greater than 50) though the comparison period is quite limited seasonally (just spring and early summer). The followings are observed about the radiometer data: (a) For temperature, there is a warm bias up to about 1.4 km and a cold bias further aloft. The standard deviation increases gradually with height, but is generally smaller than about 2 degrees Celsius. The relatively large values of bias and standard deviation of the temperature at the lowest levels may be related to the separation between the radiometer and the radiosonde, which ranges from about 1 km (when the radiometer was placed at HKO Headquarters) to more than 20 km (when the radiometer was placed at Sha Lo Wan); (b) For relative humidity, there is a wet bias between about 1.2 km and 5.8 km, and a dry bias higher up. The standard deviation again increases with height, but is mostly below 20 %. Please note that comparison of relative humidity data between the radiosonde and the radiometer is more challenging than, for instance, comparison of absolute humidity because the errors of both temperature and water vapour measurements from the radiometer are taken into consideration. Relative humidity data are compared here because they are more directly applicable to weather nowcasting in comparison to absolute humidity. The above results are generally consistent with those obtained in other studies of the same kind of groundbased radiometer (e.g. H EWISON et al. (2004), which studied radiometer data up to 4 km). Since the relative humidity data have a greater impact on the application of the radiometer to rain nowcasting, we study the humidity profiles from the radiometer in
256
P.W. Chan: Intense convective weather
Meteorol. Z., 18, 2009
Figure 5: The bias and standard deviation of the virtual temperature from the radiometer with respect to the concurrent data from a wind profiler/RASS. The sample size at each height is about 800.
Figure 4: Comparison of the K-index from the radiosonde and the radiometer.
more detail. First of all, the wet bias of the radiometer in the mid-troposphere is related to the occasional occurrence of an elevated, moist layer that is not measured by the radiosonde (an example in Figure 3). This moist layer appeared more frequently in the latter part of the field experiment, sometimes close to saturation. The occurrence of this moist layer is not supported by other observations (e.g. appearance of cloud layers) and the available analysis of numerical weather prediction models (not shown). It points to a need to review the radiative transfer model employed by the radiometer for the summer monsoonal weather in southern China, but this is outside the scope of the present paper. Secondly, as regard the dry bias in the upper troposphere (Figure 3), the radiometer basically relies on the climatological profile at those altitudes, which shows a general decrease of the relative humidity with height. In other words, the retrieval is more heavily weighted by climatology at higher levels. But sometimes the upper troposphere becomes more humid than normal in the summer-time due to the presence of cirrus clouds (e.g. from the upperlevel outflow of a rainband). Retrieval of the humidity profile at these heights may be improved by incorporating the brightness temperature measurements from geostationary meteorological satellites (L ILJEGREN, 2004). For nowcasting of rain, K-index (KI) is calculated from the temperature and humidity profiles of the radiometer, KI = (T850 − T500 ) + T d850 − (T700 − T d700 ) (3.1) where T is the temperature, T d is the dew point and subscripts are the pressure levels (in hPa). Radiometer data are given in heights, and the conversions to pressure levels are made by assuming hydrostatic approximation. K-indices from the radiometer and the radiosonde are
compared in Figure 4. They are found to correlate well, with a correlation coefficient of 0.856. The radiometer tends to give a slightly larger K-index due to the wet bias near 700 hPa, which is about 3 km above MSL for southern China. Nonetheless, in view of all the above comparison results with the radiosonde, the radiometer can provide reasonably accurate temperature and humidity profiles for rain nowcasting. KI is considered in this paper because it is commonly used for assessing convective instability in southern China. It is a more challenging application of radiometer data because the temperature and humidity values at specific pressure levels need to be measured accurately. Future study would consider using radiometer data to calculate vertically integrated quantities such as convective available potential energy (CAPE). For instance, F ELTZ and M ECIKALSKI (2002) have used ground-based atmospheric emitted radiance interferometer (AERI) data to calculate CAPE in the monitoring of severe storm environment in the U.S.
3.2 Comparison with wind profiler/rass During the period when the radiometer was placed at Sha Lo Wan (Figure 1), its measurements were used to calculate virtual temperatures for comparison with those from the co-located wind profiler/RASS. The comparison results are shown in Figure 5. The sample size is about 800, and as such the comparison results are considered to be statistically significant (sample size >50). However, the comparison is limited in period seasonally (i.e. only spring and early summer). Once again, there is a warm bias of 0.5– 1 degree Celsius within the boundary layer, and the standard deviation ranges between 1 and 1.5 degrees. All these are consistent with the comparison results with the radiosonde (Figure 2a). So it appears that the slight warm bias of the radiometer measurement in the boundary layer may not only be related to the location difference of the radiometer and the reference instrument (radiosonde or wind profiler/RASS),
Meteorol. Z., 18, 2009
P.W. Chan: Intense convective weather
Figure 6: Comparison of PWV (in mm) from the GPS receivers and the radiometer. The two measurements sometimes differ by 10 mm or more (e.g. data points encircled.
Figure 7: PWV from the radiometer and the GPS receivers as well as the 1-minute rainfall measured at the radiometer’s location (Cheung Chau) in the morning of 8 May 2004. A doubtful piece of data from the radiometer is indicated by a red arrow.
but could also be an inherent property of the radiometer itself. Further study in this area would be required from co-located measurements of the radiometer and the radiosonde/RASS over a much longer period of time.
3.3 Comparison with GPS receivers The precipitable water vapour (PWV) data from the GPS receiver closest to the location of the radiometer are used in the comparison, namely, the GPS receiver at Stonecutters Island when the radiometer was placed at the Hong Kong Observatory headquarters and Cheung Chau, and the one at Siu Lang Shui when the radiometer was moved to Sha Lo Wan (locations all shown in Figure 1). The comparison results are shown in Figure 6. The two measurements are correlated well, with a correlation coefficient exceeding 0.9. Relatively large dis-
257
crepancies are occasionally observed between the two measurements. For instance, for the data-points encircled in Figure 6, the PWV from the radiometer is larger than that from the nearest GPS receiver by 10 mm or more. An example of such a case is shown in Figure 7. The radiometer was placed at Cheung Chau at that time, and it was co-located with a tipping-bucket rain gauge with a resolution of 0.5 mm. It appears from this case that, when the rain is heavy (at a maximum rate of 0.5 mm/min = 30 mm/hour, as also indicated in the rainfall estimation from the weather radar [not shown]) but not continuous, the PWV values from the radiometer and the GPS receivers are generally consistent with each other (e.g. before 6 a.m. and after 7 a.m. in Hong Kong time, which is 8 hours ahead of UTC). But when the rain is heavy and more or less continuous (between 6 and 7 a.m.), the PWV from the radiometer exhibits rather rapid fluctuations that are not observed in the GPS data. The two measurements could differ by more than 10 mm at times (e.g. at 6:31 a.m., indicated by a red arrow). To ascertain that this difference is not due to local variation of rainfall rate, we have examined the rainfall measurements from a network of rain gauges in Hong Kong and the weather radar imageries. The rainfall rates are found to be about the same at the locations of the radiometer and the two GPS receivers (not shown). The radiometer data at these moments are considered to be doubtful and they will not be used, for instance, to calculate the temporally averaged K-index in Section 4.2. There could be a couple of reasons for the discrepancy in PWV between the radiometer and GPS receiver. Firstly, for the radiometer, a warm bias in the brightness temperature is expected from scattering and emission/absorption from rain drops. Secondly, the radiometer information is derived along a vertical beam, whereas the GPS value is derived along various slant paths from GPS satellites, and as such the GPS measurement considers a much larger volume. Concerning the effect of rain on the radiometer data, further study would be conducted to find out any correlation between the PWV difference (GPS - radiometer) and rainfall rate at the time of the radiometer measurement.
4 Application to rain nowcasting Application of the radiometer to rain nowcasting is first demonstrated in a case study. The correlation between the K-index derived from the radiometer data and the number/frequency of lightning flashes is then discussed.
4.1 A case study A heavy rain episode in the afternoon of 17 April 2004 is used to demonstrate the application of the radiometer in rain nowcasting. Synoptically, a trough of low pressure lingered near the south China coast on that day (Figure 8). Weather radar imageries (a snapshot in Figure 9)
258
P.W. Chan: Intense convective weather
Meteorol. Z., 18, 2009
Figure 8: Surface isobaric chart at 8 a.m., 17 April 2004.
Figure 10: Time-height plots of the radiometer data between 2 p.m. (06 UTC) and 9 p.m. (13 UTC) of 17 April 2004. The upper panel shows the temperature and the cloud-base height. The middle panel is the relative humidity. The lower one is the liquid water content. (The plots are generated by the software ”Vizmet” bundled with the radiometer.) The time series of 1-minute rainfall measured at the Hong Kong International Airport (location in Figure 1) is shown at the bottom. The corresponding time series of lightning flashes is given in Figure 11.
Figure 9: Weather radar imagery at 3 km AMSL at 6 p.m., 17 April 2004. The range rings have a separation of 100 km. The ZR (reflectivity in dBZ and rainfall rate in mm/hour) relation in use for the radar is Z = 200∗ R1.6 .
depict a rainband that was tracking basically eastwards across Hong Kong between 3:30 p.m. and 8 p.m., bringing more than 60 mm of rain to many parts of the territory. Lightning flashes inside Hong Kong are found to be mainly associated with the radar echoes with a reflectivity of at least 44 dBZ at 3 km AMSL (equivalent to a rainfall rate of about 20 mm/hour based on the MarshallPalmer relation). The part of the radar echoes reaching this reflectivity has a typical width (along the direction of movement of the rain band) of around 20 km (Figure 9). The radiometer shows that, with the approach of the rainband to Hong Kong, the relative humidity increased gradually at all altitudes (Figure 10). It reached a maximum at around 2 km, where synoptically a fresh to strong southwesterly airstream brought relatively moist air from the South China Sea to the coast of southern China. The radiometer also gave a gradual decrease of the cloud-base height, which is consistent with hu-
man weather observations. During the period of heavy rain, the air was near saturation below 3 km or so, and the liquid water content had a maximum value of about 4.9 g/m3 . Please note that the liquid water content values may be biased due to rain contamination on the radiometer measurement. As the rainband moved away from Hong Kong, the relative humidity decreased and the cloud base lifted gradually after 11 UTC. The gradual rise of relative humidity at all altitudes as measured by the radiometer is a good indication of the imminence of heavy rain. Alternatively, it can be expressed in terms of the K-index calculated from the radiometer data (Figure 11). With the approach of the rainband to Hong Kong, K-index rose steadily. It exceeded 35 when heavy rain started to take place and the lightning flashes became active. After about 6:30 p.m., K-index began to fall, rain eased off gradually and there were no more lightning activities in the vicinity of the radiometer.
4.2 Correlation between k-index and lightning flashes K-index is a commonly used tool for assessing the chance of thunderstorms. Since radiosondes are normally available twice a day, the K-index calculated from
Meteorol. Z., 18, 2009
P.W. Chan: Intense convective weather
259
when the K-index calculated from the radiometer is at least 35; (b) the frequency of lightning flashes, which equals the total number of lightning flashes defined in (a) above divided by the period (in hours) when the K-index from the radiometer is at least 35.
Figure 11: K-index calculated from the radiometer data and the number of lightning flashes within 20 km from the radiometer in the afternoon of 17 April 2004.
Figure 12: Correlation coefficient between the temporally averaged K-index and the lightning activity (total number or frequency of lightning flashes) as a function of the range from the radiometer.
radiosonde measurements can only be used in the assessment for the next 12 hours or so, in the form of rules of thumb or flow charts in combination with other meteorological factors (e.g. C OLLIER and L ILLEY, 1994). The radiometer provides frequently updated temperature and humidity profiles of the troposphere for calculating K-index and offers a unique opportunity for a more quantitative study of the correlation between K-index and the degree of tropospheric instability, which is related to the occurrence of thunderstorms. During the field experiment, it was observed in many rain episodes that lightning flashes in the vicinity of the radiometer became more frequent when the K-index calculated from the radiometer data exceeded about 35 (as in the case of 17 April 2004, Figure 11). For each rain episode, a temporally averaged K-index for the period when K-index reaches 35 or above is calculated. Tropospheric instability is expressed in terms of the lightning flashes in the following ways: (a) the total number of lightning flashes within a certain range R from the radiometer during the period
The range R from the radiometer is varied between 10 km and 100 km for a statistical study of the correlation between the temporally averaged K-index from the radiometer and the tropospheric instability as defined in (a) and (b) above. The latter R limit is based on the maximum detection range of the lightning location network. The former one is chosen so that there is a reasonably large sample of cases (at least 10) for a statistical study. As R is reduced further, the number of rain episodes with lightning activity within R from the radiometer decreases dramatically. This paper focuses on the lightning activity associated with rainbands in the summer monsoon over southern China. There are altogether 11 cases. Rain episodes involving isolated thunderstorms (for instance, triggered by prolonged periods of solar heating over inland areas of southern China) are not considered. It is found that the correlation reaches a maximum at both R = 10 km and 20 km for lightning flash number, whereas it is the largest at R = 20 km for lightning flash frequency (Figure 12). The R value of 20 km is consistent with the radar observations of the spatial scale of the rainbands with active lightning (e.g. Figure 9). For both lightning flash number and frequency, the correlation with the temporally averaged K-index decreases as R exceeds 20 km. It starts to level at R = 60 km, as the lightning flash dataset for each rain episode is more or less exhausted. The scatter plots of the temporally averaged K-index against the logarithm of the lightning flash number and frequency within 20 km from the radiometer are shown in Figure 13. The correlation is relatively high, with a correlation coefficient of about 0.8. For the lightning flash number, the slope of the least-square linear fit is 1.183. That means, when the temporally averaged K-index is increased by 1, the number of lightning flashes within 20 km from the radiometer will on average increase by a factor of 101/1.183 = 7. Similarly, for the frequency of lightning flashes, the corresponding increase will be a factor of 101/1.276 = 6. Thus, the lightning activity appears to be rather sensitive to the value of K-index. The use of logarithmic scale for lightning activity follows the results in other studies (e.g. D EIER LING and P ETERSEN , 2008). As shown in Figure 13, the heavy rain episode on 8 May 2004 has the largest values of temporally averaged K-index and the total number of lightning flashes as well as the second highest frequency of lightning flashes among all the rain episodes considered. It is in fact the only episode in the rain season of Hong Kong in 2004 that necessitated the issuance of the ”black rainstorm
260
P.W. Chan: Intense convective weather
Meteorol. Z., 18, 2009
warning” by the Hong Kong Observatory, which means very heavy rain has fallen generally over Hong Kong, exceeding 70 mm in an hour. A meso-cyclone was observed to pass over the radiometer’s location (Cheung Chau), as analyzed in L I et al. (2004). It should be noted that the above analysis is based on a rather limited dataset (a total of 11 rain episodes) in the summer monsoonal season of a year only (2004). The robustness of the results is yet to be studied with a larger dataset. It has been shown in some studies (e.g. L ANG and RUTLEDGE, 2002) that lightning rate is related to updraft intensity of thunderstorms. The latter may be related to convective indices such as CAPE and KI. This may explain the correlation between lightning rate and KI as discussed above.
measurements. Besides determining the empirical constants from the least-square linear fit between GUSTEX and the actually measured wind gust from the surface anemometer stations, the upper bound GUmax and the lower bound GUmin of the wind gust estimate are also calculated. The relevant equations are summarized below:
5 Nowcasting of squall in intense convective weather
In equation (5.1), if L2max is less than 30, W I is taken as 0 and, from equations (5.3) to (5.5), GU = GUmax = GUmin in this case. In the present study, the zenith mode measurements by the microwave radiometer are used to retrieve the temperature and humidity profiles up to 10 km above ground. These profiles are then employed to determine the thermodynamic parameters in equations (5.3) to (5.5), such as the height of the melting layer, water vapour mixing ratio, lapse rate, etc. The only complication in this calculation is that the radiometer data are only available at fixed heights above ground, instead of fixed pressure levels. The height and the pressure are related using hydrostatic approximation. The maximum wind speed and the corresponding height above ground are obtained by considering the wind profiles from all the four radar wind profilers in Hong Kong (locations in Figure 1). At a particular moment, the maximum wind among the four profilers is selected in the calculation of GUSTEX as well as its upper and lower bounds. Please note the wind data at a particular height from radar wind profilers are obtained from a measuring volume about that height and averaged over a period (10 minutes in the configuration of the wind profilers in Hong Kong). On the other hand, wind data from the radiosonde are obtained in a much smaller sampling volume and nearly instantaneous in time.
The radiometer data are combined with wind measurements from the radar wind profilers in the nowcasting of squalls associated with intense convective weather. This section describes how the wind gust estimate (GUSTEX) is calculated and its application to some thunderstorm cases in Hong Kong.
5.1 Calculation of wind gust estimate GUSTEX is based on WINDEX developed in M C C ANN (1994). WINDEX is modified in G EERTS (2001) and L EE (2007), and given by: W I = 5[Hm Rq (L2max − 30 + ql − 2qm )]0.5
(5.1)
where W I is the WINDEX in knots, Hm is the height of the melting layer in km, Lmax is the maximum lapse rate from the ground to the freezing layer in K/km, ql is the mean mixing ratio of water vapour between the ground and 1 km above in g/kg, qm is the mixing ratio of water vapour at the melting layer in g/kg, and Rq = ql /12. GUSTEX also considers the downward transport of horizontal momentum in the upper air. It is modified in L EE (2007) and given by: GU = α1 W I + α2 ρUmax
(5.2)
where GU is GUSTEX in knots, Umax is the maximum wind speed between 900 and 500 hPa levels in knots, ρ = ρmax /ρ990 in which ρmax is the air density at the pressure level at which Umax occurs and ρ990 is the air density at 990 hPa level. α1 and α2 are constants to be determined empirically. In L EE (2007), the empirical constants in equation (5.2) were determined from the high wind gust cases at the Hong Kong International Airport between 2001 and 2005. The upper-air temperature, humidity and wind data were taken from the twice-daily radiosonde
5.2
GU = 0.12W I + 0.93ρUmax
(5.3)
GU max = 0.30W I + 0.93ρUmax
(5.4)
GU min = −0.05W I + 0.93ρUmax
(5.5)
Comparison between wind gust estimate and the actual gust measurements
The performance of the wind gust estimate determined from the above method (viz. radiometer and wind profiler data) is compared with the actually measured gust by the dense network of surface anemometers in Hong Kong in 14 thunderstorm episodes between March and June 2004. A thunderstorm episode is defined as a period of time (normally a few hours or more) in which thunderstorm has been reported by the weather observers at HKO Headquarters and/or Hong Kong International Airport. In general, the GUSTEX itself (eq. (5.3)) could underestimate the actual gust measurement at times. For
Meteorol. Z., 18, 2009
P.W. Chan: Intense convective weather
(a)
261
(b)
Figure 13: Scatter plots of the temporally averaged K-index against the number (a) and the frequency (b) of lightning flashes within 20 km from the radiometer. Dates of the rain episodes are marked nearby the data point (in the form of day/month).
(a)
(b)
Figure 14: (a) The scatter plot of the maximum gust estimated from microwave radiometer and radar wind profiler data against the largest value of the actually measured gust from the surface anemometer stations in the 14 thunderstorm episodes in 2004 of the current study. (b) is the corresponding scatter plot based on the maximum gust estimated from the radiosonde data. In (a) and (b), the outliers are encircled.
practical applications, the upper bound of wind gust estimate (equation (5.4)) may be more useful in giving the weather forecaster an idea about how large the gust could attain. As such, GUmax is considered in the comparison. The scatter plot of the maximum wind gust actually measured by the surface anemometers and the largest value of GUmax within an hour prior to the maximum gust occurrence for the thunderstorm episodes under study is given in Figure 14(a). The two datasets are found to have good correlation and the latter (GUmax ) is only larger than the former (actual gust) by about 20 % on average from the least-square linear fit. There are two outlier points in Figure 14(a) (encircled in red in the scatter plot). In both cases, the upper-air winds from the wind profilers are too strong, resulting in overestimation of the wind gusts. For comparison of performance, the corresponding scatter plot based on the GUmax estimated from radiosonde measurements is shown in Figure 14(b). In
this plot, the upper bound of GUSTEX determined from the radiosonde data just prior to the maximum gust occurrence is used, which could be as many as 12 hours earlier (because there are only two radiosonde ascents every day in Hong Kong with both wind and temperature/humidity profiles). Compared to the radiometer/wind profiler plot, the radiosonde plot has weaker correlation and on average the wind gust estimate is 63 % larger on average. There are also two outliers in Figure 14(b) (encircled in red in the scatter plot). In both cases, the upper-air winds measured by the radiosonde are too strong, resulting in over-estimation of the wind gusts. Overall speaking, the GUmax estimated from radiometer/wind profiler data has better performance than that based on radiosonde data and could be useful in the nowcasting of wind gust associated with intense convective weather with a lead time of about one hour.
262
P.W. Chan: Intense convective weather
(a)
Meteorol. Z., 18, 2009
(b)
(c) Figure 15: (a) and (b) are the 256-km radarscope images of Hong Kong at 3 km above mean sea level at 3:42 and 7:06 a.m., 8 May 2004 respectively. The range rings have a separation of 100 km. (c) is the time series of the largest value of the actually measured a wind gust from the surface anemometers (green), GUmin (blue), GU (red) and GUmax (brown).
5.3 Case studies Two convective weather cases within the study period in 2004 are discussed in detail in this Section to illustrate how to estimate wind gust based on radiometer data. The first case occurred on 8 May 2004. Synoptically, a strong southerly airflow between a westerly wave to the west of Hong Kong and the subtropical ridge to the east affected the Pearl River Estuary (location in Figure 15(a)) within the boundary layer. At 200 hPa, divergent flow occurred over the south China coast (location in Figure 15(a)) ahead of a deep westerly wave. From the 256km radarscope, bands of strong echoes with southwestto-northeast orientation moved across the Pearl River Estuary to affect Hong Kong. Thunderstorms were reported over the territory between 2 and 8 a.m. on that day. The first band of heavy rain affected Cheung Chau at about 3:42 a.m. (Figure 15(a)), bringing wind gust of 18.9 m/s, the largest over Hong Kong. The second band affected Waglan Island at about 7:04 a.m. (Figure 15(b)), bringing the maximum wind gust of 26.2 m/s.
The time series of maximum wind gust over the surface weather stations in Hong Kong in that morning as well as the GUSTEX, GUmax and GUmin are given in Figure 15(c). For the two events of the passage of strong radar echoes, the maximum wind gusts lie between the largest values of GUSTEX and GUmax within an hour prior to each event. As such, the wind gust estimates based on radiometer and wind profilers are considered to be useful in nowcasting the actual strength of the gusts. For the two strong gust events (∼3:42 a.m. and 7:04 a.m., 8 May 2004), the winds picked up gradually for a couple of hours before reaching the maximum values. The gradual strengthening of the winds was related to the approach of the rain bands. As the bands edged closer to Hong Kong, the southerly winds ahead of the bands strengthened gradually, which caused the winds recorded over the territory to become stronger. It is noted that, after the occurrence of squalls at the surface, the wind gust estimates may remain at rather high values, such as between 4 and 4:30 a.m. on 8 May 2004. This is because of the appearance of strong winds
Meteorol. Z., 18, 2009
P.W. Chan: Intense convective weather
(a)
263
(b)
(c) Figure 16: (a) and (b) are the 256-km radarscope images of Hong Kong at 3 km above mean sea level at 5:48 and 6:24 p.m., 17 April 2004 respectively. The range rings have a separation of 100 km. (c) is the time series of the largest value of the actually measured wind gust from the surface anemometers (green), GUmin (blue), GU (red) and GUmax (brown).
at the upper air after the passage of the squall near the surface. The strong winds may be related to midlevel inflow jet at the rear of the quasi linear convective system, or simply westerly jet streams in the middle troposphere which are commonly observed in heavy rain events over southern China. Their origin requires more detailed study, e.g. mesoscale analysis of the wind flow using a local analysis and prediction system, and microscale analysis of the airflow associated with the convective storm using multiple Doppler weather radar data. The second case occurred on 17 April 2004, which has been discussed in Section 4.1. On the 256-km radarscope, a band of intense echoes with north-northeast to south-southwest orientation moved across Hong Kong in the afternoon on that day. Thunderstorms were reported in Hong Kong at 5 and 6 p.m. At the times shown in Figures 16(a) and (b), high wind gusts were recorded at Cheung Chau (15.1 m/s) and Waglan Island (17 m/s) respectively. The time series of the highest wind gust in Hong Kong together with the various wind gust es-
timates are given in Figure 16(c). The largest values of GUSTEX and GUmax within an hour before the high wind gust events provide reasonable estimates on the gusts that could be attained. As in the previous case, after the occurrence of squalls at the surface, the wind gust estimates may remain at rather high values, such as after 6:30 p.m. on 17 April 2004. This is again because of the appearance of strong winds at the upper air after the passage of the squall near the surface.
6 Conclusion Performance and application of a multi-channel, groundbased microwave radiometer in intense convective weather is studied in this paper. The radiometer was equipped with a hydrophobic radome surface and a blower of heated air to mitigate the adverse effect of a rain-coated radome on the measurement accuracy. It was found to give reasonably accurate temperature and humidity profiles as well as precipitable water vapour
264
P.W. Chan: Intense convective weather
(PWV) with reference to the measurements from the radiosonde, a wind profiler/RASS and GPS receivers. However, some discrepancies between the data from the radiometer and the reference instruments were observed: (a) Temperatures from the radiometer showed a warm bias within the boundary layer. (b) Relative humidity profiles from the radiometer tended to show an elevated, moist layer at 3 to 4 km. This resulted in a generally larger K-index as compared with the value calculated from the radiosonde measurement. (c) Under continuous rain with a rate of 30 mm/hour or more, PWV from the radiometer exhibited rapid fluctuations that were not observed in GPS measurements, and the radiometer data appeared to be doubtful. Despite these discrepancies, the radiometer was found to provide useful information for rain nowcasting, e.g. increase in relative humidity at all altitudes, and the accumulation of water vapour in the lower troposphere. K-index was also calculated from the frequently updated temperature and humidity profiles from the radiometer for nowcasting purpose. Heavy rain with active lightning mostly occurred when K-index stayed above 35 or so. A temporally averaged K-index for the period when K-index was 35 or above was determined from the radiometer data. For the summer monsoonal rain in southern China, it was found to correlate well with the total number and the frequency of lightning flashes within 20 km from the radiometer (which was consistent with the radar observations of the spatial scale of the rainbands with active lightning). The lightning activity turned out to be rather sensitive to the K-index value: when K-index rose by 1, the number and the frequency of lightning flashes would increase by a factor of 7 and 6 respectively. Continuous availability of the temperature and humidity profiles of the troposphere from the radiometer enabled a quantitative study of the correlation between K-index and the atmospheric instability (expressed in terms of the lightning activity), which could not be achieved by using the twice-daily radiosonde measurements alone. Application of radiometer and radar wind profiler to the nowcasting of surface high gusts associated with intense convective weather was also studied. The GUSTEX originally developed for radiosonde data was adopted. Compared to the twice-daily balloon ascents, the continuous measurements of temperature, humidity and wind from the remote-sensing instruments better captured the rapid evolution of the troposphere in convective weather conditions. As such, the wind gust estimates so determined improved the correlation with the maximum gusts actually measured by the network of surface anemometer stations in Hong Kong. From two case studies of typical intense convection in the summer, the gust estimates were found to be useful in the nowcasting of high winds associated with thunderstorms.
Meteorol. Z., 18, 2009
The present study is based on the field experiment data of a ground-based microwave radiometer in Hong Kong in 2004 only. The amount of data involved is rather limited. A permanent unit of radiometer has recently been set up in Hong Kong and a larger set of data accumulated over the years would then be employed to evaluate the application of the microwave radiometer for operational use.
Acknowledgments The author would like to thank the Lands Department of the Government of the Hong Kong Special Administrative Region for providing the GPS receiver data in this study. The PWV data derived from GPS receivers are produced in a joint research project between the Hong Kong Observatory and the Hong Kong Polytechnic University. Thanks also go to China Light and Power Limited, which provides the lightning flash data from the lightning location network in Hong Kong. The comments from two anonymous reviewers are very much appreciated for improving the manuscript.
References C HAN , P.W., K.K. Y EUNG, 2003: Experimental extension of the measurement range of a boundary layer wind profiler to about 9 km. – Preprints, 12th Symposium on Meteorological Observation and Instrumentation, Amer. Meteor. Soc. C OLLIER , C. G., R.B.E. L ILLEY, 1994: Forecasting thunderstorm initiation in north-west Europe using thermodynamic indices, satellite and radar data. – Meteor. Appl. 1, 75–84. D EIERLING , W., W.A. P ETERSEN, 2008: Total lightning activity as an indicator of updraft characteristics. – J. Geophys. Res. 113, D16210, doi:10.1029/2007JD009598. F ELTZ , W.F., J.R. M ECIKALSKI , 2002: Monitoring hightemporal-resolution convective stability indices using the ground-based atmospheric emitted radiance interferometer (AERI) during the 3 May 1999 Oklahoma-Kansas tornado outbreak. – Wea. Forecast. 17, 445–455. G EERTS , B., 2001: Estimating downburst-related maximum surface wind speeds by means of proximity soundings in New South Wales, Australia. – Wea. Forecast. 16, 261–269. H EWISON , T., C. G AFFARD , J. NASH , D. RUFFIEUX , R. NATER , H. B ERGER , M. P ERROUD , B. A NDRADE , 2004: Monitoring inversions from ground-based remote sensing instruments during Temperature, Humidity, and Cloud profiling campaign (TUC). Preprints. – 8th Specialist Meeting on Microwave Radiometry and Remote Sensing Applications. K NUPP, K., R. WARE , D. C IMINI , F. VANDENBERGHE , J. V IVEKANANDAN , E. W ESTWATER , T. C OLEMAN , submitted: Ground-Based Passive Microwave Profiling during Dynamic Weather Conditions. – J. Atmos. Oceanic Technol. L ANG , T. J., S.A. RUTLEDGE , 2002: Relationships between convective storm kinematics, precipitation, and lightning. – Mon. Wea. Rev. 130, 2492–2506.
Meteorol. Z., 18, 2009
P.W. Chan: Intense convective weather
L EE , O.S.M., 2007: Forecast of strong gusts associated with thunderstorms based on data from radiosonde ascents and automatic weather stations. – 21st Guangdong - Hong Kong - Macao Technical Seminar on Meteorological Science and Technology, Hong Kong, China, 24–26 January 2007 (paper in Chinese with English abstract). L I , L.O., C.C. L AM , W.K. W ONG , 2004: The meso-cyclone over Hong Kong on 8 May 2004: Doppler radar observation and numerical simulation. Preprints. – International Conference on Mesoscale Convective Systems and Heavy Rainfall in East Asia (ICMCS-IV), Chinese Academy of Meteorological Sciences and China Meteorological Administration. L ILJEGREN , J., 2004: Improved retrievals of temperature and water vapor profiles with a twelve-channel radiometer. Preprints. – 8th Symposium on Integrated Observing and
265
Assimilation Systems for Atmosphere, Oceans, and Land Surface (IOAS-AOLS), Amer. Meteor. Soc. M C C ANN , D.W., 1994: WINDEX – A new index for forecasting microburst potential. – Wea. Forecast. 9, 532–541. M URPHY, M.J., K.L. C UMMINS , 2000: Early detection and warning of cloud-to-ground lightning at a point of interest. Preprints. – 2nd Symposium on Environmental Applications, Amer. Meteor. Soc. R ADIOMETER P HYSICS, GmbH, 2008: Operating manual of RPG-HATPRO. – available at www.radiometerphysics.de/rpg/html/Download Radiometer.html ROSE , T., H. C ZEKALA , 2003: Filter bank radiometers for atmospheric profiling. Preprints. – Sixth International Symposium on Tropospheric Profiling: Needs and Technologies, 261–263.