Complete Version: Performance Characteristics of Iterative Image Reconstruction T... Seite 1 von 20
Performance Characteristics of Iterative Image Reconstruction Techniques for Routine Use in Positron Emission Tomography.
Ludwig G. Strauss1, Dimitrakopoulou- Strauss1
George
Kontaxakis2,
Antonia
1 German Cancer Research Center, Heidelberg, Germany 2 Departamento de Ingeniería Electrónica, Universidad Politécnica, Madrid, Spain Correspondence Address: Prof. Dr. Ludwig G. Strauss Medical PET Group - Biological Imaging (E0105) Div. of Oncological Diagnostics and Therapy German Cancer Research Center Im Neuenheimer Feld 280 D-69120 Heidelberg, Germany Phone: +49 6221 42-2500 Fax: +49 6221 42-2476 email:
[email protected] Cita/Reference: Strauss, Ludwig G., et al. Performance Characteristics of Iterative Image Reconstruction Techniques for Routine Use in Positron Emission Tomography. Journal 3 (13): October 2001. http://www.alasbimnjournal.cl/revistas/13/rec.html
ABSTRACT The iterative image reconstruction (IIR) is a promising approach to achieve a better image quality in PET. However, limitations exist with respect to the required computation time and the influence of reconstruction parameters on quantitative PET data. We implemented different reconstruction algorithms in a PC based reconstruction program and evaluated the effect of the reconstruction algorithms as well as reconstruction parameters on the quantitative PET results. The following IIR algorithms were implemented: maximum likelihood expectation maximization (LMEM), weighted least squares (WLS), image space reconstruction algorithm (ISRA), space alternating generalized expectation maximization (SAGE). The ordered subsets (OS) method and the median root prior (MRP) correction were provided and can be used in combination with each reconstruction algorithm. A dynamic PET study, showing small liver metastases, was used for the evaluation of the properties of the reconstruction parameters. Regions-of-Interest (ROI) were placed in a small high uptake area as well as in a larger low uptake region for quantification purpose using standardized uptake values (SUV). The 128x128 image matrix was generally not suffient to detect the metastases as separate lesions and a 256x256 matrix was required for the delineation of the lesions. Furthermore, the use of the iterative attenuation correction
http://www.alasbimnjournal.cl/revistas/13/rectotal.html
26.10.2003
Complete Version: Performance Characteristics of Iterative Image Reconstruction T... Seite 2 von 20 improved the image quality significantly. The lesion detectability deteriorated when more than six iteration steps were used without applying the median root prior correction. In contrast, the median root prior correction improved the lesion detectability with a higher number of iteration steps. The quantitative evaluation of the hot lesion demonstrated a dependency of the uptake values on the number of iterations for all reconstruction methods. In contrast, the SUV of the low uptake area did not show a major variation with the number of iteration steps. Both convergence and noise reduction were improved when the median root prior correction was applied. All reconstruction algorithms showed an increase of the SUV and noise with higher number of subsets. The increase of the median root prior correction value (0.1 to 1.0) resulted in an decrease of the SUV in the hot area. Regarding reconstruction speed, image quality, and accuracy of quantitative data, best results were obtained with OSEM and OSISRA. The image quality of OSSAGE was comparable, but the reconstruction speed slower. OSWLS showed instable results with higher number of iterations. Based on our results, we prefer for routine PET studies the OSEM method, 8 iterations, 4 subsets, and median root prior correction with mrp=0.3.
key words: PET, iterative image reconstruction
Introduction Image reconstruction is one of the basic tasks in nuclear medicine to achieve a high image quality. The filtered backprojection (FBP) algorithm is one of the most commonly used procedures for the reconstruction of cross sections. The FBP is well known in computed tomography (CT) and provides generally an acceptable image quality. In contrast to radiological procedures, nuclear medicine studies deal with less information per projection as compared to radiological procedures like CT. Therefore, the FBP may result in images with limited quality. While the FBP algorithm is fast and images are obtained with short reconstruction times, limitations exist with respect to image quality, especially when high regional activity concentrations are present or in studies with low count rates. Besides the FBP technique, other approaches were applied for image reconstruction.Iterative image reconstruction techniques were introduced more than 10 years ago and have been found useful especially for positron emission tomography (1-2). However, limitations exist for the routine application of this technique due to the higher computational demand and the slow convergence of the algorithm. Therefore, the iterative reconstruction was mainly limited to major workstations and several attempts, including the implementation on parallel computer systems, were made to speed up the reconstruction task (3-5). Due to the availability of new, powerful PC systems, the iterative reconstruction can now be implemented on PC and used for routine patient studies. Furthermore, clustering or "semi-parallel"-processing of the reconstruction data may help to enhance the reconstruction process. We have recently published the design and implementation of a new PC based iterative reconstruction program, which is in use at our center for PET studies (6). The performance characteristics of the iterative reconstruction and the evaluation of the different reconstruction algorithms and parameters are presented in this paper. While phantom studies were already performed to evaluate the basic properties of the iterative reconstruction, we noted limitations when the results from phantom studies were compared to those obtained in patients. Respiration movement is usually present in PET studies of the whole body area and deteriorate the imageresolution. Furthermore, the effect of attenuation due to very different tissue structures and the influence of the different shapes of lesions as well as organs is difficult to simulate with phantoms. Therefore, a typical dynamic patient study was used to assess
http://www.alasbimnjournal.cl/revistas/13/rectotal.html
26.10.2003
Complete Version: Performance Characteristics of Iterative Image Reconstruction T... Seite 3 von 20 the reconstruction parameters which are important for PET patient studies.
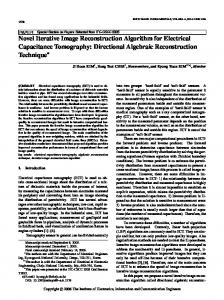
Material and Methods An ECAT HR+ PET system (Siemens CTI Co., Erlangen, Germany) is available for PET patient studies. The system provides 63 slices within a 15.5 cm axial field of view. There are 576 detector crystals per ring with a crystal size of 4.39x4.05x30 mm. The 82944 lines of response per plane are usually reduced by a standard angular compression factor of two. Typically, 23 frames are acquired for 60 minutes following the intravenous injection of F-18-deoxyglucose (FDG). A total of 1449 cross sections (23 frames x 63 cross sections) are reconstructed from one dynamic series. Besides a dynamic acquisition, static acquisitions are usually performed at 1-3 additional bed positions. Generally, transmission measurements (10 min for the dynamic series, 5 min for each additional static acquisition) preceded all emission acquisitions. A subnet of PC systems running Windows 2000 professional server and Windows 2000 professional (Microsoft Co., Redmond, USA) are used for PET data processing.
Fig. 1a: System diagram for the processing of PET patient studies. The acquired PET data are transferred to a subnet server. The reconstruction program is running in the background on one or more PC clients of the subnet. Reconstruction tasks are initiated via the web and stored on the subnet server. Each reconstruction program checks the subnet server at a constant time interval for new tasks. The reconstructed images are stored on th subnet server and evaluated on PCs within the local net.
http://www.alasbimnjournal.cl/revistas/13/rectotal.html
26.10.2003
Complete Version: Performance Characteristics of Iterative Image Reconstruction T... Seite 4 von 20 Currently three double processor systems and ten single processor computers are available within the PET subnet and used for image reconstruction as well as qualitative and quantitative data evaluation. The acquisition data are transferred from the PET system to the subnet server using the file transfer protocol (ftp). The program for the iterative image reconstruction is written in C (Visual C++ 6.0, Microsoft Co., Redmond, USA) and is running as a background job on PC systems within the PET subnet (6). Each active reconstruction program is checking the subnet server for new reconstruction tasks at a one minute interval. The reconstruction parameters are provided using a javascript form on the subnet server, which is accessible for PCs within the local area network (LAN) via a standard browser.
Fig. 1b: Web form used for the input of the reconstruction task parameterss.. The form is available on all PC clients within the subnet. The reconstruction parameters like matrix size, frames, and slices to reconstruct, reconstruction algorithms, subsets, etc. can be selected by the physician for each individual data acquisition. The parameters are submitted to the subnet server and are available for the reconstruction programs. The main advantage of the web form is the easy selection of all parameters, which are important for image reconstruction (matrix size, selecting images/frames for reconstruction, adding images/frames, iteration steps, subsets, normalization factor, filtering, etc.). The reconstruction program provides the page 7 following four iterative reconstruction algorithms: · maximum likelihood expectation maximization (MLEM) (7) · weighted least squares (WLS) (8) i
http://www.alasbimnjournal.cl/revistas/13/rectotal.html
26.10.2003
Complete Version: Performance Characteristics of Iterative Image Reconstruction T... Seite 5 von 20 · mage space reconstruction algorithm (ISRA) (9-10) · space alternating generalized expectation maximization (SAGE) (11)
Each algorithm can be used together with the ordered subsets (OS) method in order to enhance the reconstruction speed (12). Furthermore, based on the approach of Green, the median root prior (MRP) method as described by Alenius et al. is implemented as an option for all reconstruction methods (13-15). Attenuation correction can be performed either with the attenuation correction files provided by the PET system or an iteratively reconstructed attenuation correction map, using the MLEM algorithm with 5 iterations, 128*128 matrix, and mrp=0.3. We have had used phantom studies to optimize the reconstruction program. Furthermore, phantom studies are also used on a regular basis to check the system quality. However, several effects like respiration movement, tissue heterogeneity and the irregular shape of organs and structures are difficult to simulate with phantoms, but are important for the optimization of the reconstruction method for routine clinical use. Therefore, we selected a standard dynamic FDG patient study to evaluate the properties of the reconstruction program. The injected dose of FDG is generally calculated according to the individual body weight. Furthermore, the plasma glucose level is checked in each patient immediately prior to the FDG application. According to our experience, the shape of the liver FDG uptake curve does show little variation in most of the patients, provided that diabetic patients are excluded from the examination. However, differences usually exist for malignant lesions due to treatment, histology, size of the lesions, etc. Furthermore, attenuation may differ according to the individual body shape, resulting in a large variation of the PET image quality, which may limit the quantitative assessment. Being aware about these parameters, we selected a routine patient study demonstrating two adjacent, small liver metastases. The original acquisition data were reconstructed with all four algorithms and different reconstruction parameter settings. The performance of the reconstruction algorithms and the effect of different reconstruction parameters on the high and low uptake areas were quantitatively evaluated. A dynamic study of a patient with two small metastases (diameter 7-8 mm according to ultrasound) in the ventral part of the right liver lobe due to a colorectal carcinoma was selected to assess the performance characteristics of the iterative image reconstruction. The PET examination was performed for diagnostic purpose prior to chemotherapy to assess the metabolic activity of the malignant lesions already detected with ultrasound. Following positioning of the patient, a transmission scan was performed for ten minutes.The patient had a body weight of 70 kg and received 262 MBq FDG immediately following transmission scanning without repositioning of the patient. The blood glucose level was checked prior to tracer injection and was within the normal range. The standard dynamic PET FDG acquisition protocol was used, comprising 23 frames with 10x60 sec, 5x120 sec, and 8x300 sec. Sixty-three cross sections with an image matrix of 256*256 pixel are reconstructed per frame. The theoretical slice thickness is 2.425 mm per slice and comparable to the theoretical pixel size (2.277 mm) in the cross section. The image reconstruction settings used for the routine patient FDG study evaluation at our center includes the reconstruction of a summed frame, comprising the last four frames of the dynamic series, covering the time interval from 40-60 min post tracer application. This summed frame of the 40-60 minute time interval is routinely used from the physicians for the qualitative and quantitative evaluation, besides the quantitative assessment of the whole dynamic series. We selected one cross section from the summed frame, which demonstrates both small liver metastases. All four iterative reconstruction algorithms and different parameter settings for subsets, MRP, etc. were applied to the data. Regions-of-interest (ROIs) were placed in the cross section for one of the two page 9 metastases (9 pixel) and for the normal liver parenchyma (425 pixel) using a dedicated data analysis program (16-17).
http://www.alasbimnjournal.cl/revistas/13/rectotal.html
26.10.2003
Complete Version: Performance Characteristics of Iterative Image Reconstruction T... Seite 6 von 20
Fig. 2: PET cross section (theoretical voxel size 2.277x2.277x2.425 mm) of a patient with two small liver metastases due to a colorectal carcinoma. The image is summed from a dynamic study and reflects the time interval from 40-60 min following FDG administration. Regions-of-Interest (ROI) are used for the quantitative evaluation. Blue: ROI for the normal liver parenchyma; red: ROI for the metastasis. The total number of counts was 6550055 for the slice used for the data evaluation. Mean, standard deviation, and noise (percentage of standard deviation) were calculated from the ROIs following iterative reconstruction of the cross section with different reconstruction algorithms and parameter sets.
Results Both metastases are visible as a single hot area when the 128x128 image matrix is used for PET image reconstruction, but they can not be delineated as separate lesions (Fig. 3a). The OSWLS method provides a slightly lower image quality regarding the delineation of the lesion in comparison to the other reconstruction procedures when the 256x256 matrix is used (Fig. 3a).
Fig. 3a.Reconstruction of the cross section with four different reconstruction algorithms and two different matrix sizes. Four subsets, six iteration steps and mrp=0.3 were used for all algorithms. The two small metastases in the
http://www.alasbimnjournal.cl/revistas/13/rectotal.html
26.10.2003
Complete Version: Performance Characteristics of Iterative Image Reconstruction T... Seite 7 von 20 ventral part of the liver are shown as separate lesions only with the 256x256 image matrix (lower row). The separation of the lesions was best for OSEM, OSISRA, and OSSAGE, while the image quality was slightly lower for OSWLS. The effect of attenuation correction was evaluated using the correction data provided by the PET system as well as an iteratively reconstructed attenuation map, based on the originally acquired transmission data (Fig.3b). We noted for all four reconstruction methods artefacts in areas with high attenuation, which limit both the qualitative and quantitative assessment of the image.
Fig. 3b Reconstruction of the cross section with four different reconstruction algorithms and two different attenuation correction maps. Four subsets, six iteration steps and mrp=0.3 were used for all algorithms. Upper row: the attenuation map created from the PET system software was used for correction. Lower row: the attenuation map was iteratively calculated from the transmission data (MLEM, 5 steps, mrp=0.3, 128x128 matrix). The two small metastases in the ventral part of the liver are shown as separate lesions only when the iteratively calculated attenuation map was used. The differentiation of the lesions was best for OSEM, OSISRA, and OSSAGE, while the image quality was somewhat lower for OSWLS. Furthermore, the detectability of the liver metastasis was limited using the system based attenuation data, especially for the OSISRA and OSWLS method (Fig: 4b, upper row). In contrast, the image quality was significantly improved for all reconstruction procedures when the iteratively reconstructed attenuation map was used for the correction of the emission data (Fig. 4b, lower row).
http://www.alasbimnjournal.cl/revistas/13/rectotal.html
26.10.2003
Complete Version: Performance Characteristics of Iterative Image Reconstruction T... Seite 8 von 20
Fig 4b.PET cross section (theoretical voxel size 2.277x2.277x2.425 mm) of a patient with two small liver metastases due to a colorectal carcinoma. The image is summed from a dynamic study and reflects the time interval from 40-60 min following FDG administration. The iterative reconstruction was performed with four subsets, 256*256 matrix, and with the use of the median root prior correction (mrp=0.3).The two lesions are identified as separate lesions when 3-12 iterations were used. The increase of the noise with higher numbers of iterations is lower as compared to the images without using mrp (Fig. 4a). The visual evaluation of the four different reconstruction algorithms demonstrates that the two metastases are visualized clearly as separate lesions even after three iteration steps for all reconstruction methods when an image matrix of 256*256 pixel and four subsets were used (Fig. 4a). However, the image quality was rapidly deteriorating when the number of iteration steps was increased without applying the median root prior correction to the data (Fig. 4a). The two metastases were not detectable when 12 iterations and OSEM were used for reconstruction (Fig. 4a, lower row, left). The image quality was slightly better for the three other reconstruction algorithms (Fig. 4a, lower row).
http://www.alasbimnjournal.cl/revistas/13/rectotal.html
26.10.2003
Complete Version: Performance Characteristics of Iterative Image Reconstruction T... Seite 9 von 20
Fig 4a.PET cross section (theoretical voxel size 2.277x2.277x2.425 mm) of a patient with two small liver metastases due to a colorectal carcinoma. The image is summed from a dynamic study and reflects the time interval from 40-60 min following FDG administration. The iterative reconstruction was performed with four subsets, 256*256 matrix, but without using the median root prior correction. The two lesions are identified as separate lesions when 3 iterations were used. Significant increase of the noise for all reconstruction algorithms with increasing number of iterations, which deteriorates the detection of the metastatic lesions. In contrast, the use of the median root prior correction with mrp=0.3 resulted in an acceptable image quality for all four reconstruction methods when at least 3 iteration steps were used for reconstruction (Fig. 4b). The visual analysis demonstrated no further improvement when more than 3-6 iteration steps were used for image reconstruction, provided that the mrp is applied to the data. While the two small metastases were noted as separate lesions for OSEM, OSISRA, and OSSAGE when twelve iteration steps were used, the image quality was slightly lower for the OSWLS method regarding the delineation of the lesions (Fig. 4b, lower right). The total number of iterations was changed from 1-32 for the four reconstruction methods and the SUV as well as the noise of the data were calculated for the metastasis and the normal liver parenchyma (Tab. 1a-d). The number of iterations was set to six and the 256x256 matrix was used for reconstruction. Using the SUV of the metastasis with 32 iterations for reference, 90 % of this value was achieved within 10 iterations for OSEM, OSISRA, and OSSAGE without using the median root prior correction (Tab. 1a). The convergence was best for OSWLS, the 90 % value was achieved within 5 iterations. All methods demonstrated a fast convergence within 2-3 iteration steps for the normal liver parenchyma (Tab. 1a). Using a 1 % difference to the SUV with 32 iterations, 18-24 iterations must be used for all reconstruction methods (Tab. 1a). However, no real plateau phase was achieved for the metastasis when the median root prior correction was not
http://www.alasbimnjournal.cl/revistas/13/rectotal.html
26.10.2003
Complete Version: Performance Characteristics of Iterative Image Reconstruction... Seite 10 von 20 used. We noted oscillating SUV for the low uptake area and the values did not achieve a constant level (Tab. 1a).
Table 1a: SUV of the metastasis and the normal liver parenchyma for the four different reconstruction algorithms using 1-32 iterations, four subsets and the 256*256 image matrix. The theoretical pixel size is 2.277*2.277*2.425 mm. The median root prior correction was not applied to the data. The results show that the SUV for the metastasis does not achieve a plateau phase even after 32 iterations. The SUV values of the low uptake area are oscillating and do not achieve a constant value.
In contrast, the convergence was improved for the metastasis as well as for the normal liver parenchyma when the median root prior correction was applied and now the 90 % value was achieved within 3-5 iterations (Tab. 1b).
Table 1b: SUV for the metastasis and the normal liver parenchyma for the four different reconstruction algorithms using 1-32 iterations, four subsets and the 256*256 matrix. The theoretical pixel size is 2.277*2.277*2.425 mm. The median root prior correction was applied to the data using mrp=0.3. In contrast to tab. 1a, the convergence was significantly improved for both the high and low uptake area. However, unstable results were obtained with OSWLS and more than 12 iterations. Even for a 1 % difference to the SUV with 32 iterations, only 10-12 iterations are required (Tab. 1b). While the results are comparable for OSEM, OSISRA, and OSSAGE, we noted unreliable results for the OSWLS method when more than 12 iterations and four subsets were used for reconstruction. A plateau phase was observed for OSEM, OSISRA, and OSSAGE for the SUV of the metastasis and the liver parenchyma. The noise was calculated form the standard deviation and the mean SUV (Tab. 1c,d). The data show a rapid increase of the noise with higher numbers of iterations when the median root prior correction was not used (Tab. 1c).
http://www.alasbimnjournal.cl/revistas/13/rectotal.html
26.10.2003
Complete Version: Performance Characteristics of Iterative Image Reconstruction... Seite 11 von 20
Table 1c: The noise (%) was calculated from the mean and standard deviation of the ROIs. The reconstruction parameters are equal to those used for tab. 1a. The results demonstrate a rapid increase in the noise level when more iterations were used and the median root prior correction was not applied to the data. In contrast, we noted an improvement by a factor of 2-3 when the median root prior correction was applied to the data (Tab. 1d). The best noise reduction was observed for OSWLS (Tab. 1d)
Table 1d: The noise (%) was calculated from the mean and standard deviation of the ROIs. The reconstruction parameters are equal to those used for tab. 1b. The results demonstrate a reduction of the noise level when the median root prior correction was applied to the data. The effect of different values for the mrp correction was assessed using 6 iterations and four subsets for all methods (Fig. 5a). Generally, the mean SUV in the liver parenchyma was not dependent on the mrp value when OSEM, OSISRA, or OSSAGE were used, while a constant decrease of the SUV was observed for the metastasis (Fig. 5). The difference of the SUV with mrp=0.3 and mrp=0.8 was less than 10 % for OSEM, OSISRA, and OSSAGE, but 22.8 % for OSWLS (Fig. 5a).
http://www.alasbimnjournal.cl/revistas/13/rectotal.html
26.10.2003
Complete Version: Performance Characteristics of Iterative Image Reconstruction... Seite 12 von 20
Fig 5aReconstruction parameters: 6 iterations, 4 subsets, 256*256 matrix. The quantitative assessment of the tracer uptake in the liver metastasis and the normal liver parenchyma demonstrates no impact of the mrp on the SUV of the normal liver parenchmya. The OSISRA provided lower uptake values for the liver parenchyma as compared to the other procedures. The OSWLS results were comparable to the other methods when the mrp was less than 0.5, while a major decrease of the uptake was observed for mrp>0.5. The use of ordered subsets may be helpful to decrease the overall reconstruction time. However, we noted a dependency of both mean SUV and noise on the number of subsets for the metastasis as well as the normal liver parenchyma (Fig. 5b,c). The OSWLS provided unstable results when more than 4 subsets were used. When ordered subsets are used for reconstruction, we can keep the product "number of iteration steps * number of subsets" constant. Interestingly, we noted an increase of the mean SUV for the liver metastasis when the number of iteration steps was low and the number of subsets was increased (Fig. 5d). Furthermore, the noise was generally higher for both the metastasis and the normal liver parenchyma when the number of subsets was increased and less iterations were used (Fig. 5e). In contrast to OSEM, OSISRA, and OSSAGE, the OSWLS method showed only for 8 subsets and 3 iteration steps a major increase of the noise (Fig. 5e).
http://www.alasbimnjournal.cl/revistas/13/rectotal.html
26.10.2003
Complete Version: Performance Characteristics of Iterative Image Reconstruction... Seite 13 von 20
Fig. 5b Reconstruction parameters: 6 iterations, mrp=0.3, 256*256 matrix. While the uptake values were nearly constant with higher numbers of subsets for the normal liver parenchyma, an increase of the SUV was observed for the liver metastasis. OSWLS provided unstable results with more than 4 subsets.
Fig. 5c. Reconstruction parameters: 6 iterations, mrp=0.3, 256*256 matrix. The noise was increasing with higher numbers of iterations for both the normal liver parenchyma and the metastasis. Best results were obtained with OSSAGE. OSWLS provided unstable results with more than 4 subsets.
http://www.alasbimnjournal.cl/revistas/13/rectotal.html
26.10.2003
Complete Version: Performance Characteristics of Iterative Image Reconstruction... Seite 14 von 20
Fig. 5d. Reconstruction parameters: mrp=0.3, 256*256 matrix. The product "number of iterations * number of subsets" was kept constant at 24. While the uptake values were constant for the normal liver parenchyma, an moderate increase of the SUV was observed for the liver metastasis.
Fig 5e. Reconstruction parameters: mrp=0.3, 256*256 matrix. An increase of the noise was observed for both the normal liver parenchyma and the metastasis. Benchmarks were performed on different PC systems running with Windows 2000 professional for the four reconstruction methods (Tab. 2).
http://www.alasbimnjournal.cl/revistas/13/rectotal.html
26.10.2003
Complete Version: Performance Characteristics of Iterative Image Reconstruction... Seite 15 von 20
Table 2: Performance characteristics of the iterative reconstruction program. Pentium III systems were used for testing. The following parameters were used for all reconstructions: 6 iterations, 4 subsets, mrp =0.3. One frame includes 63 slices, one study consists of 23 frames, resulting in 1449 slices for one dynamic patient study. The memory usage, which was 85 MB for the 256*256 matrix, requires at least 128 MB memory. Smaller systems may be considered if the 128*128 matrix is primarily used for reconstruction. The time per iteration was significantly longer for OSSAGE due to the pixel update procedure. In general, a typical dynamic FDG study, including 23 frames for 60 minutes (1449 slices) is reconstructed within less than 3 hours when a Pentium III with 700 MHz is used. The software supports semi-parallel processing, so several PET patient studies may be processed on several PC systems simultaneously. Besides the use of the reconstruction program on Windows systems, the reconstruction program was also compiled on a Linux system (SuSE 6.2, SuSE GmbH, Nürnberg, Germany) as well as on a system running BeOS (V4.5, Be Inc., Menlo Park, CA, USA) using the standard compiler program provided with the system software. In general, the time per iteration was longer as compared to the Windows 2000 professional system on the same Pentium III with 600 Mhz (OSEM: Linux: 5.6 sec/iteration, BeOS: 6.5 sec/iteration Windows 2000 professional: 1.35 sec/iteration).
Discussion PET provids usually superior information with regard to image resolution and quantification of radionuclide concentrations as compared to conventional nuclear medicine procedures. However, the reconstruction of cross sections may limit these advantages due to significant image artefacts. The filtered backprojection algorithm is widely used because of the fast image reconstruction, but it may provide limited image quality when the total number of counts is low or regional high activity concentrations are present in the field of view. Therefore, problems may raise especially for the diagnosis of small liver metastases or for the evaluation of recurrent colorectal malignancies, when the retrovesical space must be evaluated (18-19). It is standard that PET reconstruction algorithms are accurately analyzed and optimized using phantom measurements. Besides for program development, we are using phantoms on a regular basis to check homogeneity, spatial resolution, and the accuracy as well as the reproducibility of radionuclide concentration measurements. However, the effects of inhomogenous activity distributions, respiration movement, attenuation, irregular shape of organs and lesions, etc. Are difficult to evaluate if only phantoms are used. One critical aspect of the PET application in oncology is the detection of small malignant lesions, especially within the liver parenchyma. Therefore, we used a patient study to evaluate the reconstruction algorithms with respect to lesion detection and tracer quantification.
http://www.alasbimnjournal.cl/revistas/13/rectotal.html
26.10.2003
Complete Version: Performance Characteristics of Iterative Image Reconstruction... Seite 16 von 20 The visual assessment of the reconstructed images demonstrates, that an image matrix of 256x256 pixel is required to delineate the small metastases as separate lesions (Fig. 3a). Furthermore, the iterative reconstruction of the attenuation correction map improved the image quality (Fig. 3b). Limited data are available in the literature about the parameters for image reconstruction, which may determine the lesion detectability. Palmedo et al. used PET with FDG in patients with breast cancer and report false negative results in recurrent tumors with a diameter of less than 9 mm (20). In contrast, Crippa et al. used PET with FDG in 86 patients with breast tumors and detected even 15 small tumors with less than 10 mm using attenuation corrected images and a 256x256 matrix (21). The results show that lesion detectability is dependent on a variety of factors, including the PET system, acquisition parameters, and reconstruction techniques. Lonneux et al. compared the filtered backprojection method with the iterative image reconstruction based on OSEM and found that the sensitivity for tumor detection was comparable for non-corrected and attenuation corrected whole body images, while image quality was improved when the iterative reconstruction method was used for both attenuation and emission data (22). Our data show that the iterative reconstruction of both, attenuation map and emission data, is the preferential approach to achieve the best image quality. Furthermore, because the quantification of FDG kinetics is primarily used for the diagnostics in oncological patients at our center, iterative attenuation correction is mandatory for all examinations to achieve a superior image quality for the quantitative data analysis. Besides image matrix and attenuation correction, other parameters are from importance for the iterative image reconstruction. Wang et al. evaluated the performance of the filtered backprojection technique and the iterative reconstruction with the ML and maximum- a-posteriori reconstruction in a simulation model (23). The authors noted the best image quality for 30 iteration steps. Doll et al. used the MLEM method to reconstruct cross sections following Fourier rebinning of 3D sinograms and emphasized that a sufficient quantitative error of less than 5% demands 50 iteration steps (24). The number of iteration steps is generally lower when the ordered subsets method is used and the product interactions steps*number of subsets is generally comparable to the number of iteration steps without using the ordered subsets method. According to our data, the selection of the number of iteration steps is critical and must be carefully adjusted between 3-6 iterations to detect and differentiate the small liver metastases, when the standard OSEM method is used and the median root prior correction is not applied to the reconstruction data (Fig. 4a). The loss in the detectability of small lesions with a higher number of iteration steps was nearly equal for the four reconstruction methods. In contrast, the use of the median root prior correction resulted in a more stable image quality with respect to the number of iterations (Fig. 4b). Interestingly, the visual analysis demonstrated no major improvement when more than 3-6 iteration steps were used for reconstruction (Fig. 4b). Knesaurek et al. evaluated an attenuation corrected iterative image reconstruction method using phantoms and was able to visualize hot spots with a diameter of at least 4.7 mm when six iteration steps were used for reconstruction (25). Convergence, as assessed by a cost function, was achieved within 3 iteration steps, while a tendency to diverge was observed when more than 15 iterations were used (25). Based on our quantitative data as well as the visual assessment, stable results were achieved only with the use of the MRP correction (Fig. 4b), while the noise was deteriorating the image quality without the use of MRP (Fig. 4a). Alenius evaluated the properties of the MLEM and the MRP correction in his thesis in detail (15). The author emphasize, that MLEM images with a higher number of iteration steps suffer from a high noise level (15). On the other hand, if only a small number of iterations are used, the image is less noisy but the quantitative level of pixel values are biased towards the initial starting image. The use of the MRP correction resulted in low noise levels even with a high number of iterations (15). Our data support the results of Alenius and demonstrate, that especially for small liver
http://www.alasbimnjournal.cl/revistas/13/rectotal.html
26.10.2003
Complete Version: Performance Characteristics of Iterative Image Reconstruction... Seite 17 von 20 metastases the use of the MRP correction provides a superior image quality. Based on these data, the median root prior correction is recommended to limit the dependency on the number of iteration steps. The quantitative assessment of PET images necessitates attenuation correction. However, to achieve reproducible results, it is important to analyze the dependency of the SUV on the image reconstruction parameters. Alenius and Ruotsalinen evaluated the dependency of the pixel value on the number of iterations and they showed that even with more than 200 iterations the image maximum is continuously increasing with the number of iterations using MLEM without MRP correction, while the pixel value approached a constant value for more than 100 iterations when the MRP correction was used (14). The authors emphasize, that the quantitative result was not sensitive to the number of iterations when the MRP method was applied to the data. Our data evaluation was limited to a maximum of 32 iterations and four subsets, which is equivalent to 128 MLEM iterations when the ordered subsets method is not used (Tab. 1). Interestingly, the SUV in the high uptake are were continously increasing with higher number of iterations, while the SUV was oscillating in the low uptake area when the median root prior correction was not used (Tab. 1a). In contrast, the convergence was significantly improved using the mrp correction and a difference of less than 1 % of the final value (with 32 iterations, four subsets) was achieved within 10-12 iterations using four subsets with all four reconstruction methods, demonstrating a good performance of the MRP method (Tab. 1b). The convergence was even better for the low uptake area (Tab. 1b). Besides the average uptake value, the dependency of the noise on the number of iterations and the reconstruction method is important for quantitative PET. We noted a significant decrease of the noise when the MRP correction was used. Furthermore, the noise level was nearly constant following 12 iterations and comparable for all four reconstruction methods (Tab. 1d). Seret used the MRP procedure together with the OSEM method and showed that in phantoms the standard deviation in a large ROI was increasing with the product "number of iterations * number of subsets" when the MRP correction was not applied to the data, while nearly constant values were achieved with a product of less than 50 (26). Our results show, that particularly for small hot lesions the improvement by the use of the MRP method is helpful to obtain accurate and reproducible quantitative data. The evaluation of the quantitative data revealed that acceptable convergence was achieved within 10 iteration steps for all reconstruction methods, provided that the MRP was used (Tab. 1b). The convergence was slightly faster for the OSWLS method. Furthermore, the noise was lowest and therefore the contrast improved for OSWLS (Tab. 1d), which is in accordance to the findings of Anderson et al. (8). The authors examined the weighted least squares as well as the MLEM algorithm using simulation experiments and found both a faster convergence and better contrast for the WLS method (8). However, taking into account the qualitative assessment of the cross sections, we feel that OSWLS provides a somewhat lower image quality with respect to the differentiation of the two metastases (Fig. 4b). According to our results, 6-10 iteration steps and the use of OSEM provides a good compromise between convergence, noise level, and image quality. Alenius et al. introduced the median root prior method in 1997 and showed that this correction procedure helps to overcome the iteration step problem (14-15). The authors recommend an MRP factor of 0.3 to optimize noise reduction and keep resolution. It was noted that noise suppression was not sufficient for MRP less than 0.2. The maximum image value was slightly lower for a high MRP of 0.9 as compared to MRP=0.3. We noted a change of less than 10 % when the MRP was varied from 02. to 0.8 for OSEM, OSISRA, and OSSAGE (Fig. 5a). However, OSWLS was more sensitive to changes of the MRP value, so the MRP must be carefully selected when the OSWLS is used for image reconstruction (Fig. 5). In contrast, the change of
http://www.alasbimnjournal.cl/revistas/13/rectotal.html
26.10.2003
Complete Version: Performance Characteristics of Iterative Image Reconstruction... Seite 18 von 20 the MRP value was without any significant effect on the SUV when the low uptake area of the normal liver parenchyma was evaluated. Generally, the use of a higher number of subsets is preferable to achieve the shortest reconstruction time. However, we were able to show a constant increase of the SUV in the metastasis and no major change for the low uptake area when MRP=0.3 was used and the number of subsets was changed from 0 to 32 (Fig. 5b), while the noise was increasing for both the metastasis and the normal liver parenchyma (Fig. 5c). Seret evaluated the median root prior for the OSEM method with regard to the number of subsets and recommend the use of 4-8 subsets to obtain optimal results (23). Based on our data, we prefer four subsets to limit the increase of the noise and to gain some acceleration in comparison to the MLEM method. The use of a constant number of subsets is especially important for PET follow up studies to achieve comparable SUV measurements. We like to emphasize that SUV measurements in hot areas are not comparable when a fixed number of iterations, but different numbers of subsets are used for the PET studies. Some kind of "normalization" may be achieved when the product of the number of iterations and subsets is kept constant (Fig. 5d). However, with respect to noise we like to recommend the use of a maximum of four subsets. Performance is one of the major limitations of the iterative image reconstruction methods in comparison to the filtered backprojection. Limited information is available in the literature about the time required to reconstruct PET cross sections. Due to the different iterative reconstruction algorithms and the large variation of the hardware, it is difficult to compare benchmark tests. The results obtained on PC systems show, that 1-2 seconds are needed to perform one iteration (with four subsets) when OSEM, OSISRA, or OSWLS are used, while 2-3 seconds are required for the OSSAGE method (Tab. 2). OSSAGE demands nearly twice the time of the other algorithms, because OSSAGE reprojects the image vector to the data space after each pixel update during one iteration, resulting in a longer reconstruction time. The qualitative and quantitative evaluation gave no evidence for significantly better results with the OSSAGE method as compared to OSEM. Passeri et al. used the iterative reconstruction algorithm to reconstruct SPET images (4). The authors implemented the reconstruction program on a 64-node Cray T3D and report, that 30 slices were reconstructed in 9 seconds using the 64x64 matrix, 90 projections and 10 iterations (4). Extrapolating these data to the 256x256 matrix would result in approximately 0.5 sec/iteration as compared to 1-2 sec/iteration for our PC based program, demonstrating a good performance of the PC based reconstruction in comparison to the reconstruction on the Cray T3D, if the PC is exclusively used for image reconstruction. Toft et al. implemented three iterative reconstruction algorithms on PC systems and report a reconstruction time of 0.85 sec/iteration when a 101x101 matrix was used, which is comparable to 2.16 sec/iteration for the 256x256 matrix (3,27). Interestingly, the author report an improvement only by a factor of two when a workstation (Onyx, Silicon Graphics Co., Mountain View, CA, USA) was used instead of a PC. We feel that the results from Toft et al. as well as our data direct to a good cost/effectiveness of the PC based image reconstruction as compared to workstations or even parallel processing systems. It should be noted that the reconstruction process can be enhanced further if multiprocessor systems and/or several computers are used for image reconstruction. The software is written as a stand-alone program running on distributed PC systems, so the number of PCs performing image reconstruction is only limited by the subnet size. We are currently using two double processor systems routinely for image reconstruction and four reconstruction tasks are performed simultaneously. Therefore, the dynamic FDG data of four patients are reconstructed within 3-4 hours (Tab. 2). A typical whole body study with 5 bed positions is reconstructed within 35-45 minutes, so most of the images are already available when the patient leaves the PET room (Tab. 2). Further improvement can be expected with the new Pentium 4 based systems.
http://www.alasbimnjournal.cl/revistas/13/rectotal.html
26.10.2003
Complete Version: Performance Characteristics of Iterative Image Reconstruction... Seite 19 von 20 Based on our data, we like to conclude that the iterative image reconstruction should find preferential use for PET studies. The use of the OSEM method, with 6-10 iterations, four subsets, MRP=0.3, and an iterative attenuation correction is a good compromise for the reconstruction of PET cross sections. The number of subsets should be kept constant, because it is a critical parameter for quantitative PET studies.
Literature 1. Schmidlin P, Kübler WK, Doll, J, Strauss, LG, Ostertag H. Image processing in whole body positron emission tomography. In: Schmidt HAE, Csernay L, eds.Nuklearmedizin. Stuttgart, Germany: Schattauer; 1987:8487. 2. Strauss LG, Clorius JH, Schlag P,, et al. Recurrence of colorectal tumors: PET evaluation. Radiology. 1989;170:329-332. 3. Toft P. A very fast implementation of 2D iterative reconstruction algorithms. Proceedings of the IEEE Medical Imaging Conference.1996;3:1742-1746. 4. Passeri A, Formiconi AR, De Cristofaro MT, Pupi A, Meldolesi U. Highperformance computing and networking tools for accurate emission computed tomography reconstruction. Eur J Nucl Med. 1997;24:390-397. 5. Kaufman L. Maximum likelihood, least squares, and penalized least squares for PET. IEEE Trans Med Imaging. 1993;12:200-214. 6. Kontaxakis G, Strauss LG, Tzanakos GS. An efficient implementation of the iterative ML-EM image reconstruction algorithm for PET on a Pentium PC platform. Journal of Computing and Information Technology. 1999;2:153-163. 7. Shepp LA, Vardi Y. Maximum likelihood reconstruction in positron emission tomography. IEEE Trans Med Imag. 1982;1:113-122. 8. Anderson JMM, Mair BA, Rao M, Wu CH. Weighted least-squares reconstruction methods for positron emission tomography. IEEE Trans Med Imag. 1997;16:159-165. 9. De Pierro AR. On the relation between ISRA and the EM algorithm for positron emission tomography. IEEE Trans Med Imag. 1993;12:328-333. 10. De Pierro AR. On the convergence of the iterative image space reconstruction algorithm for volume ECT. IEEE Trans Med Imag. 1987;6:174-175. 11. Fessler JA, Hero AO. Space-alternating generalized expectationmaximization algorithm. IEEE Trans Signal Processing. 1994;42:2664-2677. 12. Hudson HM, Larkin RS. Accelerated image reconstruction using ordered subsets of projection data. IEEE Trans Med Imag. 1994;13:601-609. 13. Green PJ. Bayesian reconstructions from emission tomography data using a modified EM algorithm. IEEE Trans Med Imag. 1990;9:84-93. 14. Alenius S, Ruotsalainen U. Bayesian image reconstruction for emission tomography based on median root prior. Eur J Nucl Med. 1997;24:258-265. 15. Alenius S. On noise reduction in iterative image reconstruction algorithms for emission tomography: median root prior. Thesis for the degree of Doctor of Technology, Tampere, Finnland, 1999 16. Mikolajczyk K, Szabatin M, Rudnicki P, Grodzki M, Burger C. A Java
http://www.alasbimnjournal.cl/revistas/13/rectotal.html
26.10.2003
Complete Version: Performance Characteristics of Iterative Image Reconstruction... Seite 20 von 20 environment for medical image data analysis: initial application for brain PET quantification. Med Inform. 1998;23:207-214. 17. Burger C, Buck A. Requirements and implementations of a flexible kinetic modelling tool. J Nucl Med. 1997;38:1818-1823. 18. Strauss LG, Conti PS. The applications of PET in Clinical Oncology. J Nucl Med.1991;32:623-648. 19. Strauss LG. Fluorine-18 deoxyglucose and false-positive results: a major problem in the diagnostics of oncological patients. Eur J Nucl Med. 1996;23:1409-1415. 20. Palmedo H, Bender H, Grünwald F, Mallmann P, Zamora P, Krebs D, Biersack HJ. Comparison of fluorine-18 fluorodeoxyglucose positron emission tomography and technetium-99m methoxyisobutylisonitrile scintimammography in the detection of breast tumours. Eur J Nucl Med. 1997; 24:1138-1145. 21. Crippa F, Seregni E, Agresti R, Chiesa C, Pascali C, Bogni A, Decise D, De Sanctis V, Greco M, Daidone MG, Bombardieri E. Association between [18F]fluorodeoxyglucose uptake and postoperative histopathology, hormone receptor status, thymidine labelling index and p53 in primary breast cancer: a preliminary observation. Eur J Nucl Med 1998; 25:1429-1434. 22. Lonneux M, Borbath I, Bol A, Coppens A, Sibomana M, Bausart R, Defrise M, Pauwels S, Michel C. Attenuation correction in whole-body FDG oncological studies: the role of statistical reconstruction. Eur J Nucl Med 1999; 26:591-598. 23. Wang CX, Snyder WE, Bilbro G, Santago P. Performance evaluation of filtered back projection reconstruction and iterative reconstruction method for PET images. www.ncsu.edu/ncsu/CIL/med_imaging/reconeval/manuscript.doc.html 24. Doll J, Zaers J, Trojan H, et al. Optimierung der Bildqualität von PETAufnahmen page 24 durch 3D-Datenakquisition und iterative Bildrekonstruktion. Nucl.-Med. 1998;37:62-67. 25. Knêsazrek K, Machac J, Vallabhajosula S, Buchsbaum MS. A new iterative reconstruction technique for attenuation correction in highresolution positron emission tomography. Eur J Nucl Med 1996; 23:656-661. 26. Seret A. Median root prior and ordered subsets in Bayesian image reconstruction of single-photon emission tomography. Eur J Nucl Med 1998; 25:215-219. 27. Toft P. The Radon transform - theory and implementation. Thesis for Ph.D., Technical University of Denmark, Lyngby, Denmark; 1996. Abstract | Introduction | Material and Methods | Results | Discussion | Literature | Complete Version | Article Home
http://www.alasbimnjournal.cl/revistas/13/rectotal.html
26.10.2003