creasingly mobile lifestyle by providing an independent. Personal Area Network ... Mutual interference between Bluetooth piconets was investigated in [2] and [3] ...
1
Performance Evaluation in Time-Synchronized Multi-Piconet Bluetooth Environments Imran Ashraf, Athanasios Gkelias, Leila Musavian, Mischa Dohler, A.H. Aghvami
Abstract— Multiple Bluetooth piconets operating in the globally available 2.4-GHz Industrial, Scientific and Medical (ISM) band are likely to co-exist in a physical environment, supporting applications such as wireless earphones, keyboards etc. An independently operating Bluetooth piconet will inevitably encounter the interference from collocated piconets, which results in individual piconet as well as overall network performance degradation. This paper shows that synchronization among co-existing Bluetooth piconets yields considerable performance improvements as compared to uncoordinated piconets. Index Terms— Bluetooth, multi-piconet, coexistence, synchronization.
I. I NTRODUCTION Bluetooth is a technology using short-range radio links, forming a small network among communicating nodes called a piconet [1]. It is intended to replace the cable(s) connecting portable and/or fixed electronic devices. The usage of Bluetooth-enabled devices has increased enormously in recent years. This trend has facilitated an extensive deployment of low-power ad-hoc wireless communication links between different electronic devices to transfer data, synchronize information and even connect to the Internet through Bluetooth. In short, Bluetooth has served for the need of an increasingly mobile lifestyle by providing an independent Personal Area Network (PAN) to the individual end-user. Based on the deployment of the Bluetooth technology on such a rapid scale, multiple Bluetooth piconets are likely to co-exist in a physical environment. A typical example of this can be portrayed as of a classroom where each student operates his/her own Bluetooth piconet to transfer or synchronize files. Hence, a typical classroom may easily have a large number (e.g. 100) of co-existing piconets, located within each other’s transmission range and using the same 2.4-GHz Industrial, Scientific and Medical (ISM) band. Therefore, it becomes vitally important to investigate the problem of co-channel interference arising from other Bluetooth piconets and propose a feasible solution to mitigate it. Mutual interference between Bluetooth piconets was investigated in [2] and [3], where the authors addressed
the problem by presenting simulation results considering fully and partially loaded piconets. In [4], the author presented an upper bound on the packet error rate of a Bluetooth Asynchronous Connectionless (ACL) link under co-channel interference. The limitations in [4] were successfully removed in [5], in which different packet types and traffic models were integrated into the collision analysis. The analytical results were benchmarked against the results from simulations. In [6], the analytical approach of [5] was extended further by including the frequency-hopping guard time effect. The aforementioned studies provide an analytical approach to the mutual interference problem in co-existing Bluetooth piconets. These studies, however, do not incorporate synchronization among piconets or propose any interference mitigation approach. The already published works emphasize the fact that a large number of coexisting piconets severely degrades the individual piconet or overall network performance in terms of higher packet error rates and lower aggregate network throughput. The aim of this paper is to quantify the potential gains that could be obtained by synchronizing different coexisting piconets. In this paper, we do not discuss or propose possible synchronization architectures, but rather emphasize on presenting results of an analytical framework to highlight the benefits that are obtained with synchronization in such mutual interference scenarios. The rest of the paper is organized as follows. The Bluetooth system overview is described in Section II. The underlying interference model is discussed in Section III. In Section IV, the packet collision analysis considering synchronization among piconets is presented. Analytical results are then presented in Section V and conclusions are drawn in Section VI. II. B LUETOOTH The entire Bluetooth protocol architecture is defined in [1]. A brief summary will be presented in this section with special emphasis on its PHY layer characteristics and parameters. A Bluetooth piconet essentially uses a master/slave architecture in which the master controls the traffic flow. All Bluetooth devices have identical hardware properties so that the master is only selected
2
when the network is successfully established. The unit initiating the connection acts as the master and can organize the channel access for up to seven other active units, which are called slaves. The master carries out the polling in a time-division duplex (TDD) manner. Bluetooth uses frequency hopping spread spectrum (FHSS) to transmit data packets and frequency hop range in most countries covers 79 carriers of 1MHz bandwidth each. Binary baseband data is modulated using Gaussian frequency shift keying (GFSK) and the frequency synthesizer transmits each packet on a newly chosen frequency. The maximum hopping rate in a piconet is 1600 hops per sec. Moreover, the channel is divided into slots of length 625 µs. The actual data is transmitted in part of the total packet transmission time, e.g. 366 µs out of 625 µs in the case of single-slot packet transmission. The remaining time (259 µs, as shown in Fig. 1) is used to let the electronics stabilize to the next frequency hop, known as the frequency hopping guard time.
leads to each piconet being suffered by N -1 potential interfering piconets. We assume that all piconets use a frequency hop range of 79 frequency channels. Also, they are collocated sufficiently close in such a manner that if two or more piconets transmit a packet within the same frequency band at any instant, the corresponding colliding packets are considered corrupted and lost. As explained in the previous section, three types of ACL packets are considered here. Each of these packets has a certain probability of arrival associated with it. The arrival probabilities for 1, 3, and 5-slot packets are represented by ρ1 , ρ3 and ρ5 , respectively. The idle time in the piconet is modeled by assuming a single-slot empty or dummy packet that does not carry any traffic but occurs with a certain probability. This is the same approach used by [5], [6]. The dummy packet is assigned the probability ρ0 such that ρ0 = 1 − (ρ1 + 3ρ3 + 5ρ5 ). We assume that all collocated piconets carry identical traffic with equal arrival probabilities ρ1 , ρ3 and ρ5 . An extension of the presented analysis to the case of different arrival rates in all piconets is tedious but feasible. IV. I NTERFERENCE A NALYSIS W ITH S YNCHRONIZATION
Fig. 1. Frequency hopping guard time illustration for 1-slot packet transmission.
Two physical links are supported in Bluetooth: ACL for data traffic and synchronous connection-oriented (SCO) for time-bounded voice communication. Three SCO packets are defined: HV1, HV2 and HV3. HV stands for high-quality voice. These packets are all single slot but vary in the amount of information they carry: HV1 carriers 10 bytes, HV2 carries 20 bytes and HV3 carries 30 bytes. The ACL link, on the other hand, allows 1, 3 and 5-slot data packets with the optional use of forward error correction (FEC). DM (mediumspeed data) packets are all 2/3-FEC encoded to tolerate possible transmission errors. Not encoded by FEC, DH (high-speed data) packets are more error-vulnerable but can carry more information. DM1/DH1 packets occupy one time slot, while DM3/DH3 and DM5/DH5 packets occupy 3 and 5 time slots, respectively. This paper focuses on performance improvements in ACL connections. Only DH1, DH3 and DH5 packets are considered as these packets do not use FEC and are more susceptible to channel impairments and interference. III. I NTERFERENCE M ODEL We consider N Bluetooth piconets co-existing independently in a certain closed physical environment. This
The performance of a Bluetooth network can be evaluated using various quantitative metrics such as packet error rate (PER), individual piconet throughput (S ) and aggregate network throughput (Θ). The relevance of each performance metric is dependent on the specific network requirements. In this paper, the above-mentioned three measures of performance are considered for accentuating the effect of synchronization in collocated piconets. The respective equations for PER, S and are derived using a probabilistic treatment entailing different Bluetooth baseband parameters. It is important here to elaborate what exactly we mean by synchronization in the context of this paper. As described in Section II, the transmission time is divided into slots of length 625µs. The packet transmissions within each piconet start at slot boundaries, centrally controlled by the master. With no coordination between two collocated piconets, an ongoing packet transmission in one piconet can be interfered by more than one packet from the other piconet. This is because the slot boundaries in the two piconets are not synchronized. The analysis presented hereafter is based on the assumption that the collocated piconets are time-synchronized in a manner such that slot boundaries of all the piconets overlap with each other. We begin by considering two co-existing piconets X and Y . Each of these piconets can transmit a 1, 3
3
or 5-slot (DH1, DH3 or DH5) packet with respective probabilities ρ1 , ρ3 or ρ5 . We focus our attention on the piconet X and derive the success probabilities Pr[s, i], for each of the three packet types i.e. i = 1, 3, and 5, in the presence of interference from the piconet Y . For an ongoing transmission in X , the probability that piconet Y chooses another frequency (no collision) as the one 1 = 78 chosen by piconet X is P0 = 1 − 79 79 .
Fig. 2.
Slot beginnings for different packet types.
We denote the starting slot boundary in each packet type as shown in Fig. 2, such that: • • •
•
B1 , B2 , and B5 mark the beginning of a 1, 3, and 5-slot packet, respectively. B3 and B4 represent the beginnings of the second and third slots of a 3-slot packet, respectively. B6 , B7 , B8 , and B9 denote the beginnings of the second, third, fourth, and fifth slots of a 5-slot packet, respectively. B10 corresponds to the beginning slot boundary of an empty or dummy packet.
All slot beginnings Bj , j = 1...10, have arrival probabilities associated with them. It is clear that the probability of occurrence of B1 is ρ1 per slot; the probability of occurrence for each of B2 , B3 , and B4 is ρ3 ; the arrival probability for each of B5 , B6 , B7 , B8 , and B9 is ρ5 ; and the probability of occurrence of B10 is ρ0 . To emphasize on the occurrence of a particular slot, we denote the arrival probability of Bj by ξ(Bj ), j = 1..10. We also define g(j) to be the number of slots that follows the slot beginning Bj and belongs to the same packet. As an example, g(1) = 1, g(3) = 2, g(8) = 2, and g(10) = 1.
Before we formulate the success probability Pr[s, i] of an i-slot packet, we present an example of packet collision for a 3-slot (i = 3) packet in piconet X as illustrated in Fig. 3. Since the two piconets X and Y are time-synchronized, the slot beginnings of transmitted packets in the two interfering piconets start at the same time instant. In Fig. 3, piconet Y transmits a 1-slot packet containing the slot beginning B1 , with probability ρ1 . The success probability for the first slot of the 3-slot 78 packet would therefore be P0 = 79 . We denote this probability function by τ (j), where j represents the j th slot beginning in Y ’s packet. Intuitively, if Y transmits the dummy packet (B10 with probability ρ0 ), the success probability is simply 1. We can move on to consider the success probability of the remaining part (i − g(1) ) of X ’s 3-slot packet. In Bluetooth, two consecutive packets are transmitted on two different frequencies. The next packet in Y could be either 1, 3, 5-slot or a dummy packet, but is transmitted on a different frequency with respect to the first one. In case, Y transmits a 1-slot packet next, the success probability of the second slot of 77 1 = 78 . Else, if Y transmits X ’s packet will be P0 = 1− 78 a dummy packet next, the success probability will be 1 for the second slot of the X ’s packet. In both cases, we will then need to consider the success probability of the remaining last slot of X ’s packet. Thus, the success probability of the remaining portion of X ’s packet is solved recursively by defining a probability function β(m). Intuitively, β(m) is the success probability of the last m slots of X ’s packet, excluding the first slot. Based on the aforementioned probability functions, we formulate Pr[s, i] as follows:
Pr[s,i] =
10 X
ξ(Bj ) · τ (j) · β(i − g(j),
j=1
where
½ τ (j) =
1 if j = 10, P0 otherwise
and β(m) is defined for k > 0 as follows ρ0 β(m) = · β(m − g(10)) ρ0 + ρ1 + ρ3 + ρ5 ρ1 + · P˜0 · β(m − g(1)) ρ0 + ρ1 + ρ3 + ρ5 ρ3 + · P˜0 · β(m − g(2)) ρ0 + ρ1 + ρ3 + ρ5 ρ5 + · P˜0 · β(m − g(5)), ρ0 + ρ1 + ρ3 + ρ5 Fig. 3.
Packet collisions in synchronized piconets.
(1)
(2)
(3)
where β(m) = 1, for k ≤ 0. In (1), we consider each type of slot beginning (Bj ), j = 1..10, to appear in the
4
P ERi = 1 − Pr[s, i]N −1 .
(4)
The throughput, S , for piconet X in an N -piconet environment is given as: S = ρ1 · Pr[s, 1]
N −1
N −1
· R1 + 3 · ρ3 · Pr[s, 3] N −1
+ 5 · ρ5 · Pr[s, 5]
· R5 ,
respect to the lighter traffic load of 50%. Even at heavier loads, the synchronization outperforms unsynchronized transmissions. 1
0.8 Packet Error Probability
first slot. The corresponding probability is ξ(Bj ). The function τ (j) gives the success probability for the first slot of X ’s packet and the function β(m) accommodates the success of the remaining part of X ’s packet. Equation (1) gives the probability of success for an islot packet in piconet X in the presence of the interfering piconet Y . X experiences interference from N -1 sources when there are N piconets co-existing. The P ERi for an i-slot packet in piconet X is thus given as:
· R3
0.6
0.4 DH1 synchronized DH1 unsynchronized DH3 synchronized DH3 unsynchronized DH5 synchronized DH5 unsynchronized
0.2
(5) 0
where R1 (345.6), R3 (780.8) and R5 (867.9) are the data rates (Kbps) for 1 (DH1), 3 (DH3), and 5-slot (DH5) packets, respectively (for example, 1464 bits are contained in a DH3 packet, therefore R3 = 1464 1875 = 780.8 Kbps). The aggregate network throughput, Θ, of successfully transmitted packets in all the piconets is thus given as Θ = N × S .
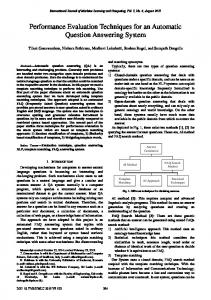
Based on the analysis presented in the previous section, several numerical results are shown, and the performance of synchronized transmissions is compared against unsynchronized transmissions in this section. In Fig. 4, the PER performance of the synchronized transmissions is plotted against unsynchronized transmissions, as a function of number of piconets co-existing in a certain environment. DH1/3/5 packets are considered with equal arrival probabilities (ρ1 = ρ3 = ρ5 ). In Fig. 4(a), a lighter uniform traffic load of 50% (ρ0 = 0.5) is considered in all collocated piconets. There are a couple of common points to be considered here. Firstly, the PER increases as the number of piconets increases, reflecting an increased mutual interference. Secondly, smaller packets (DH1) have lower values for PER with respect to the longer packets (DH5). This is because they suffer fewer collisions due to their shorter time durations. As shown in the figure, synchronization delivers significant PER improvements for all the three packet types. For example, it offers 20% PER improvement for DH1 type packets when 150 piconets are existing together. It is worth considering here that improvement gaps increase as the number of piconets increases. Fig. 4(b) depicts the PER performance of synchronized piconets for a higher traffic load of 80% (ρ0 = 0.2). The PER is higher for all the three packet types with
50
100 150 Number of Interfering Piconets
200
(a) 1
0.8 Packet Error Probability
V. N UMERICAL R ESULTS
0
0.6
0.4 DH1 synchronized DH1 unsynchronized DH3 synchronized DH3 unsynchronized DH5 synchronized DH5 unsynchronized
0.2
0
0
50
100 150 Number of Interfering Piconets
200
(b) Fig. 4. PER comparison of synchronized and unsynchronized transmissions: (a) 50% traffic load, and (b) 80% traffic load.
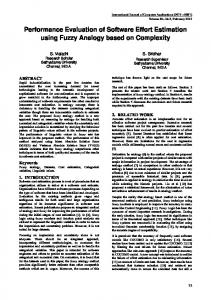
Fig. 5 reports aggregate network throughput as a function of the number of interfering piconets. In Fig. 5(a), the traffic load is chosen as 50% (ρ0 = 0.5). Two different arrival models are considered here. The ratio ρ1 :ρ3 :ρ5 is set to 3:2:1 to reflect the case of more shorter packets in each piconet. Similarly, the ratio ρ1 :ρ3 :ρ5 = 1:2:3 depicts the case of more longer packets. The graph shows that higher throughput is achieved with more longer packets. This is because, though longer packets are more vulnerable to collisions, they carry more data bits per slot (R5 >> R1 ). Also, the aggregate throughput reaches a maximum for a certain value of N and then drops as N increases. Synchronized transmissions generate approximately 30% more aggregate throughput
5
for 100 interfering piconets. This improvement increases with increasing value of N .
in Mobile & Personal Communications, Mobile VCE, http://www.mobilevce.com, whose funding support is gratefully acknowledged.
14000
R EFERENCES Network Throughput (Kbps)
12000
10000
8000
6000
4000 More Shorter Packets, unsynchronized More Shorter Packets, synchronized More Longer Packets, unsynchronized More Longer Packets, synchronized
2000
0
0
50
100 150 Number of Interfering Piconets
200
(a) 14000
Network Throughput (Kbps)
12000
10000
8000
6000
4000 More Shorter Packets, unsynchronized More Shorter Packets, synchronized More Longer Packets, unsynchronized More Longer Packets, synchronized
2000
0
0
50
100 150 Number of Interfering Piconets
200
(b) Fig. 5. Aggregate network throughput comparison of synchronized and unsynchronized transmissions: (a) 50% traffic load, and (b) 80% traffic load.
VI. C ONCLUSIONS A mathematical analysis for synchronization in multipiconet Bluetooth environments has been presented. It has been shown that synchronization yields excellent network performance improvements under varying traffic load conditions. As an example, it offers 26% network throughput improvement in the presence of 100 coexisting piconets. ACKNOWLEDGMENT The work reported in this paper has formed part of the Wireless Enablers area of the Core 3 Research Programme of the Virtual Centre of Excellence
[1] “Bluetooth core specification v1.1,” http://www.bluetooth.com. [2] S. Z¨urbes, W. Stahl, K. Matheus, and J. Haartsen, “Radio network performance of Bluetooth,” in Proc. IEEE ICC, New Orleans, LA, Jun 2000, pp. 1563–1567. [3] S. Z¨urbes, “Considerations on link and systems throughput of Bluetooth networks,” in Proc. IEEE PIMRC, London, UK, Sep 2000, pp. 1315–1319. [4] A. El-Hoiydi, “Interference between bluetooth networks - upper bound on the packet error rate,” IEEE Communications Letters, vol. 5, pp. 245 – 247, June 2001. [5] Ting-Yu Lin, Yu-Chee Tseng, “Collision analysis for a multibluetooth picocells environment,” IEEE Communications Letters, vol. 7, pp. 475 – 477, October 2003. [6] Ting-Yu Lin, Yen-Ku Liu and Yu-Chee Tseng, “An Improved Packet Collision Analysis for Multi-Bluetooth Piconets Considering Frequency Hopping Guard Time Effect,” IEEE Journal on Selected Areas in Communication, vol. 22, pp. 2087–2094, Dec 2004.