Performance Evaluation of a Vertical Line Descriptor for Omnidirectional Images Davide Scaramuzza, C´edric Pradalier, and Roland Siegwart Autonomous System Lab, ETH Zurich, Switzerland,
[email protected],
[email protected],
[email protected]
Abstract— In robotics, vertical lines have been always very useful for autonomous robot localization and navigation in structured environments. This paper presents a robust method for matching vertical lines in omnidirectional images. Matching robustness is achieved by creating a descriptor which is very distinctive and is invariant to rotation and slight changes of illumination. We characterize the performance of the descriptor on a large image dataset by taking into account the sensitiveness to the different parameters of the descriptor. The robustness of the approach is also validated through a real navigation experiment with a mobile robot equipped with an omnidirectional camera.
I. I NTRODUCTION A. Previous work Omnidirectional cameras are cameras that provide a 360◦ field of view of the scene. Such cameras are often built by combining a perspective camera with a shaped mirror. Fixing the camera with the mirror axis perpendicular to the floor has the effect that all world vertical lines are mapped to radial lines on the camera image plane. In this paper, we deal with vertical lines because they are predominant in structured environments. The use of vertical line tracking is not new in the robotics community. Since the beginning of machine vision, roboticists have been using vertical lines or other sorts of image measure for autonomous robot localization or place recognition. Several works dealing with automatic line matching have been proposed for standard perspective cameras and can be divided into two categories: those that match individual line segments; and those that match groups of line segments. Individual line segments are generally matched on their geometric attributes (e.g. orientation, length, extent of overlap) [8]–[10]. Some such as [11]–[13] use a nearest line strategy which is better suited to image tracking where the images and extracted segments are similar. Matching groups of line segments has the advantage that more geometric information is available for disambiguation. A number of methods have been developed around the idea of graph-matching [14]– [17]. The graph captures relationships such as “left of”, “right of”, cycles, “collinear with” etc, as well as topological connectedness. Although such methods can cope with more significant camera motion, they often have a high complexity This work was supported by European grant FP6-IST-1-045350 R Robots@Home
and again they are sensitive to error in the segmentation process. Besides these methods, other approaches to individual line matching exist, which use some similarity measure commonly used in template matching and image registration (e.g. Sum of Squared Differences (SSD), simple or Normalized Cross-Correlation (NCC), image histograms [4]). An interesting approach was proposed in [5]. Besides using the topological information of the line, the authors also used the photometric neighborhood of the line for disambiguation. Epipolar geometry was then used to provide a point to point correspondence on putatively matched line segments over two images and the similarity of the lines neighborhoods was then assessed by cross-correlation at the corresponding points. A novel approach, using the intensity profile along the line segment, was proposed in [6]. Although the application of the method was to wide baseline point matching, the authors used the intensity profile between two distinct points (i.e. a line segment) to build a distinctive descriptor. The descriptor is based on affine invariant Fourier coefficients that are directly computed from the intensity profile. In the work described in [7], the authors define also a descriptor for vertical lines which incorporates geometric, color, and intensity invariants. This method and the one above however require that the line’s ends are accurately detected. Conversely, our method does not need this requirement. All the methods cited above were defined for perspective images. To match vertical lines in omnidirectional images, however, only mutual and topological relations have been used (e.g. neighborhood or ordering constraints) sometimes along with some of the similarity measures cited above (e.g. SSD, NCC) (see [1]–[3]). B. Contributions and Outline This paper extends our previous work [21], summarized in Sections II and III. In these sections, we describe how we built our robust descriptor for vertical lines, which is very distinctive and is invariant to rotation and slight changes of illumination. The main contribution of this paper consists in characterizing the performance of the descriptor introduced in our previous work. The performance evaluation is done on a large image dataset and takes into account the sensitiveness to image noise, to image saturation, and to all the parameters used to define the descriptor. Furthermore, we also evaluate
θ
ra
O
Rmin
Rmax
y
y
x
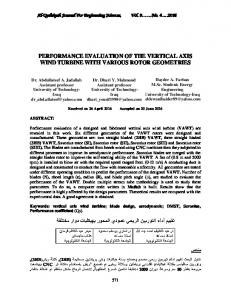
x Fig. 1. Extraction of the most Fig. 2. reliable vertical features. areas.
Extraction of the circular
the robustness of the approach by tracking vertical lines in a real navigation experiment using a mobile robot equipped with an omnidirectional camera. The present document is organized as follows. First, we describe our procedure to extract vertical lines (Section II) and build the descriptor (Section III). In Section IV, we provide our matching rules, while the analysis of the performance and the results of tracking are respectively presented in Sections V and VI. II. V ERTICAL L INE E XTRACTION Our platform consists of a wheeled robot equipped with an omnidirectional camera looking upwards. In our arrangement, we set the camera-mirror system perpendicular to the floor where the robot moves. This setting guarantees that all vertical lines are approximately mapped to radial lines on the camera image plane (Fig. 1) In this section, we detail our procedure to extract prominent vertical lines. Our procedure consists of the following steps. First, we apply a Sobel edge detector and compute the binary edge image. Then, we use a circle detector to compute the position of the image center (i.e. the point where all radial lines intersect in). This can be easily done because the external border of the mirror is visible in the image. To detect the vertical lines, we use a Hough transform. Observe that in our case the Hough space has only one dimension (θ). Every cell in the Hough space contains the number of pixels that vote for the same orientation. We set the dimension of the Hough space equal to 720 cells, which give an angular resolution of 0.5◦ . Then, we apply non-maxima suppression to identify all local peaks. III. B UILDING THE D ESCRIPTOR In Section IV, we will describe our method for matching vertical lines between consecutive frames while the robot is moving. To make the feature correspondence robust to false positives, each vertical line is given a descriptor which is very distinctive and is invariant to rotation and slight changes of illumination. In this way, finding the correspondent of a vertical line can be done by looking for the line with the closest descriptor. In the next subsections, we describe how we built our descriptor. A. Rotation Invariance Given a radial line, we divide the space around it into three equal non-overlapping circular areas such that the radius ra
of each area is equal to (Rmax −Rmin )/6 (see Fig. 2). Then, we compute the image gradients (magnitude M and phase Φ) within each of these areas and we smooth its magniture with a Gaussian window with σG = ra /3. Concerning rotation invariance, this is achieved by redefining the gradient phase Φ of all points relatively to the radial line’s angle θ (see Fig. 2). B. Orientation Histograms To make the descriptor robust to false matches, we split each circular area into two parts (the left and right across the line) and consider each one individually. For each side of each circular area, we compute the gradient orientation histogram. Namely, the whole orientation space (from -π to π) is divided into Nb equally spaced bins and each bin is assigned the sum of the gradient magnitudes which belong to the correspondent orientation interval. In the end we have three pairs of orientation histograms: H1 = [H1L , H1R ] , H2 = [H2L , H2R ] , H3 = [H3L , H3R ] (1) where subscripts L, R identify respectively the left and right section of each circular area. C. Building the Feature Descriptor From the computed orientation histograms, we build the final feature descriptor by stacking all three histogram pairs as follows: H = [H1 , H2 , H3 ] (2) To have slight illumination invariance, we pre-normalize each histogram vector Hi to have unit length. This choice relies on the hypothesis that the image intensity changes linearly with illumination. However, non-linear illumination changes can also occur due to camera saturation or due to illumination changes that affect 3D surfaces with different orientations by different amounts (see Fig. 10). These effects can cause a large change in relative magnitude for some gradients, but are less likely to affect the gradient orientations. Therefore, we reduce the influence of large gradient magnitudes by thresholding the values in each unit histogram vector so that each bin is no larger than 0.1, and then renormalizing to unit length. This means that matching the magnitudes for large gradients is no longer as important, and that the distribution of orientations has greater emphasis. The value 0.1 was determined experimentally and will be justified in Section V. Although this is not true in nature, this approximation proved to work properly and will be shown in Sections V and VI. To resume, our descriptor is an N -element vector containing the gradient orientation histograms of the circular areas. In our setup, we extract 3 circular areas from each vertical feature and use 32 bins for each histogram; thus the length of the descriptor is N = 3areas · 2parts · 32bins = 192
(3)
Observe that all the feature descriptors have the same length.
TABLE I T HE PARAMETERS USED BY OUR ALGORITHM WITH THEIR EMPIRICAL
IV. F EATURE M ATCHING As every vertical feature has its own descriptor, its correspondent in consecutive images can be searched among the features with the closest descriptor. To this end, we need to define a dissimilarity measure (i.e. distance) between two descriptors. In the literature, several measures have been proposed for the dissimilarity between two histograms H = {hi } and K = {ki }. These measures can be divided into two categories. The bin-by-bin dissimilarity measures only compare contents of corresponding histogram bins, that is, they compare hi and ki for all i, but not hi and kj for i 6= j. The cross-bin measures also contain terms that compare non-corresponding bins. Among the bin-by-bin dissimilarity measures, fall the Minkoski-form distance, the Jeffrey divergence, the χ2 statistics, and the Bhattacharya distance. Among the cross-bin measures, one of the most used is the Quadratic-form distance. An exhaustive review of all these methods can be found in [18]–[20]. In our work, we tried the dissimilarity measures mentioned above but the best results were obtained using the L2 distance (i.e. Euclidean distance) that is a particular case of the Minkoski-form distance. Therefore, in our experiments we used the Euclidean distance as a measure of the dissimilarity between descriptors, which is defined as: v uN uX |hi − ki |2 (4) d(H, K) = t i=1
By definition of distance, the correspondent of a feature, in the observed image, is expected to be the one, in the consecutive image, with the minimum distance. However, if a feature is no longer present in the next image, there will be a closest feature anyway. For this reason, we defined three tests to decide whether a feature correspondent exists and which one the correspondent is. Before describing these tests, let us introduce some definitions. Let {A1 , A2 , . . . , ANA } and {B1 , B2 , . . . , BNB } be two sets of feature descriptors extracted at time tA and tB respectively, where NA , NB are the number of features in the first and second image. Then, let Di = {d(Ai , Bj ), j = 1, 2, . . . , NB )}
(5)
be the set of all distances between a given Ai and all Bj (j = 1, 2, · · · , NB ). Finally, let minDi = mini (Di ) be the minimum of the distances between given Ai and all Bj . A. First test The first test checks that the distance from the closest descriptor is smaller than a given threshold, that is: minDi = F1 .
(6)
By this criterion, we actually set a bound on the maximum acceptable distance to the closest descriptor.
VALUES
F1 = 1.05
F2 = 0.75
F3 = 0.8
B. Second test The second test checks that the distance from the closest descriptor is smaller enough than the mean of the distances from all other descriptors, that is: minDi = F2 · < Di >
(7)
where < Di > is the mean value of Di and F2 clearly ranges from 0 to 1. This criterion comes out of experimental results. C. Third test Finally, the third test checks that the distance from the closest descriptor is smaller than the distance from the second closest descriptor: minDi = F3 · SecondSmallestDistance,
(8)
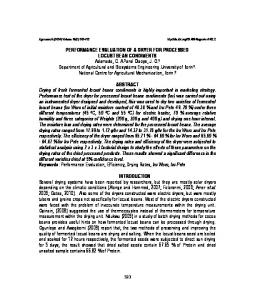
where F3 clearly ranges from 0 to 1. As in the previous test, the third test raises from the observation that, if the correct correspondence exists, then there must be a big gap between the closest and the second closest descriptor. Factors F1 , F2 , F3 were determined experimentally. The values used in our experiments are shown in Table I. The choice of these values will be motivated in Section V. V. P ERFORMANCE E VALUATION In this section, we characterize the performance of our descriptor on a large image dataset by taking into account the sensitiveness to different parameters, which are image saturation, image noise, number of histogram bins, and number of circular areas. Furthermore, we also motivate the choice of the values of F1 , F2 , and F3 shown in Table I. 1) Ground truth: To generate the ground truth for testing our descriptor, we used a database of 850 omnidirectional pictures that is a subset of the whole video sequence used in Section VI. First, we extracted verticals lines from each image. Then we manually labeled all the corresponding features with the same ID. The images were taken from the hallway of our department. Figure 10 shows four sample images from our dataset. The images show that the illumination conditions vary strongly. Due to big windows, a mixture of natural and artificial lighting produces difficult lighting conditions like highlights and specularities. With regard to the viewpoint change, the maximum camera displacement between two views of the same vertical line was about 5 meters, while the average displacement was around 2 meters.
Influence of saturation on correct matches
Influence of number of bins on correct matches
0.8
0.805 Matches
0.795
0.76
0.79
0.74
Correct matches [percent]
Correct matches [percent]
3 Areas 5 Areas
0.8
0.78
0.72 0.7 0.68 0.66
0.785 0.78 0.775 0.77 0.765
0.64
0.76
0.62
0.755
0.6
0.75 0
Fig. 3.
0.05
0.1
0.15
0.2 Saturation
0.25
0.3
0.35
0.4
0
5
10
15
20
25
30
35
Num. Bins
Influence of saturation on correct matches.
Fig. 5.
Influence of number of bins on correct matches.
Influence of noise level on correct matches 0.9
0.45
Matches 0.8 0.7
0.35
0.6
0.3
0.5
PDF
Correct matches [percent]
Correct matches Incorrect matches
0.4
0.4
0.25 0.2
0.3
0.15 0.2
0.1 0.1
0.05 0 0%
2%
4% 6% Noise level (standard deviation of gaussian noise)
8%
10%
Fig. 4. Influence of noise level (%) on correct matches. The correct matches are found using only the nearest descriptor in the database.
2) Image saturation: As we mentioned in Section III-C, we threshold the values of the histogram vectors to reduce the influence of image saturation. The percentage of correct matches for different threshold values is shown in Fig. 3. The results show the percentage of verticals that find a correct match to the single closest neighbor among the whole database. As the graph shows, the maximum percentage of correct matches is reached when using a threshold value equal to 0.1. In the remainder of this paper, we will always use this value. 3) Image noise: The percentage of correct matches for different amounts of gaussian image noise (from 0% to 10%) is shown in Fig. 4. Again, the results show the percentage of correct matches found using the single nearest neighbor in the all database. As this graph shows, the descriptor is resistant even to large amount of pixel noise. 4) Histogram bins and circular areas: There are two parameters that can be used to vary the complexity of our descriptor: the number of orientation bins (Nb ) in the histograms and the number of circular areas. Although in the explanation of the descriptor we used 3 non overlapping circular areas, we evaluated the effect of using 5 overlapping areas with 50% overlap between two circles. The results are shown in Fig. 5. As the graph shows, there is a slight improvement in using 5 overlapping areas (the amelioration is only 1%). Also, the performance is quite similar using 8, 16, or 32 orientation bins. Following this considerations, the best choice would seem to use 3 areas and 8 histogram
0
0
0.2
0.4
0.6 0.8 1 1.2 Distance to the closest descriptor
1.4
1.6
1.8
Fig. 6. The probability density function that a match is correct according to the first rule.
bins in order to reduce the dimension of the descriptor. Conversely, since in this graph the percentage of correct matches is found by using only the nearest closest descriptor, we observed that the best matching results, when using the three rules of Section IV, are obtained with 32 orientations. Thus, in our implementation we used 3 areas and 32 histogram bins. Finally observe that we considered powers of 2 due to computational efficiency. 5) Matching rules: Figure 6 shows the Probability Density Function (PDF) for correct and incorrect matches in terms of the distance to the closest neighbor of each keypoint. In our implementation of the first rule, we chose F1 = 1.05. As observed in the graph, by this choice we reject all matches in which the distance to the closest neighbor is greater than 1.05, which eliminates 50% of the false matches while discarding less than 5% of correct matches. Similarly, Fig. 7 shows the PDFs in the terms of the ratio of closest to average-closest neighbor of each keypoint. In our implementation of the second rule, we chose F2 = 0.75. As observed in the graph, by this choice we reject all matches where the ratio between the closest neighbor distance and the mean of all other distances is greater than 0.75, which eliminates 45% of the false matches while discarding less than 8% of correct matches. Finally, Fig. 8 shows the PDFs in terms of the ratio of closest to second-closest neighbor of each keypoint. In our implementation of the third rule, we chose F3 = 0.8; in this way we reject all matches in which the distance ratio is
0.4 Correct matches Incorrect matches
0.35 0.3
PDF
0.25 0.2 0.15 0.1 0.05 0 0.1
0.2
0.3 0.4 0.5 0.6 0.7 0.8 Ratio of distances (closest/mean closest)
0.9
1
Fig. 7. The probability density function that a match is correct according to the second rule. 0.5 Correct matches Incorrect matches
0.45 0.4 0.35
PDF
0.3 0.25 0.2 0.15 0.1 0.05 0 0.1
0.2
0.3 0.4 0.5 0.6 0.7 0.8 Ratio of distances (closest/second closest)
0.9
1
Fig. 8. The probability density function that a match is correct according to the third rule.
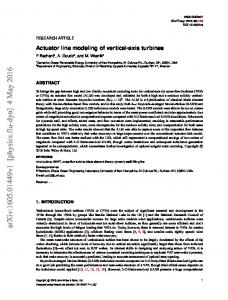
greater than 0.8, which eliminates 92% of the false matches while discarding less than 10% of correct matches. VI. E XPERIMENTAL R ESULTS In our experiments, we adopted a mobile robot with a differential drive system endowed of encoder sensors on the wheels. Furthermore, we equipped the robot with an omnidirectional camera consisting of a KAIDAN 360 One VR hyperbolic mirror and a SONY CCD camera the resolution of 640×480 pixels. In this section, we show the performance of our feature extraction and matching method by capturing pictures from our robot in a real indoor environment. The robot was moving at about 0.15 m/s and was acquiring frames at 3 Hz, meaning that during straight paths the traveled distance between two consecutive frames was 5 cm. The robot was moved in the hallway of our institute and 1852 frames were extracted during the whole path. Figure 10 shows four sample images from the dataset. The result of feature tracking is shown only for the first 150 frames in Fig. 9. The graph shown in Fig. 9 was obtained using only the three matching rules described in Sections IV-A, IV-B, IV-C. No other constraint, like mutual relations, has been used. This plot refers to a short path of the whole trajectory while the robot was moving straight (between frame no. 0 and 46), then doing a 180◦ rotation (between frame no. 46 and 106), and moving straight again. As observed, most of the features are correctly tracked over the time. Indeed, most of the lines appear smooth and
homogeneous. The lines are used to connect features that belong to the same track. When a new feature is detected, this feature is given a label with progressive numbering and a new line (i.e. track) starts from it. In this graph, there are three false matches that occur at the points where two tracks intersect (e.g. at the intersection between tracks no. 1 and 58, between track no. 84 and 86, and between track no. 65 and 69). Observe that the three huge jumps in the graph are not false matches; they are only due to the angle transition from −π to π. Observe that our method was able to match features even when their correspondents were not found in the previous frames. This can be seen by observing that sometimes circles are missing on the tracks (look for instance at track no. 52). When a correspondence is not found in the previous frame, we start looking into all previous frames (actually up to twenty frames back) and stop when the correspondence is found. When examining the graph, it can be seen that some tracks are suddenly given different numbers. For instance, observe that feature no. 1 - that is the fist detected feature and starts at frame no. 0 - is correctly tracked until frame no. 120 and is then labeled as feature no. 75. This is because at this frame no correspondence was found and then the feature was labeled as a new entry (but in fact is a false new entry). Another example is feature no. 15 that is then labeled as no. 18 and no. 26. By a careful visual inspection, only a few other examples of false new entries could be found. Indeed, tracks that at a first glance seem to be given different numbers, belong in fact to other features that are very close to the observed one. After visually inspecting every single frame of the whole video sequence (composed of 1852 frames), we found 37 false matches and 98 false new entries. Comparing these errors to the 7408 corresponding pairs detected by the algorithm over the whole video sequence, we had 1.8% of mismatches. Furthermore, we found that false matches occurred every time the camera was facing objects with repetitive texture. Thus, ambiguity was caused by the presence of vertical elements which repeat almost identical in the same image. On the other hand, a few false new entries occurred when the displacement of the robot between two successive images was too large. However, observe that when a feature matches with no other feature in previous frames, it is better to believe this feature to be new rather than commit a false matching. VII. C ONCLUSION In this paper, we presented a robust method for matching vertical lines among omnidirectional images.The basic idea to achieve robust feature matching consists in creating a descriptor which is very distinctive and is invariant to rotation and slight changes of illumination. We characterized the performance of the descriptor on a large image dataset by taking into account the sensitiveness to the different parameters of the descriptor. The robustness of the approach was also validated through a real navigation experiment with
Evolution of the bearing angle for each features 3
57 6 3
37 38
16 13
28
60 48
65
69 68
70
83
78 80
73
51
93
24
Bearing angle [rad]
1
89
52
2
2
8 12 11
79 56
42 41 43
19
1
26 27
15 18
5963 62 66
55
33
50 36
40
0
61
14 23 5
-1
10
17
25
3034 35 29 39
45 44
47
53 46
71
77 82
72 58
20 22 21
88
81
64
54
49
91
76
67 32 31 47
-2
85 75
87 86
90 9295 94
74
9
-3
84
0
50
Frame
100
150
Fig. 9. Feature tracking during the motion of the robot. In y-axis is the angle of sight of each feature and in the x-axis the frame number. Each circle represents a feature detected in the observed frame. Lines represent tracked features. Numbers appear only when a new feature is detected.
Fig. 10.
Omnidirectional images taken at different locations.
a mobile robot equipped with an omnidirectional camera. The performance of tracking was very good as many features were correctly detected and tracked over long time. Furthermore, because the results were obtained using only the three matching rules described in Section IV, we expect that the performance would be notably improved by adding other constraints like mutual relations among features. R EFERENCES [1] Brassart, E., Delahoche, L., Cauchois, C., Drocourt, C., Pegard, C., Mouaddib, E.M., Experimental Results got with the Omnidirectional Vision Sensor: SYCLOP, International workshop on omnidirectional vision (OMNIVIS 2000), 2000. [2] Yagi, Y., and Yachida, M., Real-Time Generation of Environmental Map and Obstacle Avoidance Using Omnidirectional Image Sensor with Conic Mirror, CVPR’91, pp. 160-165, 1991. [3] D. Prasser, G. Wyeth, M. J. Milford (2004b), Experiments in Outdoor Operation of RatSLAM, Australian Conference on Robotics and Automation, Canberra Australia, 2004. [4] R. Gonzalez, R. Woods, Digital Image Processing, Addison Wesley, Prentice Hall, ed. 2, ISBN: 0201180758, 2002.
[5] Baillard, C., Schmid, C., Zisserman, A., and Fitzgibbon, A., Automatic line matching and 3D reconstruction of buildings from multiple views, SPRS Conference on Automatic Extraction of GIS Objects from Digital Imagery, IAPRS Vol.32, Part 3-2W5, pp. 69-80, 1999. [6] D. Tell and S. Carlsson, Wide baseline point matching using affine invariants computed from intensity profiles, In Proceedings of the European Conference Computer Vision, pp. 814828, Dublin, Ireland, 2000. [7] T. Goedeme, T. Tuytelaars, and L.V. Gool. Fast wide baseline matching with constrained camera position. In CVPR, pages 2429, 2004. [8] Medioni, G. and Nevatia, R., 1985. Segment-based stereo matching. Computer Vision, Graphics and Image Processing 31, pp. 218. [9] Ayache, N., 1990. Stereovision and Sensor Fusion. MITPress. [10] Zhang, Z., 1994. Token tracking in a cluttered scene. Image and Vision Computing 12(2), pp. 110120. [11] Crowley, J. and Stelmazyk, P., 1990. Measurement and integration of 3d structures by tracking edge lines. In: Proc. ECCV, pp. 269280. [12] Deriche, R. and Faugeras, O., 1990. Tracking line segments. In: Proc. ECCV, pp. 259267. [13] Huttenlocher, D. P., Klanderman, G. A. and Rucklidge, W. J., 1993. Comparing images using the Hausdorff distance. IEEE T-PAMI. [14] Ayache, N. and Faugeras, O., 1987. Building a consistent 3D representation of a mobile robot environment by combining multiple stereo views. In: Proc. IJCAI, pp. 808810. [15] Horaud, R. and Skordas, T., 1989. Stereo correspondence through feature grouping and maximal cliques. IEEE TPAMI 11(11), pp. 11681180. [16] Gros, P., 1995. Matching and clustering: Two steps towards object modelling in computer vision. Intl. J. of Robotics Research 14(6), pp. 633642. [17] Venkateswar, V. and Chellappa, R., 1995. Hierarchical stereo and motion correspondence using feature groupings. IJCV pp. 245269. [18] M.M. Rahman, P. Bhattacharya, and B.C. Desai, Similarity Searching in Image Retrieval with Statistical Distance Measures and Supervised Learning, in Pattern Recognition and Data Mining, pp. 315-324, 2005. [19] Y. Rubner, C. Tomasi, and L. J. Guibas, .The earth mover’s distance as a metric for image retrieval,. International Journal of Computer Vision, vol. 40, no. 2, pp. 99-121, 2000. [20] Y. Rubner et al, .Empirical evaluation of dissimilarity measures for color and texture,. Computer Vision and Image Understanding, vol. 84, no. 1, pp. 25-43, 2001. [21] Scaramuzza, D., Criblez, N., Martinelli, A. and Siegwart, R., Robust Feature Extraction and Matching for Omnidirectional Images, Proceedings at the 6th International Conference on Field and Service Robotics (FSR 2007), Chamonix, France, July 2007. [22] Y. Bar-Shalom and T.E. Fortmann, Tracking and data association, mathematics in science and engineering, vol. 179, Academic Press, 1988.