263
PERFORMANCE MEASUREMENT USING LOCATIONBASED STATUS DATA 1
Olli Seppänen and Russell Kenley
2
ABSTRACT Much attention has been placed on measuring performance of activity completion in Lean literature, using techniques such as Percentage of Planned Activities Completed (PPC). Originally intended as one component of measuring plan execution, along with measures of Planned Productivity, PPC has been extensively researched but Planned Productivity has been neglected. Using a lean methodology based on location-based scheduling enables an alternative performance measurement system. This paper proposes a method which makes possible the gathering of large amounts of performance data without too much effort. The method is an important contribution to the available suite of lean methods. Performance measurement using location-based status data is a method which has much in common with earned value analysis, and is able to use the progressive performance through each location of the project as the unit of measurement. The equivalent indicator to PPC is provided by measuring against the planned completion of a location. Furthermore, before commencing work the site checks the actual quantities in each location. Planned Productivity is measured during implementation, with the start date and finish date, actual quantities and average resources used in each location being recorded. This information can be used to calculate actual productivity. The location-based data gives the ability to measure within tasks, revealing not just completion of stages as in PPC, can measure against Planned Productivity. The actual productivities can be used to forecast problems in the future and to evaluate the feasibility of alternative control actions. In addition, the location-based actual information combined with the original Bill-of-Quantities and schedule reveals the erroneous assumptions made during preplanning and facilitates learning on future projects. KEY WORDS Flowline, PPC, Performance measurement, Location-based. INTRODUCTION Performance measurement is important for measuring the success of any management philosophy, and one of the main performance indicators of lean construction methodologies, such as the Last Planner SystemTM (LPS), is Percentage Plan Complete (PPC) (Ballard and Howell 1998). Introduced by Ballard and Howell (1994) as plan execution, with the measures of Percentage of Planned Activities Completed and Planned Productivity as its measures of performance, PPC has dominated conferences since then with many 1
2
papers which adopt this method, and evaluate project performance by measuring PPC. There are relatively few attempts at productivity measures, with those being adopted from conventional construction management, such as the Labour Utilisation Factors (LUF) compared with PPC by Chitla and Abdelmhamid (2003). Lean construction methodologies which adopt a location-based approach, such as Flowline, also require production performance measurement. Kenley (2004), defined flowline as location-based activity management driven by the principle of continuous use of work resources. Flowline is a
PhD Student, Department of Civil and Environmental Engineering, Helsinki University of Technology, Technology Manager Dynamic System Solutions Ltd., Pohjoinen Rautatiekatu 29B, FIN-00100 Helsinki, Finland, E-Mail
[email protected], website www.dss.fi Professor of Construction. School of Built Environment, Unitec New Zealand, Private Bag 92025, Auckland, New Zealand, Phone +64 9815 4321 (7374), FAX +64 9815,
[email protected] Flowline
264
management philosophy for construction production, otherwise known as: ‘Line-of-balance’, ‘Construction planning technique’, ‘Vertical Production Method’, ‘Time-Location Matrix model’, ‘Time Space Scheduling method’, ‘Disturbance scheduling’ and ‘Horizontal and vertical logic scheduling for multistory projects’ (Harris and Ioannou 1998). Kenley (2004) reintroduced the most evocative term for a Lean thinker, that of ‘Flowline’ (from Mohr 1991)3. Chitla and Abdelmhamid (2003) stated “The Percent Plan Complete (PPC) is a metric that reflects the effectiveness of production planning and the reliability of workflow from one trade to another." This is an interesting definition and one which highlights a concern in the interpretation of workflow, yet ignores the original role for productivity measurement. An assumption within location-based Flowline production management is that workflow is not only predictable, but planned and continuous—not interrupted. This is not a requirement of LPS, which is a production control method rather than a planning tool and uses PPC “to measure the quality of the commitments made and the reliability of workflow, the number of completed assignments is expressed as a ratio of the total number of assignments made” (Chitla and Abdelmhamid 2003) in a given week or perhaps daily (Ballard and Howell 2003). However, the location-based strategy provides one great advantage over activity-based systems. This advantage is that the setting of daily task assignments and completion can be replaced with commitment to a chain of progress through locations—requiring equal prior commitment as in LPS—providing completion of scheduled workflow through locations. This is an important point, because the key philosophical difference is between committing to an activity as a once off venture, and committing to a chain of activities through a sequence of locations. The latter is a much greater and more effective commitment for the delivery of lean principles on projects. The key difference here is that PPC is a target completion performance measure of plan execution—but provides little information with regards to the rate of production. One criticism could be that deliberately slowing the work and setting few tasks would lead to improved PPC, but slowed production. As with Earned Value Analysis (Kenley 2003), performance measurement requires consideration of time as well as completion. Yet Planned Productivity was always an 3
Performance measurement using location-based status data
intended measure of Plan Execution (Ballard and Howell 1994). Flowline provides a unique solution to this problem, as the completion of work within locations equates to PPC and the rate of production according to the flowline schedule—complete with continuity and work-flow—provides the planned productivity performance information. Furthermore, the knowledge of planned, and actual, quantity data, production rates and resources; provides a great deal more information than is available with PPC. It must however be noted that making tasks ready, using lean methods, is assumed and necessary, however this is done for chains of activities rather than discrete activities, with commitment flowing through the chain. Thus, the adaptation of PPC into the flowline methodology and the development of a hybrid system have the potential to improve the performance management of Lean construction projects. This paper proposes just such a hybrid performance management system which measures Plan Execution. LOCATION-BASED SCHEDULING BASED ON LOCATION-BASED QUANTITIES The proposed system for performance measurement needs location-based quantities and a flowline schedule which has been based on the quantities as starting data (it is possible, but undesirable, to mimic scheduling by days). Quantity information is critical to get the benefits of flowline management, because the flowline planning method optimizes the production rates to achieve continuous resource flow. If quantities or productivities are unknown, the durations are guesses at best and continuity can’t be assured. Quantities should be estimated by using the Location Breakdown Structure of the project. The Location Breakdown Structure is a hierarchical model of physical locations of the building. Depending on project type, Location Breakdown Structures can be very different. In normal building projects, however, the first hierarchy level is composed of buildings or structurally independent parts of buildings, the next hierarchy level has floors and, for suitable projects, the floors are subdivided into rooms, apartments or other spaces. Each activity item and quantity has a logical hierarchy level where it is most meaningful to be calculated. For example, quantities of the structure
Harris and Ioannou (1998) also identified the terms used in engineering construction such as highways, pipelines and tunnels, as ‘Time versus distance diagrams’, ‘Linear balance charts’, ‘Velocity diagrams’ and ‘Linear scheduling’. Kang, and Park, et al. (2001) also identify ‘Horizontal and vertical scheduling’, and ‘Multiple repetitive construction process’—but aimed these at the specific case of vertical replication repeated in multiple buildings.
Proceedings IGLC-13, July 2005, Sydney, Australia
Olli Seppänen and Russell Kenley
265
availability and a realistic but tight estimate of productivity (this contrasts with unfortunate common practice, which is to allow an approximate duration, such as a number of days, for an activity without due regard to the specific context). This in fact removes a great deal of surprise from the variation in production: it ceases to be unexpected. Unexpected variation can be accounted for by using simulation to assess the risk of interference to the succeeding trades (Kankainen & Seppänen 2003). If productivity is found to be incorrect during the project, the required production rate can be achieved by adding or decreasing resources. The main benefit of using location-based quantities is to be able to plan continuous work flow with even or balanced resource use for subcontractors and direct labor. Just drawing task lines with parallel slopes is not enough, because it requires the implicit assumption that either quantities are the same in each location or that resources are added or decreased based on demand in each location (this is a common error made by those that consider linear scheduling to be simplistic). This assumption is dangerous because it may damage the potential benefits of flowline production management with resultant and unexpected fluctuating resource needs. Figure 1 shows an example of flowline scheduling
are meaningful at the floor level of accuracy while finishes and fittings can be calculated for each individual room. Finer detail is more suitable for measuring completion by location. Longer duration activities at the higher location breakdown would require percentage completion. To plan production rates and to get an idea of resource needs, quantities can be transformed into durations in a location by using productivity information. The usual problem is that for subcontracted work in commercial construction, productivity data is often not available4. In Finland, this issue has been addressed by developing a common productivity database by a joint effort of construction companies (Olenius, Koskenvesa & Mäki 2000). If productivity data is not available, durations have to be estimated based on the planner’s knowledge and expertise of duration and resource use. This allows a measure of productivity to be calculated backwards from quantity and resource use and can be refined in future projects by the use of performance measurement systems. One common criticism against using productivity estimates, made within the Lean Construction literature, is that waste has been already included in current estimates. On the other hand, there is variability associated with productivities. In location-based planning, the idea is to set realistic production rate targets based on quantities, resource DSS Ltd.
Line-of-balance view
Figure 1
Foreperson: Russell Kenley v ersion 5.6.2005 15: 55 Planner: O lli Seppänen Taso2 May Jun Jul Aug 22 23 24 25 26 27 28 29 30 31 21 Mo Tu We Th Fr Mo Tu We Th Fr Mo Tu We Th Fr Mo Tu We Th Fr Mo Tu We Th Fr Mo Tu We Th Fr Mo Tu We Th Fr Mo Tu We Th Fr Mo Tu We Th Fr Mo Tu We Th Fr Mo Tu We Th 3 2
2 SK TA
TA SK 1
5
5
TA SK2
1
Project start
TA SK 1
4
4
2 SK TA TA
SK 1
3
3
3
TAS
K2
1
TA
SK 1
2
2
2
TA SK 1
TA SK 2
1
1
Plan: Design mode DYNAProject v2.2.0100
Act ual:
Forecast: Registration data: Olli Seppänen / DSS Ltd.
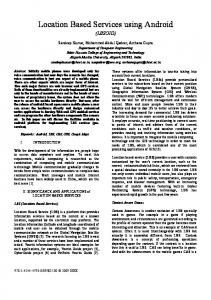
Figure 2: Forecasting production after performance variation 4
Experience indicates this statement is not true in engineering construction, where production rates are expected. Flowline
266
with two lines having the same quantities. Task 1 forces the line to have the same slope in each location, while task 2 has different quantities but uses the same resources in each location, and thus the slope of the line varies. The small numbers at the top of each of the line segments of task 1 show the resource needs for each location. Both tasks have the same total duration over the project. However, task 1 will probably not be implemented as planned because of fluctuating resource needs. It is unlikely that the subcontractor will provide more men exactly as needed to achieve locationbased production rate requirements. On the other hand, task 2 can be implemented as planned if the subcontractor provides enough resources to consistently achieve the aligned production rate. By using location-based performance measurement it is then easy to estimate if the production rate should be adjusted by increasing or decreasing resources. This results in much fewer adjustments and gives the subcontractor confidence that they can continue with the same resources until the end of their contract. GETTING ACTUAL DATA DURING PRODUCTION Actual performance data is needed for three purposes: 1) to evaluate immediate need for control actions, 2) to learn the correct productivity rate for future projects, and 3) to estimate the productivity effects of control actions, deviations and process improvement initiatives. To achieve the information needed for production control, the performance data needs to be obtained almost in real-time and to correspond with the original plan. In location-based scheduling, the most accurate unit of scheduling is the location. Thus it makes sense to measure performance in each location as opposed to measuring performance as function of fixed time periods (with percentage completion). To be able to calculate the performance measures described in the next section, the following information should be gathered in each location for each task: • actual quantities • actual resources • actual shift length and days off • actual start and finish dates • actual deviations Based on the author’s Finnish experiences on real case studies, the monitoring should be done at least weekly to get accurate enough results. If the monitoring is weekly instead of real-time, there will be minor measurement errors in each location Proceedings IGLC-13, July 2005, Sydney, Australia
Performance measurement using location-based status data
because it is not possible to know the exact time when the crew finished in a location or how long a crew worked on any given day. However, because there are many locations in a typical project, these measurement errors will cancel each other out. The time needed to get this information is about two hours a week on a 15,000 m2 project (Seppänen & Aalto submitted). Monitoring daily would give more accurate results but is very difficult to implement. Shifting recording requirements to the work-crew may enable more accurate data recording. LOCATION-BASED PERFORMANCE MEASURES The following performance measures can be calculated based on the data above: • total effective duration = actual finish date – actual start date – interruptions – days off • actual production rate (units / shift) = actual quantity / total effective duration • actual manhours / day = actual number of resources * actual shift length • actual resource consumption (manhours / unit) = (actual manhours / day) / actual production rate Actual production rate has lower starting data requirements. It just needs actual quantities with finish dates and start dates for each location. If actual quantities are unknown, the planned quantity can be substituted to arrive at a rough measure. The production rate doesn’t indicate whether the work has been more or less productive than planned but it can be used to forecast future progress if no control actions are taken and if the production continues as before. Actual resource consumption is a much more powerful measure but it requires the knowledge of actual shift lengths and actual resources. This means daily control of work to observe resource fluctuations and work times. The measure can be used in planning control actions: how much more resources (having the same productivity) or longer days (with the same resources) are needed to achieve the original plan. The location-specific measures of a single task can be used to estimate the variability of production rates and resource consumptions associated with a trade. FORECASTING FUTURE PROBLEMS Unlike PPC, which is an optimizing indicator (approaches 100% at optimum performance), actual production rates can be used to make schedule forecasts. The schedule forecasts are calculated based on the assumption that the production continues with the same production rate as
Olli Seppänen and Russell Kenley
267
before, unless control actions are taken. This can be shown graphically by plotting the actual line and the forecast line into the flowline diagram. Graphically the forecast line is just an extrapolation of the actual line. CPM logic in the original schedule can be used to estimate the effect on future trades by applying the same logic to forecast lines. In figure 2, a simple example is presented. There are three tasks in five locations. Task 1 has started as planned but has been consistently slower than planned. Tasks 2 and 3 have been started earlier than planned because project management has felt uncomfortable with long start-up delays (this habit of starting early and not actually implementing the planned buffers has been discussed in Seppänen & Kankainen 2004). Task 2 has actually been a bit faster than planned. Forecasts have been calculated based on actual production rates and giving most weight to the last two finished locations (weight of last location is three times the weight of preceding location). By applying CPM Finish-to-Start relationship for each location, the forecast lines of task 2 and task 3 are forced to shift because predecessors are forecasted to be late. Unless task 1 can be accelerated there will be breaks in resource flow of tasks 2 and 3. To properly answer the question what should be done to correct the problem, resource consumption information is needed. DSS Ltd.
OPTIMIZING CONTROL ACTIONS Performance measurement data can be directly utilized to find out reasons of deviations. Production rate deviation can be caused by one of the following reasons or their combination: • actual quantities are larger / smaller than planned • less or more resources than planned have been utilized • workhours / day have been more / less than planned • productivity has been higher / lower than planned First three points are revealed directly by the gathered actual data. Productivity differences are revealed by the resource consumption measure. If the deviation has been caused by inaccurate assumptions or measure of quantities, the natural control action is to check immediately whether the deviation will repeat in the following locations. If the deviation is repeating, the production will be late even if the productivity is as planned. If the deviation is a once-off exception, the effect will be more localized. If the subcontractor provides fewer or more resources than planned and if there is high confidence in productivity estimates used in developing the schedule, the situation should be monitored closely. The resources might be more
Line-of-balance view
Foreperson: Russell Kenley Level2 2005 Jun May 21 22
Figure 2
v ersion 5.6.2005 19: 50
23
24
25
26
Jul 27
28
Planner: O lli Seppänen
29
30 1
Aug 31 1
1
32 1
33 1
34
35
1
5
Project end
3
Project start
4
1
1
2
Plan: Control mode DYNAProject v2.2.0100
Act ual:
T AS K2
TA
SK 1
1
3 SK TA
Forecast: Registration data: Olli Seppänen / DSS Ltd.
Figure 2: Forecasting production after performance variation
Flowline
268
or less productive than the average but if they aren’t, there will be deviations in the future. Differences in productivity indicate that the resources are more / less skilled than the average, the work is more / less difficult than planned or there are more / less non-value adding activities (i.e. waste) included in the work or even that resources are being shared or there is multi-skilling. Lean construction tools aim to increase productivity by reducing the amount of waste in the process, where waste is the expending of effort or the using up of resources without producing value (Macomber and Howell 2004). The use of these tools should be reflected in the labor consumption measure, this will remove surprise in planned performance. The production rate can be increased by adding resources, working longer days or increasing productivity by using more skilled workers or multiskilling, changing design to less difficult or reducing the amount of waste. The production rate can be decreased by using less resources or using shorter days. Decreasing productivity is not an option because this leads to waste (and increased cost). The actual productivity is known, therefore it is easy to calculate how much more resource (of same skill level) are required or how much longer days the existing resources should work, to catch up with the original plan. By negotiating with all the subcontractors affected and taking into account their resource availability, it is possible to arrive at a control plan which is optimal for everyone. The control plan may include adding resources to some tasks, decreasing the resources of other tasks and working longer days on a third task. The experience of authors indicates that the subcontractors are happy to get help from the General Contractor to find ways of achieving their contractual milestones and to prevent work interruptions of succeeding trades. Informed decisions about control actions are possible only if there is data to support the planning. UTILIZING THE MEASUREMENT DATA IN FUTURE PROJECTS
Performance measurement using location-based status data
performance measurement techniques, it is easy to gather enough data to preplan even subcontracted work accurately. Another way of utilizing the performance data is to show the productivity effects of implementing lean methods and tools. The productivity of projects using lean management methods should be higher than other projects. The location-based performance data gathering is an easy way to estimate the productivity gains. The benefit can be shown to the subcontractors, who should be willing to reduce their bid price on future work, if the general contractor can show that productivity of the sub-contractors trade is consistently higher in their own projects rather than in their competitors’ projects. CONCLUSION This paper has presented a simple but effective way to get performance measurement data which can be directly utilized to support production management decisions. In contrast with the earlier measures which are based on measuring completion of discrete activities (such as PPC), the production rates and productivity are directly measured. Thus Plan Execution is measured in both completions and productivity, as originally intended by Ballard and Howell (1994). The method gives a reasonably accurate estimate of production rates and labor consumption because they are measured in each location and the measurement errors cancel each other out if there are many locations. The production rates can be used to forecast a trade’s future performance and its effects on succeeding trades. The productivity measure can be used to optimize control decisions and to show productivity enhancing benefits of lean process improvement initiatives. Actual productivities can be used in future projects to achieve more reliable production. The productivity measure is an objective measure and allows comparison between different projects having similar work. REFERENCES
In addition to using the measurement data to make Ballard and Howell (1994) “Implementing Lean Construction: Improving downstream perforinformed production control decisions, the data mance”. 2nd Annual Conference on Lean Concan be used to preplan future projects with a higher level of confidence. Location-based schedstruction. Catolica Universidad de Chile, ules need the productivity information together Santiago, Chile. with the quantities and resources to arrive at dura- Ballard, G. and G. Howell (2003). “An update on tion in each location. Even though projects may be last planner”. 11th Conference of the Internaindividual, the work is often the same in all protional Group for Lean Construction, jects. Thus the actual productivity rates can be Blacksburg, Virginia. used in a wide variety of projects, if the task has Chitla, V. R. and T. S. Abdelmhamid (2003). the same work content. By using location-based “Comparing process improvement initiatives Proceedings IGLC-13, July 2005, Sydney, Australia
Olli Seppänen and Russell Kenley
269
Conferederation of Finnish Construction based on percent plan complete and labour Industries RT and Rakennustietosäätiö. utilization factors”. 11th Conference of the Tampere, Finland. International Group for Lean Construction, Seppänen, O. & Aalto, E. (submitted). “A case Blacksburg, Virginia. study of Line-of-Balance based schedule Kenley, R. (2003). Financing Construction: cash planning and control system”. Submitted to flows and cash farming. London and New 13th Conference of the International Group York, Spon Press—Chapter 4. for Lean Construction. Sydney, Australia. Macomber, H. and G. Howell (2004). “Two great wastes in organsations”. 12th Annual Lean Seppänen, O. & Kankainen, J. (2004). “An empirical research on deviations in production and Construction Conference, Copengagen. 13– current state of project control”. 11th Confer21. ence of the International Group for Lean ConOlenius, A., Koskenvesa, A. and Mäki, T. (edistruction. Elsinore, Denmark. 206–219. tors) (2000). “Ratu aikataulukirja 2001”.
Flowline