traffic workloads: laptop-based Web browsers, and data- ... laptops and phones. ... USA. Performance of a wireless data network with mixed interactive user ...
Performance of a wireless data network with mixed interactive user workloads N. K. Shankaranarayanan, Anupam Rastogi* , and Zhimei Jiang AT&T Labs-Research, Middletown, NJ. USA Abstract— Wireless data networks will have a mix of user workloads since there will be a variety of wireless data terminal devices. Using computer simulation, we study the performance of an EDGE-based packet wireless network with various combinations of Web and dataphone users. We provide an understanding of the performance of a shared channel with mixed user workloads, and show that the number of users that can be supported can be determined using simple rules based on average traffic statistics.
I. INTRODUCTION Wireless data services are already well-established, and are growing in popularity. Due to trade-offs in size, weight, cost, and battery life, a variety of devices are used, and it is expected that this trend will continue. Each device has a different workload or traffic characteristic, and thus wireless data networks will have a mix of user workloads. The “always on” nature of such data connections implies that the most suitable network model is to have a shared packet channel. Therefore, it is important to understand the performance of shared packet wireless channels with a mix of user workloads. The first step is the dimensioning problem, which is to determine the number of users that can be supported with acceptable performance. Other areas of interest are the impact of user types on each other, and ways of providing differentiated service and service guarantees. There is very little published information about wireless data traffic. A recent paper reports packet trace measurements of traffic from WAP phones using a 14 kbps circuit data connection in an IS-95 CDMA network [1]. The researchers studied the characteristics of a browser session, which is a subset of the full user session. Statistics such as number of users, bytes transferred, and duration of browser session are reported. We have some insight on wireless data traffic from our analysis of proprietary traffic logs from a cellular wireless data network, and use this to guide our study of different types of wireless device workloads. To explore the coexistence of different workloads, we conducted a computer simulation of an EDGE-based TDMA packet wireless system with various combinations of two types of interactive traffic workloads: laptop-based Web browsers, and datacapable phones (dataphones). Our objective was to study the capacity and dimensioning problem, and also to determine the impact of one user type on another. The rest of this paper is organised as follows. In Section II, we discuss user workload models. Section III has simulation results, and Section IV concludes the paper. *
II. U SER W ORKLOAD M ODEL We focus our study on interactive applications such as Web browsing, query/response information services, email etc. This is expected to be a dominant portion of wireless user workloads. Each occurrence of a user connecting to the network is a data session. The active periods of interactive traffic within a session can be characterized using an ON/OFF model; the ON period starts when user requests a page of information, which may result in fetching a number of files, and stops when the page has been downloaded [3]. This is depicted in Fig. 1. The duration of the ON period depends on page size, network conditions and protocol interactions. The think time between two ON periods is the OFF time, which can be assumed to be independent of the ON times. During the ON-OFF cycle, the user is considered to be active since he/she is actively engaged in a network transaction, such as downloading or reading the information just downloaded. The average user rate during the active time is important in our modeling and simulation work [4]. The user is considered to be idle for the portion of the session when they are not active. User workloads are affected by device type, application and pricing model. The size and resolution of the display varies considerably in laptops, PDAs, and data-phones, and the amount of data received is correlated with the display capabilities. Laptops are expected to generate the largest amount of traffic per device whereas dataphones, which have limited and mostly text displays, generate a small amount. Uplink traffic depends on application and device, and laptop users can send more email and upload more information. An “always-on” service with a byte-based pricing model would encourages larger idle times within a session. In this paper, we focus on two types of devices, laptops and dataphones. PDAs are expected to account for a large portion of wireless devices in the fugure. We do not address them here due to the lack of good traffic information. Their behavior should be somewhere between laptops and phones. A. Wireless data workload model We developed a workload model for our simulation of a wireless data system with various combinations of laptopbased Web users and data-capable phones. Table II lists the key parameters used in our simulations. We model users who are always active in an ON/OFF cycle, as opposed to registered subscribers who have significant idle times. Our models are based loosely on proprietary results from
University of Texas, Austin. Work done during summer internship at AT&T Labs-Research.
0-7803-7400-2/02/$17.00 © 2002 IEEE
887
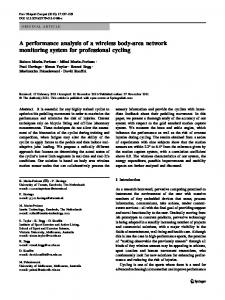
analysis of traffic logs from a cellular wireless data network. Our model for Web users follows the SURGE model as in previous work [4][5], but we have adjusted the parameters based on the channel rate such that the average (offered) user rate during active sessions is 9 kbps. This is the rate at which the user would retrieve information on a high-rate channel [4]. The actual user rate decreases as the bandwidth decreases. This is due to the interactive nature of the traffic; lower rates mean longer ON times, but the OFF times are indpendent of ON times. For the phone users, we adapted the above ON/OFF model, except that we assume each ON period only includes one file, which is the case with WAP and other data-capable phones. We studied the byte logs and timing events of some of our personal data sessions using a Cellular Digital Packet Data (CDPD)-based [2] data-capable phone and settled on a 0.65 kbps average offered user rate. III. SIMULATION We conducted a TCP-based Web browsing simulation to study the performance of a shared packet wireless system with mixed user workloads. In our simulation, we used a wireless channel model mimicking the EDGE/GPRS standard, which is a third-generation cellular TDMA system with a packet network based on IP. IP packets are divided into smaller radio-level blocks, and each block is transmitted using one of 8 time slots in a 20 ms frame. We used a variable-rate, variable-mode channel model with an average rate of 220 kbps [6]. Other simulation parameters are listed in Table I. Our simulation program was written in Maisie/Parsec and C. The TCP programs used in the simulator were ported from FreeBSD v2.8. Mechanisms such as TCP slow start, congestion control, and retransmissions were included. Web pages are segmented by TCP and sent as IP packets to be buffered in a router with per-user queueing. The queue is assumed to have sufficiently large buffers to accommodate the sum of the TCP window sizes for the active flows. Time slots are assigned to different queues according to a roundrobin serving policy. Each user queue can use multiple slots if available. In every time slot, a certain amount of bytes are removed from the corresponding packet and transmitted, and the number of bytes depends on the transmission mode being used. We focus only on the limitation caused by the downlink capacity of the access network. We assume that the information servers, routers, and other backbone network components are ideal except for latency. We model a finite backbone propagation delay (120 ms rtt) which is important for interactive applications. There are two types of users in the simulation: laptopbased Web browsers, and data-enabled phones. Various combinations of Web and phone users were simulated. Figure 2a shows the number of Web & phone user combinations that can be supported for channel utilization values of 65% (normal conditions) and 96% (heavy utilization). The slope of the lines are -15 and -11 implying
888
that a Web user can be traded off with 15 and 11 phone users respectively. The slope is the ratio of the actual user rates (goodput) of Web and phone users. At low to medium utilization, one Web user uses the resources of 15 phone users, and this ratio is the same as that of the intended offfered user rates of 9 kbps and 0.65 kbps respectively. The interesting point to note is that the impact of the highworkload Web users is reduced at high system loads, and the ratio of the goodputs of the Web and phone users has decreased from 15 to 11. To understand the results, we study a performance metric termed Effective Serving Rate (ESR) [5]. This is the rate at which resources are given to a user when there are packets waiting to be transmitted in the queue. This characterizes the bandwidth allocation, but excludes any deadtime when the channel is not being used. We compute it by simply dividing the total bytes per user by the sum of the time intervals when the user queue is not empty. This measure turns out to be the same as the Equivalent Circuit Rate (ECR) [4], which is the dedicated circuit rate required by an identical user workload in order to achieve the same mean web page delay. As per the analytical model in [4], the ESR or ECR depends largely on the total system utilization, and is given by
ESR (or ECR) » R *η *(1 - U ) where R is the shared channel rate, η is the efficiency with which the bandwidth resources are utilized, and U is the total channel utilization. The physical explanation is that ESR and ECR characterize the residual capacity in the system, which is given by R*(1-U). Figure 2b shows the ESR as a function of utilization for Web and phone user groups. The inverse linear behavior is clearly displayed. The phone users have 30% less efficiency in utilizing the channel. This is due to the fact that phone users have a higher proportion of short messages which face higher overheads due to the segmentation into slots. When the utilization is high (irrespective of whether it is high due to too many Web users or too many phone users), Web users have a larger performance drop compared to phone users. Figure 3 shows average ON time (page delay) and the goodput (actual user rate) as a function of total utilization. The average ON time increases with utilization due to lower bandwidth resources from sharing. We found that phone users and Web users experience a significant drop in goodput for ESR (ECR) rates lower than 20 kbps and 80 kbps respectively. This explains why phone user performance is not much affected till 0.9 utilization, but Web user performance degrades noticeably beyond 0.6 utilization. The drop in goodput (actual user rates) is clear in Figure 3b. This reveals the relative disadvantage of the Web users compared to phone users. This behavior is due to peruser queueing as well as the nature of interactive traffic. The significance of our finding is explained below. Web users offer a heavier load compared to phone users, and one would thus expect them to impact the experience of phone
users. While it is true that one Web user takes up the resources of 11 to 15 phone users, the phone user experience is relatively independent of the number of Web users, as long as the ESR (ECR) is greater than 20 kbps. This result should apply to any shared system, and for this EDGE system, phone performance is consistent for utilization less than 0.95. The essential point here is that, using our theory and simulation results, we show that the dimensioning of various shared systems with per-user queues and mixed user workloads can be understood using the following simple rules: a) ESR (ECR) for all groups is determined by total utilization for a shared system; b) For a given user workload, the goodput depends primarily on ESR (ECR), and at high ESR (ECR), the goodput is relatively constant and equals the intended offered user rate; c) The ratio of goodputs determines the dimensioning trade-off between high-load and low-load users. This ratio can change as the goodputs change.
TABLE I SIMULATION PARAMETERS
Channel
Variable rate (220 kbps avg.)
Backbone propgn. delay
120 ms rtt
TCP window size / MSS
64 KB / 512 B
Web file size distribution, (min 200B, max 50000 B) Body Lognormal (m=7.881,s=1.339) Web file size (B) Tail Pareto(k=34102,α=1.177) No of files per page Pareto (k =2,α=1.4), max 10 Web OFF time dist. (s)
Pareto (k=2, α =1), 900 max
Web: avg. active user rate Phone page size (min 200B, max 5000B) Phone OFF time dist. (s) Phone: avg active user rate
9 kbps Lognormal (m=6.0,s=1.25 ) Pareto (k=2, α =1), 600 max 0.65 kbps
IV. CONCLUSION We have addressed the issues of different user workloads in wireless data networks. We have studied the performance of a shared packet wireless EDGE system with interactive Web and phone users. We show that the dimensioning and capacity of the system depends on simple rules based on average traffic statistics. As network utilization increases, the goodput per user decreases due to the interactive nature of the traffic, and the amount of performance degradation depends on the user workload. With per-user queueing, the performance of users with light workloads remains consistent for a wider range of utilization compared to users with a higher workload. REFERENCES [1] T. Kunz et al, “WAP traffic: Description and comparison to WWW traffic", in Proceedings of the Third ACM International Workshop on Modeling, Analysis and Simulation of Wireless and Mobile Systems, (MSWiM 2000), Boston, USA, pp. 11-19, August 2000. [2] M. Sreetharan and R. Kumar, “Cellular Digital Packet Data,” Artech House, 1996. [3] P. Barford and M. Crovella, “Generating representative web workloads for network and server performance evaluation,” Proc. 1998 ACM SIGMETRICS Intl. Conf. On Measurement and Modeling of Computer Systems, pp. 151-160, July 1998. See also: “A performance evaluation of hyper text transfer protocols,” Boston University Technical Report BU-TR-98-016, Oct 27, 1998. ( http://www.cs.bu.edu/techreports ). [4] N. K. Shankaranarayanan, Zhimei Jiang, and Partho Mishra, “UserPerceived Performance of Web-browsing and Interactive Data Applications in TDMA Packet Wireless Networks,” Multiaccess, Mobility and Teletraffic for Wireless Communications: vol. 5, pp. 73-84. Kluwer Academic Publishers, December 2000. [5] Z. Jiang, L.F. Chang, and N. K. Shankaranarayanan," Providing multiple service classes for bursty data traffic in cellular networks," Proc. of IEEE INFOCOM 2000., Vol 3, 2000, pp. 1087 -1096. [6] X. Qiu et al, "Supporting integrated voice and data traffic over EGPRS," Proc. IEEE Intl. Conf. on Commun. (ICC '01), Vol 6, 2001, pp. 1748 -1753.
889
ON
ON
OFF
ON
OFF
ON
OFF
time
= HTTP request and TCP connection establishment = HTTP request for additional files from same server
Fig. 1. ON/OFF model for interactive traffic
200
350
Phone users
300
Effective serving rate (kbps)
65% utilization 96% utilization
250 200 150 100 50
Web
180
Phone
160 140 120 100 80 60 40 20
0
0 0
10
20
30
0
0.2
0.4
Web users
0.6
0.8
1
Utilization
Figure 2. EDGE simulation results: a) Web & phone user mix that can be supported at normal and high utilization. b) Effective serving rate v. total utilization for phone and Web users
10
10 Goodput per user (kbps)
Average ON time (secs)
Web
8
Phone
6
4 2
0
8 6 Web Phone
4 2 0
0
0.2
0.4
0.6
0.8
1
0
Utilization
0.2
0.4
0.6
Utilization
Figure 3. EDGE simulation results for Web and phone user groups. a) Average ON time, and b) Goodput per user (user rate) v. utilization
890
0.8
1