pay the provider, this one must also be able to guaranty a ... be the best ratio performance/price. ... have the cluster of hosts and an instrumented application.
Performance of MPI parallel applications S. Richard
B. Miegemolle J.M. Garcia T. Monteil LAAS-CNRS 7 avenue du Colonel Roche 31077 Toulouse, France {srichard,bmiegemo,jmg,monteil}@laas.fr
Abstract The study of the performance of parallel applications may have different reasons. One of them is the planning of the execution architecture to guaranty a quality of service. In this case, it is also necessary to study the computer hardware, the operating system, the network and the users behavior. This paper proposes different models for those based on simulation. First results of this work show the impact of the network and the necessary precision of communication model in small grain parallel applications.
1. Introduction The development of network creates many new remote services. One of the models for remote access is ASP (Application Service Provider). Providers allow users to connect to their resources. Those could be softwares, data or services in general. The provider must have a set of computers to satisfy the customers requests. If the customers pay the provider, this one must also be able to guaranty a quality of service. Nowadays, the clusters of hosts seem to be the best ratio performance/price. In this case, providers need to buy enough hosts to satisfy the quality of service. For economical reasons, the size of the cluster should be as small as possible. Then the difficulties are to express the behavior of the customers, the need of resources for the applications, the power of the computers and of the network. This paper explains a way to find a solution to this problem. It is based on simulations. First, customers behavior will be modeled, then a model of parallel applications will be explained, and finally network and hosts will be described. Simulations and real executions results will be compared.
2 Related work Three main technics are currently used in performance evaluation of complex systems: benchmarks, simulations
and analytic methods. Those technics give different quality of prediction, execution time, simplicity of utilization and building of models.
2.1
Benchmarks
In this case, measures of performance of real applications on real resources are done. The results of those measures are accurate. Nevertheless, those methods need to have the cluster of hosts and an instrumented application. The problem of execution time can exist if a long-time application is considered. This method is used for example in the Standard Performance Evaluation Corporation [13].
2.2
Simulation
To simulate a system, first it is necessary to create a model of this system. Then the study of the behavior of the model is done under different loads. This concept is very general. The difficulties are to find the good level of description to analyze all the information given by the simulation and to have a correct execution time of the simulation. PACE (Performance Analysis and Characterization Environment [14][11] or OPNET [12] are examples of this technic. PACE is based on three models arranged in different levels: application model, communication model and hardware model.
2.3
Analytic model
A mathematic model expresses the simplified behavior of the system. The resolution of the created equations is rapid but the scope of the possible problems modeled by this technic is small. Some methods are based on stochastic models [3][10][9] but it is difficult to consider a cluster of hosts. Recently, historic methods have been developed [1][5]. They used real execution information to create a system of equations.
2.4
DHS simulator
DHS (Distributed Hybrid Simulator) is a simulator that merges stochastic and analytic simulations [6]. It is possible to create complex queuing systems. The first use case of this tool is to do planning and performance evaluation of complex networks. An extension of this tool for parallel applications is done in this paper.
by the number of customers and the distribution of time between two requests of the same customer. Each request is defined by the type of application and the amount of work to proceed (figure 2).
3.3
Application
Master
3 The considered system 3.1
Principle
worker 1
The goal is to predict the performance of clusters of hosts used by parallel applications in an ASP access (figure 1). On a node of the cluster, different applications can be executed at the same time. A specific node of the cluster schedules the different applications on the cluster. That is the access to the cluster like classical cluster scheduler. Provider Task i Task k
CLUSTERS
Task j
worker 2
worker 3
worker i
Figure 3. Master and slave application To express the amount of resources needed by an application, it is necessary to describe its behavior. In this paper, only master and workers applications are considered (figure 3). It is an interesting case because it is easy to implement real applications with this behavior, the modification of the number of workers and their work can validate different cases of resource utilization. The access to the resources are modeled with an automat (figure 4). Its states are:
Task l
Application scheduler
• UNDEFINED : application is not started, • IN : task needs to read data from network,
Task m task n
• OUT : task needs to send data, Customers
• LOAD : the memory image of the process must be loaded in memory,
Figure 1. ASP System
• DISK : task accesses to the disk,
3.2
Customers model Ci Rj
Request j of customer i
• CPU : task needs to use the processor, • SWAP : the real memory is full, swap action must be started,
Time of treatment new request
• END : the application is finished.
end of request
C1 R1 C1R2
C2 R1
C2 R2 C1 R2
C2 R1
C1 R1
C2 R2
Time
3.4 Figure 2. Behavior of the customers A customer sends different requests to the provider at different times. The different requests are considered to be independent. For example, the customer can request the execution of different applications. He can also not wait for the end of an already mapped application before asking to run a new one. So the work asked to the provider is defined
Communication
Two types of communications exist in ASP for parallel applications: • communications between the different customers and the provider scheduler, • communications between the tasks of the parallel applications.
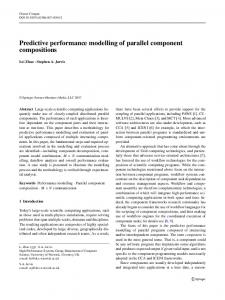
tries to write with a system call into the sender buffer. The application is stopped until the whole message is written into the buffer. The buffer is read by TCP Protocol process. For the reception, when a reading is done by the application, LAM-MPI uses a “system call read” to collect all the parts of the message in the receiving buffer (figure 5). This mechanism has a real impact on performance of parallel applications.
UNDEFINED
IN
SWAP
LOAD
3.5
DISK OUT CPU END
Figure 4. States of tasks For the first one, an direct IP protocol like TCP [7][8] could be enough. For the second one, message passing libraries are used in most cases. MPI is the most famous one [4]. It is possible to have different types of communications: blocked or not, synchronous or not, buffered. The MPI norm has different implementations with different behaviors. LAM-MPI [2][15] has be chosen in this paper. Three different protocols are used by LAM-MPI:
The hardware of an host is modelised with a queuing system. First, the network interface uses two queues, one for input and another one for output. Processor and disk resources are defined with two other queues with a round robin policy. Those policies approximate the real schedule of a processor and a disk. A counter is used to create swap when the real memory is full. Then some disk accesses are created. A supervisor is created to manage the access to the different queues by a task of an application. (figure 6)
A A supervisor
A3 A1
Receiver
(a)
(c) Message 1
Disk
Output interface
Host model
network interface
A
• short message: the heading and the data are sent at the same time. The receiver sends back an acknowledgement.
Sender
A2 Processor
Input interface
• long message: the exchange is done in two steps. First, the sender sends the heading of the message, then the receiver sends back an acknowledgement, and finally the sender sends the data.
• short synchronous message: the heading and the data are sent at the same time and no acknowledgement is sent by the receiver.
Host and operating system
Application
TCP packet
Figure 6. Host model
3.6
The global system
The full simulated system is divided into four parts: the customers, the global scheduler, the network and a set of hosts (figure7).
(b)
sending buffer
receiving buffer
Figure 5. Buffers of TCP LAM-MPI uses an interface call RPI (Request Progression Interface) to connect TCP protocol. It is a way to control the different speeds between the application and TCP protocol. A buffer for the sender and the receiver are created. When LAM-MPI requests a blocked sending, it first
4 Simulation 4.1
The parameters
The number of tasks in an application and the grain of the application are changed. The goal is to validate the host model and to show the impact of the network. Three types of models are used for the network. The first one called “simu 1Gb/s” only expresses that the maximum bandwidth
Out
Out
Source In
In
customer node
Network
scheduler
A A supervisor
A A supervisor
A2 Processor
Input interface
A3
A3 A1 Output interface
A2 Processor
Input interface
A1
Disk
Disk
Output interface
Host model
Host model
network interface
network interface
Figure 7. Global system of a 1 Gb/s Ethernet network is 1Gb/s. The second one called “400 Mb/s” expresses that on a 1 Gb/s Ethernet network the measured bandwidth is 400 Mb/s. The last one implements the real TCP protocol on a Linux operating system (management of interruptions, packet building, acknowledgement, etc).
4.2
Coarse grain applications
Size of messages 10Ko
Number of iterations 200
Master computation time 66
Worker computation time 275
Figure 9. Coarse grain application: error
4.3
Middle grain applications
Size of messages 10Ko
Number of iterations 20000
Master computation time 66
Worker computation time 275
Table 2. Parameters
Table 1. Parameters
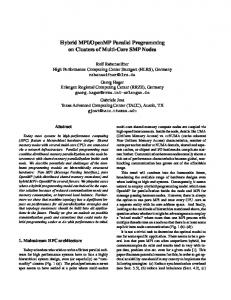
Figure 10. Medium grain application: execution time Figure 8. Coarse grain application: execution time The number of communications is increased (table 2). The parameters of this simulation are shown in 1. A real execution on a cluster of Pentium IV under Linux kernel hosts and a simulation of this system are done. The simulation and the real execution give the same results with an error under 2.75 % (figure 8, 9). The simple “simu 1Gb/s” network is enough. Only 5 workers are necessary to obtain the best execution time. This result is also given by the simulation. In fact, the network has no impact and the test only shows that the simulation of the host and its operating system is correct.
On the real execution, a speed up is obtained until 5 tasks (figures 10, 11). After, the time of the application increases because of the time spent by the processor to manage the communications. In this test, a difference between the three simulation network models appears. Only the model with the TCP stack and his impact on processor load follows exactly the real execution. Nevertheless the difference is not too important, less than 16% for 8 tasks, and all the simulations detect that after 5 workers, the performances are worse.
Figure 13. Small grain application: error Figure 11. Medium grain application: error
4.4
For the complete simulation of TCP stack over 3 workers, the simulation is longer than a real execution but it is necessary to recover the real behavior of the parallel application.
Small grain applications
The goal of this simulation is to load the network enough to create a bottleneck (table 3). In this test, there is a gain of parallelism until 3 tasks, after the network slows down the whole application. This fact is only detected with the simulation using the TCP stack. The two other simulations give results far away from the real behavior of the real parallel execution (figures 12, 13). Size of messages 10Ko
Number of iterations 200000
Master computation time 66
Worker computation time 275
Table 3. Parameters Figure 14. Execution time of the simulation
5 Conclusion
Figure 12. Small grain application: execution time
4.5
Simulation and performance
An important aspect is the time needed to obtain results from simulations compared to a real execution of the parallel application. The figure 14 compares the execution of different experimentations. The simple simulation of the network gives a better execution time than real execution.
The models of hosts, operating system and network created in this paper show a good behavior compared to real execution of a parallel application. It expresses the contention for processor and disk access. For the network, the different models have shown that if the application spend most of the time in computing, it is not necessary to use an accurate model of network. If network could be a bottleneck for the parallel application, it is necessary to model precisely what happens in the network. Some important mechanisms are the utilization of the processor by the TCP stack, the limited size of the sender and receiver buffer and the utilization by MPI library of the TCP protocol. Some works must be done to decrease the execution time of the simulator. Two ways are explored. The first one is to parallelize the simulator and the second one is to use analytic models of TCP.
References [1] D. Bacigalupo, S. Jarvis, L. He, D. Spooner, D. Dillenberger, and G. Nudd. An investigation into the application of different performance prediction methods to distributed enterprise applications. The Journal of Supercomputing, 34(2):93–111, 2005. [2] G. Burns, R. Daoud, and J. Vaigl. LAM: An Open Cluster Environment for MPI. In Proceedings of Supercomputing Symposium, pages 379–386, 1994. [3] P. Denning. Operating Systems Theory. Prentice Hall, 1990. [4] M. P. I. Forum. Mpi: A message-passing interface standard. International Journal of Supercomputing Applications, 8(3/4), 1994. [5] M. Goldszmidt, D. Palma, and B. Sabata. On the quantification of e-business capacity. In ACM Conference on Electronic Commerce (EC 2001), Florida, USA, October 2001. [6] H. Hassan, J. Garcia, and O. Brun. Internet traffic modeling. In 2nd IEEE International Conference on Information and Communication Technologies: from Theory to Applications (ICTTA’06), Damas, Syrie, Avril 2006. [7] I. S. Institute. Dod standard transmission control protocol. Technical report, University of Southern California, 1980. [8] I. S. Institute. Transmission control protocol. Technical report, University of Southern California, 1981. [9] K. Kant. Introduction to Computer System Performance Evaluation. McGraw-Hill, inc, 1992. [10] L. Kleinrock. Queueing Systems. Vol. 1: Theory. Wiley, 1975. [11] G. Nudd, D. Kerbyson, E. Papaefstathiou, S. Perry, J. Harper, and D. Wilcox. Pace - a toolset for the performance prediction of parallel and distributed systems. International Journal of High Performance Computing Applications, 14(3):228–251, 2000. [12] Site web d’opnet, http://www.opnet.com. [13] Standard performance evaluation corporation. [14] D. P. Spooner, J. Cao, S. A. Jarvis, L. He, and G. R. Nudd. Performance-aware workflow management for grid computing. Comput. J., 48(3):347–357, 2005. [15] J. M. Squyres and A. Lumsdaine. A Component Architecture for LAM/MPI. In Proceedings, 10th European PVM/MPI Users’ Group Meeting, number 2840 in Lecture Notes in Computer Science, pages 379–387, Venice, Italy, September / October 2003. Springer-Verlag.