(IJACSA) International Journal of Advanced Computer Science and Applications, Vol. XXX, No. XXX, 2013
Physical Activity Identification using Supervised Machine Learning and based on Pulse Rate Mobyen Uddin Ahmed
Amy Loutfi
Centre for Applied Autonomous Sensor Systems Örebro University Örebro, Sweden
[email protected]
Centre for Applied Autonomous Sensor Systems Örebro University Örebro, Sweden
[email protected]
Abstract— Physical activity is one of the key components for elderly in order to be actively ageing. Pulse rate is a convenient physiological parameter to identify elderly’s physical activity since it increases with activity and decreases with rest. However, analysis and classification of pulse rate is often difficult due to personal variation during activity. This paper proposed a CaseBased Reasoning (CBR) approach to identify physical activity of elderly based on pulse rate. The proposed CBR approach has been compared with the two popular classification techniques, i.e. Support Vector Machine (SVM) and Neural Network (NN). The comparison has been conducted through an empirical experimental study where three experiments with 192 pulse rate measurement data are used. The experiment result shows that the proposed CBR approach outperforms the other two methods. Finally, the CBR approach identifies physical activity of elderly 84% accurately based on pulse rate. Keywords—Physical activity, Elderly, Pulse rate, Case-based Reasoning (CBR), Support Vector Machine (SVM) and Neural Network (NN)
I.
INTRODUCTION
Physical activity or moderate exercise is one of the key components for elderly in order to stay active and maintain a longer life. Research has shown that exercise brings a greater benefit for physical capacity. That means, the elderly who are physically active considering a moderate level of exercise promote improved health than over the elderly who do not exercise but are “physically active” (in motion) throughout the day [15]. Similarly, by doing physical exercise one can control or manage the chronic diseases such as heart disease, stroke, diabetes [16], [17] and also for mental health [18]. Today, most common way of measuring the physical activity is by using accelerometer technology i.e. motion sensors are mounted on the users’ wrists, waist, and ankles [19], [20], [21]. However, using accelerometers, physical activity can be measured while persons are performing regular household work but composite activities (i.e. exercise) such as running or playing tennis is still a challenge and the exact placements of sensor is also an issue while considering its potential sensitivity [19]. Similarly, concurrent and overlapping activities are also not easy to measure based on accelerometer signals, such as brushing teeth and walking [22]. In addition, the measurements using an accelerometer do not provide
indications of an individual’s biomedical signals such as pulse rate or heart rate. Pulse rate has an effect with physical activity i.e. pulse rate increases with activity and vice versa [23] [24] [40] [41]. However, analysis and classification of pulse rate for a specific person is often difficult due to large individual variation while doing exercise. For example, pulse rate can be fluctuated between 65 and 90 for one person and for other it can be between 90 and 110. Again, pulse rate can be increased and decreased sharply for one person and for other person it can be changed steadily. So, it is not so easy to classify and identify physical activity using only on a simple threshold or any general rules. Thus, the application domain requires a machine learning algorithm that can identify personalized elderly’s physical activity based on pulse rate data. Today, supervised machine learning algorithm is a hot topic in Artificial Intelligence (AI) and commonly applied to classify physiological sensor signals data. The main goal of the supervised machine learning algorithm is to build a model based on a set of training samples paired with the corresponding labels of those samples. This model is then used to assign class labels on a set of testing samples where the class label is unknown. [11][12]. However, to identification of appropriate algorithm for a particular classification problem is one of the main challenges. Selection of the appropriate algorithm can be done through an analysis of the application domain, but there is always an unsolved question while considering empirical experiment. Recent research also shows that many researcher have been conducted some empirical experiment on different supervised machine learning algorithms before they select and propose the best algorithm which fit well in their particular application domain [13][14][39]. This paper presents an application of a supervised machine learning algorithm in order to classify physical activity of elderly. To handle the complex data processing, first a feature extraction and selection are performed on the raw data. The raw data is labelled according to the control of the measurements. The extracted features together with their class labels are then applied in three supervised machine learning algorithm to classify physical activity. The algorithms are: 1) Case-based Reasoning (CBR), 2) Support Vector Machine (SVM) and 3) Neural Network (NN). The classification
1|P a g e www.ijacsa.thesai.org
(IJACSA) International Journal of Advanced Computer Science and Applications, Vol. XXX, No. XXX, 2013
accuracy has been evaluated considering the three experimental data sets with 192 controlled pulse rate measurements data. According to the experiment result, CBR approach has been selected to identify physical activity of elderly based on pulse rate as it outperforms the popular SVM and NN techniques. Here, the obtained sensitivity, specificity and overall accuracy for the CBR approach were 87%, 85% and 86% respectively. Finally, 12 measurements with unknown class are evaluated by applying the proposed CBR approach to identify physical activity of elderly based on pulse rate. According to the experimental work, the CBR system was able to identify the physical activity 84% accurately. The rest of the paper is organized as follows: Section 2 presents the materials that are the data collection procedure and the feature extraction from the sensor signal. Section 3, describes the approach and methods, and namely presents three supervised machine learning algorithms. The experimental work is presented in section 4, here; the comparison between the three supervised machine learning algorithms is presented. Section 5 discusses the evaluation result of the identification of physical activity using CBR approach. Finally, Section 6 ends with the summary and concluding the remarks. II.
MATERIALS
To classify physical activity using supervised machine learning algorithm elderlies’ pulse rate has been used as a physiological measurement. Several features have been extracted from each pulse rate sensor signal before the classification scheme. Each signal has been labelled according to the procedure of the data collection. A. Data Collection Pulse rate measurement data were collected using a wearable sensor called Wristox2. Wristox2 is simple and can easily be integrated on the body which offers a continuous data through Bluetooth communication. In total, 192 pulse rate measurements were collected from 24 elderlies where a ‘three phases’ procedure is applied in order to collect data and the procedure is adapted from previous study [25].
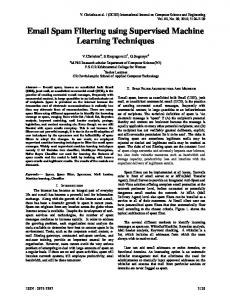
physical activity: walk briskly or running and 3) relax: sit down and try to be relaxed. Thus the 192 measurements of pulse rate are controlled and labelled with the names of phases. Finally, each class (i.e. deep breath, physical activity and relax) contains 64 pulse rate measurements. An example of pulse rate measurement collected from two subjects is presented in Fig 1. As can be seen from Fig 1, the pulse rate is changing between resting and doing exercise. It can be also observed that the changes are very personal, subject 1 (blue colour) has steady changes and subject 2 (red colour) has sharp changes while they are doing exercise. Moreover, the pulse rate of subject one lies between 70 and 90 bpm whereas, for subject 2 it lies between 65 and 126 bpm. B. Features Extraction The feature extraction from the sensor signal and feature selection has been conducted with close collaboration of domain expert. Here, time, frequency and time-frequency domains have considered to extracted features. In the time domain, statistical features namely maximum value, arithmetic mean and standard deviation of data were considered. To calculate frequency domain features, first the power spectral density was calculated from squared amplitude of Discrete Fourier Transform value of data using Fast Fourier Transform algorithm and scaling it to sampling frequency range which is 1 Hz in this case. Zero padding of data was done so that number of data samples became power of two for applying Fast Fourier Transform algorithm. From the power spectral density Low frequency power, High frequency power, Low frequency power to High frequency power ratio, were calculated [26]. The frequency between 0.04 Hz and 0.15 Hz was considered as Low frequency and frequency between 0.15 Hz and 0.4 Hz was considered as High frequency [26]. The power in High and Low frequency region was calculated by numerical integration of Power Spectral Density of the corresponding frequency range. The unit of power spectrum density and power for the pulse rate were BPM (beats per minute) Hz-1 and BPM2 respectively. Similarly, in timefrequency domain features, a discrete wavelet transform (DWT) is performed since it can keep the information of both time and frequency. Statistical features of the maximum, arithmetic mean and standard deviations were calculated from the approximation coefficient of wavelet decomposition of level 1 [27]. The function ‘Daubechies 2’ was used as the mother wavelet. The continuous wavelet transform linked to mother wavelet ψ (t ) can be defined by the equation 1. ∞
W ( a , b) =
∫ y(t )ψ
ab
(t )dt
(1)
−∞
where y(t ) is any square integral function and a, b are scaling and translation parameters respectively. Evaluating the continuous wavelet at dyadic interval the signal can be expressed by the equation 2. Fig. 1.
Example of pulse rate changes between activity and relax state.
Each subject is asked to place the sensor (i.e. WristOx2 sensor) in their finger and follows the phases. The phases are: 1) deep breath: inhaling with nose and exhaling with mouth, 2)
y (t ) =
∞
∞
∑ ∑d
j
( k ) 2 j / 2ψ ( 2 j t − k )
(2)
k = −∞ j = −∞
where
d j is
the discrete wavelet coefficient of the signal y(t ) .
2|P a g e www.ijacsa.thesai.org
(IJACSA) International Journal of Advanced Computer Science and Applications, Vol. XXX, No. XXX, 2013
Symmetric padding was used to make the data samples power of two to implement discrete wavelet transform [27]. Thus, 9 features from the pulse rate sensor signal are calculated considering the three domains and each measurement is classified according to the condition of the data collection procedure that is the measurements are labelled as deep breath, physical activity and relax. III.
APPROACH AND METHODS
To identify physical activity of elderly, three supervised machine learning algorithms have been used to classify elderlies’ pulse rate measurements. The approach of the classification scheme is presented in Fig 2. Here, pulse rate measurements come from a Wristox2 sensor and the measurements have been applied as an input of the classification scheme. Input Data preposs essing and artifact handling
Pulse rate comes from Wristox2 sensor Fig. 2.
Feature extraction considerin g time, frequency and timefrequency domains
Supervised machine learning algorithms that is CBR, SVM and NN
Output Physical activity classificati on
General approch of classification scheme of pulse rate.
Each measurement is then prepossessed and handled artifact. Here, erroneous data values caused by a loose collection are identified and replaced by the previous samples. The clean measurements are then used to extract a set of various features considering time, frequency and timefrequency domains discussed earlier. The extracted features are sent into three machine learning algorithms where each of them classifies separately. Finally, the classification as output is used for experimental work. A. Case-based Reasoning (CBR) Learning from past experience and solve new problems by adapting similar previously solved cases is a cognitive model based on how humans often solve a large group of problems. A requirement is that the similarity of the case also indicates how easy the solution can be adapted to the current situation and reused. New Problem
retrieve
Similar Cases
retain Case library Used Solution Case
revise
reuse Proposed Solutions
Fig. 3. CBR cycle. Adapted from [28]
problem applying previous experiences, which is more common for doctors, clinicians or engineers. CBR has been applied successfully when the domain theory is not clear enough or even incomplete. It is getting increasing attention from the medical domain since it is a reasoning process that also is medically accepted [30] [31] [32] [33] [34] [35] [36] [37][42][43][44]. For example, a clinician/doctor may start his/her practice with some initial experience (solved cases), then try to utilize this past experience to solve a new problem and simultaneously increases his/her case base. So, this method is getting increasing attention from the medical domain since it is a reasoning process that also is medically accepted. Aamodt and Plaza has introduced a life cycle of CBR [28] with four main steps as shown in Fig. 3. Retrieve, Reuse, Revise and Retain present key tasks to implement such kind of cognitive model. In the retrieval step, for any new problem the system tries to retrieve the most similar case(s) by matching previous cases from a case base. If it finds any suitable case that is close to a current problem then the solution is reused (after some adaptation and revision if necessary). Similarity of a feature value between two cases (i.e. a target case and one case from library) was measured using the normalized Manhattan distance between the feature values of two cases. An example of case base is show in Table I, where a new case is being matched with Cases 1 and 2 from the case base by using a function illustrated in equation 3. n
∑w sim ( T , S ) =
i
× sim ( Ti , S i )
(3)
i n
∑w
i
i
TABLE I.
AN EXAMPLE OF CASE REPRESENTATION Problem description (input features)
Cases F1 Case 1 104 Case 2 87
.. ..
.. ..
F2
F3
F4
F5
F6
F7
F8
F9
90.85 5.75 222.32 65.20 3.409 146.27 128.47 8.42 74.53 5.962 199.37 51.53 3.868 119.85 105.62 8.019
.. ..
.. ..
.. ..
.. ..
.. ..
.. ..
.. ..
.. ..
Case 107 102.85 3.182 252.19 74.77 3.333 151.25 145.89 4.545 192
Solution description (output class) deep breath relax
.. .. physical activity
Similarity between two cases is then measured using the weighted average of all the features that are to be considered. The function for calculating similarity between two cases T and S with n features is presented in equation 4, where wi is the weight of the feature i defined by expert of the domain. Note that, in the weight vector wi is also considered the weight of three domains (i.e. time, frequency and time-frequency features). Non numeric features such as gender is converted to numeric value by substituting the contextual value with a numeric one (1 for male, 0 for female). The Manhattan distance function is used to calculate the similarity of a feature between two cases. The function is illustrated in equation 4 where Ti and Si are the i-th feature values of target and source case respectively.
A case-based reasoning (CBR) [28],[29] approach can work in a way close to human reasoning e.g. solves a new
3|P a g e www.ijacsa.thesai.org
(IJACSA) International Journal of Advanced Computer Science and Applications, Vol. XXX, No. XXX, 2013 sim( T i , Si ) = 1 −
Ti − S i max{ Ti , Max ( i )} − min{ Ti , Min ( i )}
(4)
Here, Max(i) and Min(i) represents the Maximum and Minimum value of the feature i obtained from whole case library. Then “max” and “min” functions compare the values between the new case feature Ti and Maximum and Minimum values obtained from the case library. The function returns 1 if the values are the same and returns 0 if the values are dissimilar. This is known as a local similarity function. B. Support Vector Machine (SVM) Support Vector Machine (SVM) is a supervised machine learning that analyses data and identifies pattern and commonly used for classification and regression analysis [1][2][3][4]. Traditionally, SVM algorithm is designed for binary or two-class classification. Providing a training data set with output class where each sample belongs to one of two classes, the SVM training algorithm builds a model that classifies a new example into one class or the other.
Training steps Pulse rate as Training data
to model complex relationships between inputs and outputs [38] NN is a network system with many simple processors where the processing elements are referred to as units, nodes, or neurons. These neurons are interconnected and it receives process and transmits numeric data via the connections [7][8]. A NN works based on creating a model by training its network where it is used a set of examples samples that contains the input and its corresponding known target output. Same time, it learns by comparing the network output and target output and makes adjustments on the weights (connections between neurons) in order to move the network outputs closer to the targets. Here, to identify physical activity, this paper applied a feed-forward neural network where the NN is trained by the back propagation algorithm. The NN model is illustrated in Fig 5.
Fig. 5. NN model to identify physical activity based on elderie’s pulse rate.
Data Preposses sing
Feature Extraction
SVM Training
Model Classifier
As can be seen in Fig 5, there are 9 features considered as input, 25 hidden neurons, and 3 output neuron with 3 final outputs (i.e. deep breath, physical activity and relax classes). IV.
Testning steps Pulse rate as Testing data
Data Preposses sing
Feature Extraction
Activity Classification
Fig. 4. Training and testing steps of activity classification using SVM.
In linearly separable data, the SVM works based on a distance value between the hyperplane and the two data classes. However, to handle non-linearly separable data, a kernel function [5] could apply where it is used to map nonlinearly separable data onto a feature space for classification. Some popular kernel functions that commonly used are linear, polynomial, RBF and sigmoid [6]. However, when there are more than 2 classes (i.e. in our study it is 3 classes), one of the common approach is to used one-versus-all classifiers (also known as “one-versus-rest”), where the target class is determined by choosing the class that is selected by the largest y ∈ 1, 2 ,3,...., k with classifiers, that is, let
Θ
(1 )
,Θ
(2)
,Θ
(3)
,....., Θ
(k )
and class i will be selected
( )
(1) T
x . Fig 4 presented the training and with the largest Θ testing steps. The pulse rate data was pre-processed and features are extracted both for training and testing data. But training data has been used to build a classifier model based on SVM training. Finally, the testing data is used to measure the performance of the model. C. Neural Network (NN) Neural Network (NN), is another supervised machine learning inspired by biological neural network, is widely used
EXPERIMENTAL WORK
The main objective of this experimental work is to find best classification algorithm among the three supervised machine learning methods i.e. CBR, SVM and NN. This experimental work also presented a comparison on this three supervised machine learning methods and finally selects the best method to identify physical activity. For this experimental work, there are 192 cases with three classes (i.e. Deep breath, Activity, Relax) have been used where each case is consist of nine features. These 192 cases are then divided into two sets randomly; the training data set contain 162 cases and the test set contains 30 cases. Thus the experimental work has been conducted with three experiment data sets and they are named as LibraryA and TestA, LibraryB and TestB, LibraryC and TestC. The cases are selected as randomly, however, test sets are containing different cases that mean if a case belongs to one test set then the case is not considered again for another test set. A. Using Case-based Reasoning (CBR) The classification accuracy of the CBR retrieval classification scheme has been evaluated by developing a prototypical system where the main goal of the experiment is to see how accurate the CBR approach can classify with the extracted features from the signals. The experimental work has been conducted in two phases. In first phase, the training data sets i.e. LibraryA, LibraryB and LibraryC are used to train the CBR classification scheme where weight of the features are adjusted manually to achieve maximum accuracy. Here, for the retrieval, a “leave-one-out” retrieval technique is used i.e. one case is taken from the case library (i.e. 162 cases) as a query case and then the system retrieves the most similar
4|P a g e www.ijacsa.thesai.org
(IJACSA) International Journal of Advanced Computer Science and Applications, Vol. XXX, No. XXX, 2013
cases. Among the retrieved cases, top similar case is considered, if the top case’s class is matched with the query case class then we count the correctly classification as 1. In second phase, same procedure is used but the testing data sets are used as in query. This means TestA is evaluated while considering LibraryA; TestB is evaluated while considering LibraryB and TestC is evaluated while considering LibraryC. The percentage of the correctly classification are presented in Table II. TABLE II.
classes i.e. Deep breath, Activity and Relax. Here, the accuracy value shows that the CBR approach can achieve the classification accuracy between 80 and 90 percentages for all the test data sets.
PERCENTAGE OF CORRECTLY CLASSIFICATION USING CBR Training
Experiments
Datasets
Testing
Accuracy
Datasets
Accuracy
Expriment 1
LibraryA
≈ 85%
TestA
≈ 80%
Expriment 2
LibraryB
≈ 90%
TestB
≈ 87%
Expriment 3
LibraryC
≈ 86%
TestC
≈ 90%
≈ 87%
In 3 Test sets
≈ 86%
Avarage
In 3 Libraries
It can be seen from table II, the accuracy of the CBR approach has been achieved for LibraryA, LibraryB and LibraryC are 85%, 90% and 86% respectively. Similarly, on testing data sets, the accuracy of the CBR approach has been achieved for TestA, TestB and TestC are 80%, 87% and 90% respectively. Moreover, the average accuracy on training data sets is 87% and for testing data sets is 86%. The confusion matrix of the testing data sets i.e. TestA, TestB and TestC are presented in Table III, Table IV and Table V. TABLE III.
CONFUSION MATRIX BASED ON TESTA USING CBR CLASSIFICATION
Activity
Relax
Deep breath
8 (80%)
Deep breath
0
2 (20%)
Activity
2 (20%)
8 (80%)
0
Relax
1 (10%)
1 (10%)
8 (80%)
TABLE IV.
Experiments
CLASSIFICATION
Activity
Relax
Deep breath
9 (90%)
1 (10%)
0
Activity
1 (10%)
9 (90%)
0
Relax
2 (20%)
1 (10%)
8 (80%)
TABLE V.
CLASSIFICATION
Deep breath Activity Relax
Activity
Relax
9 (90%)
1 (10%)
0
0 1 (10%)
9 (90%) 0
1 (10%) 9 (90%)
Fig 6 illustrated the performance of the CBR approach while classifying the elderlies’ pulse rate data into three
PERCENTAGE OF CORRECTLY CLASSIFICATION USING SVM Training Datasets
Accuracy
Testing Datasets
Accuracy
Expriment 1
LibraryA
≈ 89%
TestA
≈ 63%
Expriment 2
LibraryB
≈ 73%
TestB
≈ 53%
Expriment 3
LibraryC
≈ 74%
TestC
≈ 70%
≈ 79%
In 3 Test sets
≈ 62%
Avarage
CONFUSION MATRIX BASED ON TESTC USING CBR Deep breath
B. Using Support Vector Machine (SVM) Support Vector Machine (SVM) is applied on the same training (LibraryA, LibraryB and LibraryC) and testing (TestA, TestB and TestC) data sets. The classification accuracy of the SVM classification scheme has been evaluated where the main goal of the experiment is to see how accurate the SVM approach can classify with the extracted features from the signals. Here, the training session has been performed base on the training data set using the LibSVM tool developed by [9] on MATLAB. For the kernel, the RBF kernel function is applied as it gives better accuracy [10]. The SVM model best parameters were chosen after applying 7-fold cross validation. TABLE VI.
CONFUSION MATRIX BASED ON TESTB USING CBR Deep breath
Fig. 6. Performance of CBR classification based on three test data sets.
In 3 Libraries
As soon as the model is ready, the test data sets i.e. TestA, TestB and TestC are then evaluated and the accuracy values both for training and testing data sets are presented in Table VI. Here, the percentage of the correctly classification are presented as accuracy value. It can be seen from table VI, the accuracy of the SVM approach has been achieved for LibraryA, LibraryB and LibraryC are 89%, 73% and 74% respectively. Similarly, on testing data sets, the accuracy of the SVM approach has been achieved for TestA, TestB and TestC are 63%, 53% and 70% respectively. Moreover, the average accuracy on training data sets is 79% and for testing data sets is 62%. The confusion matrix of the testing data sets i.e. TestA,
5|P a g e www.ijacsa.thesai.org
(IJACSA) International Journal of Advanced Computer Science and Applications, Vol. XXX, No. XXX, 2013
TestB and TestC are presented in Table VII, Table VIII and Table IX.
TABLE VII.
CONFUSION MATRIX BASED ON TESTA USING SVM CLASSIFICATION
Deep breath
Activity
Relax
Deep breath
8 (80%)
0
2 (20%)
Activity
2 (20%)
5 (50%)
3 (30%)
Relax
4 (40%)
0
6 (60%)
TABLE VIII.
CONFUSION MATRIX BASED ON TESTB USING SVM CLASSIFICATION
LibraryC. Here, a feed-forward network with the default tansigmoid transfer function is used in the hidden layer and linear transfer function is used in the output layer. The number of hidden layer was fixed as 25; however, several thousand iterations have been performed to achieve a better accuracy. The minimum accuracy for the training data sets have been considered as 80% and to achieve this value, LibraryA and LibraryB are used 12800 times iteration and LibraryC is used 51200 times iteration. Thus three NN models are created based on training data sets and the test data sets are classified and evaluated. The percentage of the correctly classification in terms of accuracy value are presented in Table X. TABLE X.
PERCENTAGE OF CORRECTLY CLASSIFICATION USING NN
Deep breath
Activity
Relax
Deep breath
5 (50%)
2 (20%)
3 (30%)
Experiments
Activity
4 (40%)
5 (50%)
1 (10%)
Expriment 1
LibraryA
Relax
3 (30%)
1 (10%)
6 (60%)
Expriment 2 Expriment 3
TABLE IX.
CONFUSION MATRIX BASED ON TESTC USING SVM CLASSIFICATION
Deep breath Deep breath
9 (90%)
Activity
2 (20%)
Relax
3 (30%)
Avarage
Activity
Relax
0
1 (10%)
6 (60%) 1 (10%)
2 (20%) 6 (60%)
Fig 7 presents the performance of the SVM approach to classify elderlies pulse rate sensor signals. The accuracy values show that most of the time (i.e. in Activity and Relax classes) SVM is achieved its classification accuracy between 50% and 60%; however, it also achieved 90% accuracy while considering Deep breath class.
Training Datasets
Testing Datasets
Accuracy
≈ 80%
TestA
≈ 57%
LibraryB
≈ 83%
TestB
≈ 60%
LibraryC
≈ 84%
TestC
≈ 60%
≈ 82%
In 3 Test sets
≈ 59%
In 3 Libraries
Accuracy
It can be seen from table X, the accuracy of the NN approach has been achieved for LibraryA, LibraryB and LibraryC are 80%, 83% and 84% respectively. Similarly, on testing data sets, the accuracy of the NN approach has been achieved for TestA, TestB and TestC are 57%, 60% and 60% respectively. Moreover, the average accuracy on training data sets is 82% and for testing data sets is 59%. Considering NN the confusion matrix of the testing data sets i.e. TestA, TestB and TestC are presented in Table XI, Table XII and Table XIII. TABLE XI.
CONFUSION MATRIX BASED ON TESTA USING NN CLASSIFICATION
Deep breath
Activity
Relax
Deep breath
6 (60%)
2 (20%)
2 (20%)
Activity
1 (10%)
7 (70%)
2 (20%)
Relax
5 (50%)
1 (10%)
4 (40%)
TABLE XII.
CONFUSION MATRIX BASED ON TESTB USING NN CLASSIFICATION
Fig. 7. Performance of SVM classification based on three test data sets.
C. Using Neural Network (NN) Similarly, Neural Network (NN) is applied using MATLAB on the training sets LibraryA, LibraryB and
Deep breath
Activity
Relax
Deep breath
7 (70%)
2 (20%)
1 (10%)
Activity
1 (10%)
8 (80%)
1 (10%)
Relax
4 (40%)
3 (30%)
3 (30%)
TABLE XIII.
CONFUSION MATRIX BASED ON TESTC USING NN CLASSIFICATION
Deep breath
Deep breath
Activity
Relax
8 (80%)
1 (10%)
1 (10%)
6|P a g e www.ijacsa.thesai.org
(IJACSA) International Journal of Advanced Computer Science and Applications, Vol. XXX, No. XXX, 2013 Deep breath Activity
2 (20%)
Relax
4 (40%)
Activity
7 (70%) 3 (30%)
where CBR, SVM and NN algorithms are applied. The results of percentage of correctly classification in terms of accuracy are presented in Fig 9. As can be seen from Fig 9, CBR can perform well (i.e. > 83%) in correctly classification compare to other two machine learning algorithms (i.e. SVM and NN). Similar comparison has been conducted considering the sensitivity and specificity analysis. Here, the class Deep breath and Relax are grouped together and identified as Normal group and rest of the class is identified as Activity group. Thus, Normal group contains 60 samples and Activity group contains 30 samples of pulse rate. The sensitivity and specificity analysis is presented in Table XIV.
Relax
1 (10%) 3 (30%)
TABLE XIV.
Fig. 8. Performance of NN classification based on three test data sets.
Same as CBR and SVM, Fig 8 presents the performance of the NN approch to classify the eldeires pulse rate signls. Here, the accurecy vlues for Deep breath and Activity lies between 60% and 80%, however, the cases in Relax class has been classified very poorly. According to the Fig 8, the accuracy of the Relax class was between 30% and 40%. D. Comparision on CBR vs SVM vs NN As one of the contribution of this paper is to select proper and best supervised machine learning algorithm which can be used to identify physical activity of elderly based on their pulse rate sensor signal. So, in this section, a comparison on CBR, SVM and NN is presented, here only test data sets are considered.
STATISTICAL ANALYSIS OF THE CLASSIFICATIONS
Criteria/Indices
Values using CBR
Values using SVM
Values using NN
Total cases
90
90
90
Cases belong to Activity group (P)
30
30
30
Cases belong to Normal group (N)
60
60
60
True positive (TP):
26
16
22
False positive (FP):
9
20
29
True negative (TN):
51
40
31
False negative (FN):
4
14
8
Sensitivity = TP / (TP + FN)
≈ 0.87
≈ 0.53
≈ 0.73
Specificity = TN / (FP + TN)
≈ 0.85
≈ 0.67
≈ 0.52
Accuracy = (TP+TN)/(P+N)
≈ 0.86
≈ 0.62
≈ 0.59
It can be seen from Table XIV, using CBR the sensitivity, specificity and overall accuracy are 87%, 85% and 86% respectively; using SVM the sensitivity, specificity and overall accuracy are 53%, 67% and 62% respectively; using NN the sensitivity, specificity and overall accuracy are 73%, 52% and 59% respectively. The comparison on CBR, SVM and NN considering sensitivity, specificity and overall accuracy are presented in Fig 10.
Fig. 9. Classification performance based on CBR, SVM and NN.
The three test data sets (i.e. TestA, TestB and TestC) contains 90 cases totally, among of them each class (i.e. deep breath, Activity, and Relax) consists of 30 cases. Percentage of correctly classification has been calculated for all three classes
Fig. 10. Classification performance based on CBR, SVM and NN.
7|P a g e www.ijacsa.thesai.org
(IJACSA) International Journal of Advanced Computer Science and Applications, Vol. XXX, No. XXX, 2013
According to Fig 10, using CBR the activity classification shows to be superior to SVM and NN considering sensitivity, specificity and overall accuracy which is above 85%. It can be observed that the SVM and NN have achieved their sensitivity, specificity and overall accuracy between 50% and 70%. V.
IDENTIFICATION OF PHYSICAL ACTIVITY USING CBR
Based on the experimental work, the CBR approach is selected to identify physical activity of elderly based on pulse rate. In order to evaluate the physical activity classification by the CBR system, 12 measurements have been collected from 12 subjects. Each measurement is ten minutes long in length and the subjects are asked for walk at least once i.e. one out of ten minutes. Thus, each of the 12 measurements contains physical activity between 0 to 6 times in ten minutes length data. Each case is divided in 10 windows and each of them is 1 minute long (since each case is 10 minutes long). The main objective of this work is to see whether the CBR approach can identify activity. Here, as a case library, the CBR used 192 measurement cases which is categories in 3 classes (i.e. Deep breath, Activity and Relax) discussed earlier. For the retrieval in CBR approach, top similar case is considered to calculate the classification accuracy and the results are presented in Table XV. TABLE XV.
IDENTIFICATION OF PHYSICAL ACTIVITY ON 12 PULSE RATE MEASUREMENTS
VI.
SUMMARY AND CONCLUSION
This paper presents an application of supervised machine learning algorithm to identify physical activity of elderly based on pulse rate. The pulse rate is used as a physiological parameter since it has an effect with activity that is pulse rate can be increased while performing exercise and decreased while resting. Moreover, the pulse rate sensor is very simple and can easily be integrated on the body than other physiological sensors for example ECG. The contribution of the paper is in two folds: 1) selection of a supervised machine learning algorithm which fits well in this domain 2) identification physical activity of elderly using selected machine learning algorithm and based on pulse rate. To select a supervised machine learning algorithm, this work studied the implementation of three popular classification techniques, i.e. case-based reasoning, support vector machine and neural network. The study was conducted through an empirical evaluation where three experimental libraries of data sets have been used. Each library is containing 192 pulse rate signals and there are 9 features are extracted from each signal. The feature extraction has been done by considering time, frequency and time-frequency domains. The signals are labelled in 3 classes (i.e. Deep breath, activity and relax) according to the control of data collection procedure. Considering the experimental work, a comparison has been done and presented among the three implemented machine learning algorithms, i.e. CBR, SVM and NN. The comparison between these techniques shows that the CBR model yields better results, i.e. the sensitivity, specificity and overall accuracy was above 85%. After selecting the machine learning algorithm, the CBR approach is applied in 12 unknown pulse rate measurements. According to the evaluation the CBR approach was able to identify physical activity 84% accurately, that is 26 out of 31 activities are correctly classified. Thus, the case-based retrieval classification scheme shows the possibility of the identification of physical activities of elderly. However, a comparison considering accelerometer signal with the pulse rate is needed which is now under study. In future, we would like to evaluate the proposed approach considering larger samples and want to calculate energy consumption based on pulse rate. Nevertheless, considering the evaluation result it might be worth and more reliable to use pulse rate measurements besides the accelerometer signal in order to classify physical activity of elderly.
Test_Case_id
Number of Activity
Correctly Classification
Missed Classification
Test_Case_1
4
2 (≈ 50.0%)
2 (≈ 50.0%)
Test_Case_2
6
5 (≈ 83.3%)
1 (≈ 16.6%)
Test_Case_3
0
0
0
Test_Case_4
0
0
1
Test_Case_5
1
1 (100%)
0
Test_Case_6
3
3 (100%)
0
Test_Case_7
2
2 (100%)
0
Test_Case_8
3
2 (≈ 67.0%)
1 (≈ 33.0%)
Test_Case_9
4
4 (100%)
0
Test_Case_10
2
2 (100%)
0
Test_Case_11
5
5 (100%)
0
Test_Case_12
1
0
1
Total activity in 12 test cases
ACKNOWLEDGMENT
31
26 (≈ 84.0%)
5 (≈ 16.0%)
The authors would like to acknowledge the projects named “Remote” and “SAAPHO (project reference aal-2010-3-035)” for their support of this research. Also, like to thank the participating subjects for their contributions to this work.
As can be seen from Table XV, around 84% (i.e. 26 out of 31 physical activities) is correctly classified and around 16% (i.e. 5 out of 31 physical activities) is misclassified. However, considering test_case_4, the CBR approach classified one window as activity whereas there was no activity contains in the case.
REFERENCES [1] [2] [3]
V.N. Vapnik, The Nature of Statistical Learning Theory, Springer, 1995. C. Burges, A tutorial on support vector machines for pattern recognition, Data Mining and Knowledge Discovery 2 (2) (1998) 1–47. N. Cristianini, J. Shawe-Taylor, An Introduction to Support Vector Machines and Other Kernel-based Learning Methods, Cambridge University Press, Cambridge, 2000.
8|P a g e www.ijacsa.thesai.org
(IJACSA) International Journal of Advanced Computer Science and Applications, Vol. XXX, No. XXX, 2013 [4]
[5] [6] [7] [8]
[9]
[10]
[11] [12] [13]
[14]
[15]
[16] [17]
[18]
[19]
[20]
[21]
[22] [23] [24]
[25]
C. C. Chuang, Z.-J. Lee, Hybrid robust support vector machines for regression withoutliers, Applied Soft Computing 11 (January (1)) (2011) 64–72. B. Schölkopf, A.J. Smola, Learning with Kernels, MIT Press, 2002. M. Genton, Classes of kernels for machine learning: a statistics perspective, Journal of Machine Learning Research 2 (2001) 299–312. S. Simon, Haykin, Neural Networks: A Comprehensive Foundation, Macmillan, New York, 1994. G. Zhang, Neural networks for classification: a survey, IEEE Transactions on Systems, Man, and Cybernetics Part C 30 (4) (2000) 451–462. C. Chang, C. Lin, LIBSVM: a library for support vector machine, ACM Transactions on Intelligent Systems and Technology 2 (2011) 27:1– 27:27. C.W. Hsu, C.C. Chang, C.J. Lin, A Practical Guide to Support Vector Classification, Technical Report, Department of Computer Science and Information Engineering, University of National Taiwan, Taipei, 2003, pp. 1–12. S. Kotsiantis, Supervised Machine Learning: A Review of Classification Techniques. Informatica 2007, 31:249-268. I. Witten, R. Frank, Data mining: Practical Machine Learning Tools and Techniques. Second edition. San Francisco: Elsevier, Inc; 2005. Y. J. Kumar, N. Salimb, B. Razac, Cross-document structural relationship identification using supervised machine learning, Applied Soft Computing, Volume 12, Issue 10, October 2012, Pages 3124–3131 S. Yeran , D. Yunyan, Comparison of CBR and SVM method used in the prediction of land use change in Pearl River Delta, China, International Conference on Artificial Intelligence and Computational Intelligence, 2010, PP- 8 – 12 J. S. Brach, E. M. Simonsick, S. Kritchevsky, K. Yaffe, A. B. Newman, and for the Health, Aging and Body Composition Study Research Group, The Association Between Physical Function and Lifestyle Activity and Exercise in the Health, Aging and Body Composition Study. Journal of the American Geriatrics Society, 52 (2004), 502–509 H.C. Barry, S.W. Eathorne, Exercise and aging: issues for the practitioner. Medical Clinics of North Americais, 78 (1994), 357-376. F.B. Hu, M.J. Stampfer, G.A. Colditz, A. Ascherio, K.M. Rexrode, W.C. Willett, J.E. Manson, Physical activity and risk of stroke in women. The journal of the American Medical Association, 283 (2000), 2961-2967. A. Salguero, R. Martinez-Garcia, O. Molinero, S. Marquez, Physical activity, quality of life and symptoms of depression in communitydwelling and institutionalized older adults. Arch Gerontol Geriatr, 53, (2011), 152–7. C. Lin, Y. C. Yang, J. Wang, and Y. Yang, A Wearable Sensor Module With a Neural-Network-Based Activity Classification Algorithm for Daily Energy Expenditure Estimation, IEEE TRANSACTIONS ON INFORMATION TECHNOLOGY IN BIOMEDICINE, 16, (2012) K. Taraldsena, S. F.M. Chastinb, I. I. Riphagenc, B. Vereijkend, J. L. Helbostada, Physical activity monitoring by use of accelerometer-based body-worn sensors in older adults: A systematic literature review of current knowledge and applications Maturitas, 71 (2012), 13-19. A. Mannini and A. M. Sabatini, Machine Learning Methods for Classifying Human Physical Activity from On-Body Accelerometers, Sensors, 10 (2010) 1154-1175. O. D. Lara and M. A. Labrador, A Survey on Human Activity Recognition using Wearable Sensors, I. Åstrand, P. Åstrand, and K. Rodahl, Maximal heart rate during work in older men, Journal of Applied Physiology, 14(1959), 562-566 Z. Jin, J. Oresko, S. Huang, and A. C. Cheng, HeartToGo: A personalized medicien technology for cardiovascular disease prevention and detection, in Proc. IEEE/NIH LiSSA, (2009), 80–83. M.U. Ahmed, A.M. Islam, A. Loutfi, A case-based patient identification system using pulse oximeter and a personalized health profile, workshop on CBR in the Health Sciences at 20th International Conference on Case-Based Reasoning, ICCBR12, Springer, Lyon, France , Editor(s):Isabelle B, Stefania M and Cindy M, September, 2012
[26] K. Dingli, T. Assimakopoulos, P.K. Wraith, I. Fietze, C. Witt, N.J. Douglas, Spectral oscillations of RR intervals in sleep apnoea/hypopnoea, European Respiratory, (2003), 4 [27] Cvetkovic D., Übeyli E. D., Cosic I., Wavelet transform feature extraction from human PPG, ECG, and EEG signal responses to ELF PEMF exposures: A pilot study, Digital Signal Processing, 2008. [28] A. Aamodt, E. Plaza, Case-based reasoning: Foundational issues, methodological variations, and system approaches, AI Communications, (1994) 39-59. [29] I. Watson, Applying Case-Based Reasoning: Techniques for Enterprise systems, (1997). [30] M.U. Ahmed, S. Begum, P. Funk, N. Xiong, B von. Schéele, A MultiModule Case Based Biofeedback System for Stress Treatment, international journal of Artificial Intelligence in Medicine, 2010. [31] M.U. Ahmed, S. Begum, P. Funk, N. Xiong, B von. Schéele, Case-based Reasoning for Diagnosis of Stress using Enhanced Cosine and Fuzzy Similarity, Transactions on Case-Based Reasoning on Multimedia Data, 1( 2008), 3-19. [32] S. Begum, M. U. Ahmed, P. Funk, N. Xiong, M. Folke, Case-Based Reasoning Systems in the Health Sciences: A Survey on Recent Trends and Developments, IEEE Transactions on Systems, Man, and Cybernetics--Part C: Applications and Reviews, 2010. [33] S. Begum, M. U. Ahmed, P. Funk, N. Xiong, B Von Schéele, A CaseBased Decision Support System for Individual Stress Diagnosis Using Fuzzy Similarity Matching. Computational Intelligence (CI), 25, (2009) 180-195. [34] S. Begum, M.U. Ahmed, P Funk, Case-Based Systems in the Health Sciences-A Case Study in the Field of Stress Management, WSEAS Transactions on Systems, 8 (1109-2777), pp 344-354 [35] M.U. Ahmed, S. Begum, P. Funk, A hybrid case-based system in clinical diagnosis and treatment, International Conference on Biomedical and Health Informatics (BHI), 2012 IEEE-EMBS, pp 699704. [36] M.U. Ahmed, P. Funk, A Computer Aided System for Post-operative Pain Treatment Combining Knowledge Discovery and Case-Based Reasoning, 20th International Conference on Case-Based Reasoning, ICCBR’12. [37] M.U. Ahmed, P. Funk, A Case-Based Retrieval System for Postoperative Pain Treatment, In the proceeding of International Workshop on Case-Based Reasoning CBR 2011, IBaI, Germany , New York/ USA, Ed(s):Petra Perner and Georg Rub, September, 2011, pp 30-41. [38] Z. Jin, J. Oresko, S. Huang, and A. C. Cheng, HeartToGo: A personalized medicien technology for cardiovascular disease prevention and detection, in Proc. IEEE/NIH LiSSA, (2009), 80–83. [39] K.J Kim, Financial time series forecasting using support vector machines,Neurocomputing, Volume 55, Issues 1–2, September 2003, Pages 307–319 [40] M.U. Ahmed, A. Loutfi, Physical Activity Classification for Elderly based on Pulse Rate, 10th International Conference on Wearable Micro and Nano Technologies for Personalized Health Tallinn, June 26 - 28, 2013 [41] M. U. Ahmed, H. Banaee, and A. Loutfi, Health Monitoring for Elderly: An Application Using Case-Based Reasoning and Cluster Analysis, ISRN Artificial Intelligence, vol. 2013, Article ID 380239, 11 pages, 2013 [42] M.U. Ahmed, S. Begum, P. Funk, N. Xiong, B. Schéele von. A Three Phase Computer Assisted Biofeedback Training System Using CaseBased Reasoning, In 9th European Conference on Case-based Reasoning workshop proceedings. Trier, Germany. 2008 [43] M.U. Ahmed, S. Begum, P. Funk, A hybrid case-based system in clinical diagnosis and treatment, Biomedical and Health Informatics (BHI), 2012 IEEE-EMBS International Conference on , vol., no., pp.699,704, 5-7 Jan. 2012 [44] M.U. Ahmed, P. Funk, A Computer Aided System for Post-operative Pain Treatment Combining Knowledge Discovery and Case-Based Reasoning, 20t International Conference on Case-Based Reasoning, ICCBR’12.
9|P a g e www.ijacsa.thesai.org