Article
Physical Flood Vulnerability Mapping Applying Geospatial Techniques in Okazaki City, Aichi Prefecture, Japan Andi Besse Rimba 1, *, Martiwi Diah Setiawati 2 , Abu Bakar Sambah 3 and Fusanori Miura 1 1 2
3
*
Department of Environmental Science and Engineering, Yamaguchi University, 2-16-1 Tokiwadai, Ube 755-8611, Japan;
[email protected] Integrated Research System for Sustainability Science (IR3S), The University of Tokyo Institutes for Advanced Study (UTIAS), The University of Tokyo, 7-3-1 hongo, Bunkyo-ku, Tokyo 113-8654, Japan;
[email protected] Faculty of Fisheries and Marine Science, Brawijaya University, Jl. Veteran Malang, East Java 65145, Indonesia;
[email protected] Correspondence:
[email protected] or
[email protected]; Tel.: +81-90-8600-2877 or +62-819-4440-5557
Academic Editor: Michael Peter Smith Received: 21 December 2016; Accepted: 24 January 2017; Published: 28 January 2017
Abstract: Flooding has been increasing since 2004 in Japan due to localized heavy rainfall and geographical conditions. Determining areas vulnerable to flooding as one element of flood hazard maps related to disaster management for urban development is necessary. This research integrated Remote Sensing data, the Geography Information System (GIS) method and Analytical Hierarchy Process (AHP) calculation to determine the physical flood-vulnerable area in Okazaki City. We developed this research by applying data from the Geospatial Information Authority of Japan (GSI) to generate the slope map and drainage density; AMEDAS (Automated Meteorological Data Acquisition System) from the Japan Meteorological Agency (JMA) to generate the rainfall data; Soil map from the Ministry of Land, Infrastructure, Transport and Tourism (MLIT) data; and Sentinel-2 imagery to generate the land cover map. We applied the AHP calculation for weighting pairwise the parameters by comparing five iterations of the normalized matrix. We utilized the spatial analysis tool in ArcGIS to run the pairwise comparison to adjudicate the distribution of flooding according to the AHP procedure. The percentage of relative weight was slope (43%), drainage density (20%), rainfall intensity (17%), then both infiltration rate and land cover (10%). The consistency value was reasonable: consistency index (CI—0.007) and consistency ratio (CR—0.6%). We generated high accuracy for flood vulnerability prediction; 0.88 for Probability of Detection (POD), 0.28 for Probability of False Detection (POFD), 0.44 for Critical Success Index (CSI), 1.9 for Bias, and 95 of Area under Curve (AUC). The flood vulnerability was matched to the flood inundation survey of Okazaki City in August 2008 and indicated an excellent Relative Operating Characteristic (ROC). Keywords: flood vulnerability; Analytical Hierarchy Process (AHP); Geography Information System (GIS); Remote Sensing; Probability of Detection (POD); Probability of False Detection (POFD); Critical Success Index (CSI); Relative Operating Characteristic (ROC)
1. Introduction Japan is particularly vulnerable to flooding due to its steep geography and humid climate characterized by torrential rains and typhoons [1]. Approximately 50% of the total population in Japan and approximately 75% of its assets are located in flood-vulnerable areas [2]. Moreover, the vulnerable areas are primarily in the alluvial plains [3]. The number of floods, and enhanced damage due to Urban Sci. 2017, 1, 7; doi:10.3390/urbansci1010007
www.mdpi.com/journal/urbansci
Urban Sci. 2017, 1, 7
2 of 22
flooding, have increased since 2004 [1]. Several local heavy rainfalls in Japan have been documented by Japan Meteorology Agency (JMA) [4] (e.g., in recent years: 3 July 2006 in Kumamoto; 11–17 July 2007 in Kagoshima, Miyazaki, Kumamoto; 30 August 2008 in Aichi Prefecture and around Chubu region; 10 September 2015 in Ibaraki Prefecture and around Kanto region). In Aichi Prefecture, the number of days of heavy rainfall, i.e., days with hourly precipitation of ≥50 mm/h and ≥100 mm/h, has increased by 60% and 110.11% since 1979 [4]. Referring to the most severe scenario of the Representative Concentration Pathways, RCP8.5, the extreme rainfall will increase by 25%–35% in 2071–2100 [5]. That condition triggers the rapid accumulation of runoff waters which causes flooding. In addition, the potential for flood casualties and damages is also increasing in many regions due to social and economic development, such as urbanization which puts pressure on land use change [6,7]. The population growth, especially in urban areas, has been increasing in the flood-prone areas [8]. Furthermore, the United Nations defined flooding as the most frequent and greatest hazard [9], and high population areas are relatively high-risk for natural disasters [7,9,10]. Thus, we chose the urban area as a case study in Aichi Prefecture. Flood-risk management is commonly divided into flood-risk assessment and flood-risk mitigation [11]. One of the strategies of flood-risk management against flood impact at the regional scale is the identification of vulnerable areas to provide early warning, facilitate quick response and decrease the impact of possible flood events. Recently, the integration of remote sensing technology (i.e., a method to extract the up-to-date information from satellites [12,13]), Geography Information System (GIS) (i.e., data integration [13]) and field surveys were conducted to assess the impact of flood damage by vulnerability mapping. One of the approaches in determining the areas vulnerable to flood disaster is spatial multi-criteria analysis through Analytical Hierarchy Process (AHP), introduced by Saaty; this method selects the required criteria by ranking the parameters and combines qualitative and quantitative factors [14–16]. The AHP method applies to the decision-making process. Some studies employed AHP for hazard assessment such as floods [6,17–20], tsunamis [21–23], landslides [20,24–29], droughts [30] and seismic hazards [19]. In flood hazard assessment, Ouma and Tateishi (2014) integrated AHP and GIS to predict flood vulnerability by using six parameters: rainfall, drainage, elevation, slope, soil and land use [6]. According to their AHP calculation, the soil was the weightiest parameter. In addition, the consistency ratio (CR) of their study was 9%. CR is used to conclude whether the evaluation is sufficiently consistent (i.e., the rational value of CR is ≤10% or ≤0.1) [16]. Siddayao et al. (2014) investigated population density, distance from the river bank and site elevation as AHP parameters for flood vulnerability [17]. Distance from the river bank was the highest contributing factor to floods in AHP calculation, and CR was 3.34%. Kazakis et al. (2015) calculated the flood hazard using the AHP approach and utilizing seven parameters including rainfall intensity, slope, flow accumulation, elevation, distance from drainage network, land use and geology [18]. The flow accumulation was the highest influencing parameter to floods, and CR was 8% [18]. Bathrellos et al. (2016) investigated urban hazard assessment with the AHP procedure and utilized six parameters (i.e., slope, elevation, distance from channel stream, distance from totally covered streams, hydro-lithological formation and land cover); the highest parameter was land cover and CR was 4% [19]. The advantage of AHP is that it is designed to solve complex problems involving multiple criteria. In addition, it is also designed to handle situations in which the subjective judgments of individuals constitute an important part of the decision process. However, the limitation of AHP is insufficient ability to define the uncertainty because the model predicts the estimates only without estimation error of each output level [20,31]. This study deals with the first element of flood-risk management, i.e., the definition of flood hazard areas in a specific region. The objective is to identify flood hazard zones, where mitigation assessment should be undertaken for urban development. Flood hazard assessment can support decision-makers and governments for urban developing. Bathrellos et al. studied hazard assessment (i.e., flood, landslide, and seismic hazard assessment) as a component to measure suitability for urban development [20] and proposed natural hazard assessment as a method for determining the suitability
Urban Sci. 2017, 1, 7
3 of 22
Urban Sci. 2017, 7 3 of 22 suitability of 1,urban growth and light industry development [32]. Additionally, some researchers studied flood-risk assessment as a prominent component of urban planning [33–35]. Thus, a spatial, multi-criteria index has been proposed to characterize such areas by integrating the technology of of urban growth and light industry development [32]. Additionally, some researchers studied flood-risk remote sensing and GIS to measure the physical parameters of flood vulnerability. The physical assessment as a prominent component of urban planning [33–35]. Thus, a spatial, multi-criteria index parameters of flood vulnerability were rainfall, drainage density, slope, soil and land cover. The has been proposed to characterize such areas by integrating the technology of remote sensing and rainfall, drainage density, slope, and land cover data were generated from satellite images; the soil GIS to measure the physical parameters of flood vulnerability. The physical parameters of flood was digitalized using the GIS method. All the parameters were combined by the GIS method and vulnerability were rainfall, drainage density, slope, soil and land cover. The rainfall, drainage density, pairwise using AHP procedure. All data were downloaded from public open access data. The study slope, and land cover data were generated from satellite images; the soil was digitalized using the GIS area is located in Okazaki City, Aichi Prefecture Japan. Even though the index is tailored to the method. All the parameters were combined by the GIS method and pairwise using AHP procedure. specific geography and land cover characteristics of the study area, it can be modified and applied in All data were downloaded from public open access data. The study area is located in Okazaki City, other areas. Aichi Prefecture Japan. Even though the index is tailored to the specific geography and land cover of the study area, it can be modified and applied in other areas. 2.characteristics Study Area and Flood History
2. Study Area and History The study areaFlood is located in the middle part of Aichi Prefecture Japan and has an area of 387.20 2 km [36] from Latitude 34°53′30″ N to 35°2′30″ N and Longitude 137°7′0″ E to 137°25′0″ E. Okazaki The study area is located in the middle part of Aichi Prefecture Japan and has an area of City is the third biggest city in Aichi Prefecture [36] with a population of 382,846 people [37]. It has a 387.20 km2 [36] from Latitude 34◦ 530 30” N to 35◦ 20 30” N and Longitude 137◦ 70 0” E to 137◦ 250 0” E. humid subtropical climate and an elevation ranging from 0 m to 789 m above sea level [36]. The Okazaki City is the third biggest city in Aichi Prefecture [36] with a population of 382,846 people [37]. central city consists of alluvial plains. The eastern part of the city is a mountainous area which has an It has a humid subtropical climate and an elevation ranging from 0 m to 789 m above sea level [36]. altitude of 789 m (i.e., Mt. Hongu) and the rest is lowland area which has an altitude ranging between The central city consists of alluvial plains. The eastern part of the city is a mountainous area which 0 and 300 m [37]. We selected the lowland area as the study area as shown in Figure 1. The study area has an altitude of 789 m (i.e., Mt. Hongu) and the rest is lowland area which has an altitude ranging is passed by big rivers, namely the Yahagi River which flows from North to South. Thus, the land use between 0 and 300 m [37]. We selected the lowland area as the study area as shown in Figure 1. within this area is dominated by agriculture, particularly paddy fields. Precipitation occurs The study area is passed by big rivers, namely the Yahagi River which flows from North to South. throughout the year with the heaviest in the summer season (i.e., June to September) and during Thus, the land use within this area is dominated by agriculture, particularly paddy fields. Precipitation typhoon phenomena. The temperature range is from −1 °C to 36 °C with an average annual occurs throughout the year with the heaviest in the summer season (i.e., June to September) and temperature of 17.0 °C, and the annual rainfall is about 1200 mm/year. during typhoon phenomena. The temperature range is from −1 ◦ C to 36 ◦ C with an average annual From 1996 to 2008, severe heavy rains and flooding due to typhoons occurred 18 times [38]. temperature of 17.0 ◦ C, and the annual rainfall is about 1200 mm/year. Large flood impact occurred on 11–13 September 2000 and 30 August 2008. However, the flood in From 1996 to 2008, severe heavy rains and flooding due to typhoons occurred 18 times [38]. Large 2008 was the most severe; the rainfall intensity was about 146 mm/h at 2:00 a.m. [4]. Around 1110 flood impact occurred on 11–13 September 2000 and 30 August 2008. However, the flood in 2008 was houses were flooded above floor level, and 2255 houses were flooded below floor level [38,39]. In the most severe; the rainfall intensity was about 146 mm/h at 2:00 a.m. [4]. Around 1110 houses were addition, some areas of the neighboring city (i.e., Anjo City) were also flooded. The flood survey was flooded above floor level, and 2255 houses were flooded below floor level [38,39]. In addition, some conducted during the flood by the local government of Okazaki City and Ministry of Land, areas of the neighboring city (i.e., Anjo City) were also flooded. The flood survey was conducted during Infrastructure, Transportation and Tourism (MLIT) [40]. This survey was used to verify the results of the flood by the local government of Okazaki City and Ministry of Land, Infrastructure, Transportation this study. and Tourism (MLIT) [40]. This survey was used to verify the results of this study.
Figure 1. Cont.
Urban Sci. 2017, 1, 7 Urban Sci. 2017, 1, 7
4 of 22 4 of 22
Figure Figure 1. 1. (a) (a) Location Location of of Aichi Aichi Prefecture Prefecture in in Japan; Japan; (b) (b) Location Location of of Okazaki OkazakiCity Cityin inAichi AichiPrefecture; Prefecture; (c) Research area in the lowland area of Okazaki City. (c) Research area in the lowland area of Okazaki City.
3. Materials and Methods 3. Materials and Methods 3.1. 3.1. Overview Overview Vulnerability Vulnerability maps maps can can be be utilized utilized in in all all steps steps of of disaster disaster management: management: prevention, prevention, mitigation, mitigation, preparedness, operations, relief, recovery and lessons learned [41]. In recent years, urban areas have preparedness, operations, relief, recovery and lessons learned [41]. In recent years, urban areas faced increased risk of disasters and the potential of economic and human losses from natural hazards. have faced increased risk of disasters and the potential of economic and human losses from natural To build sustainable communities in the urban integration between urban planning and hazard hazards. To build sustainable communities inarea, the urban area, integration between urban planning mitigation effort is necessary [20,32]. Thus, the vulnerability map can be used as one of the strategies and hazard mitigation effort is necessary [20,32]. Thus, the vulnerability map can be used as one of for for urban planning. Integrating theIntegrating remote sensing data, GIS and data, AHP GIS are the scenario strategiesmodeling for scenario modeling for urban planning. the remote sensing quite effective toolseffective to generate vulnerability data for urban areas. Theareas. overall and AHP are quite tools flood to generate flood vulnerability data for urban Themethod overall description for flood vulnerability is explained in Figure 2. There are five physical parameters for method description for flood vulnerability is explained in Figure 2. There are five physical parameters flood vulnerability utilized in this study, namely, rainfall, for flood vulnerability utilized in this study, namely, rainfall,drainage drainagedensity, density,slope, slope,soil soiland and land land cover. We generated the slope map and drainage density from Digital Elevation Model (DEM) data cover. We generated the slope map and drainage density from Digital Elevation Model (DEM) data from from the the Geospatial Geospatial Information Information Authority Authority of of Japan Japan (GSI). (GSI). Soil Soil map map distribution distribution was was generated generated from from MLIT. The rainfall spatial distribution was generated from AMEDAS (Automated Meteorological MLIT. The rainfall spatial distribution was generated from AMEDAS (Automated Meteorological Data Data Acquisition System) datathe from theMeteorology Japan Meteorology (JMA). land was Acquisition System) data from Japan Agency Agency (JMA). The land The cover wascover generated generated from Sentinel-2 imagery which was verified by Google Earth image. Then, by integrating from Sentinel-2 imagery which was verified by Google Earth image. Then, by integrating all of those all of those components, the flood-vulnerable areabywas assessed Finally, the floodcomponents, the flood-vulnerable area was assessed AHP. Finally, by the AHP. flood-vulnerable area was vulnerable area was verified by using field survey data taken during the flood event in Okazaki City verified by using field survey data taken during the flood event in Okazaki City that was conducted that was conducted by the government of Okazaki City and MLIT. We utilized software by the local government of local Okazaki City and MLIT. We utilized three software systemsthree to process the systems to process the data; ESA SNAP and ENVI 4.8 for processing land cover and ArcGIS 10.2.2 (ESRI, Redlands, CA, USA) for processing hydrological parameter and vulnerability index.
Urban Sci. 2017, 1, 7
5 of 22
Urban Sci. 2017, 1, 7
5 of 22
data; ESA SNAP and ENVI 4.8 for processing land cover and ArcGIS 10.2.2 (ESRI, Redlands, CA, USA) Integrating the hydrological AHP procedure, GIS and remote sensing could the the up-to-date information, for processing parameter and vulnerability index.preserve Integrating AHP procedure, GIS with low cost and good visualization. and remote sensing could preserve the up-to-date information, with low cost and good visualization.
Figure Figure 2. 2. Flowchart Flowchart of of proposed proposed method. method.
3.2. 3.2. Flood Flood Vulnerability Vulnerability Variable Variable The The flood flood vulnerability vulnerability variables variables were were determined determined by by literature literature review; review; rainfall rainfall[1,6,18,42–46]; [1,6,18,42–46]; drainage density [6,47–51]; slope [16,18,44]; soil [6,52,53]; and land cover [44,54–56]. drainage density [6,47–51]; slope [16,18,44]; soil [6,52,53]; and land cover [44,54–56]. 3.2.1. Rainfall Rainfall 3.2.1. Floods are are related related to to extremes extremes in in precipitation precipitation (from (from tropical tropical storms, storms, thunderstorms, thunderstorms, orographic orographic Floods rainfall, widespread widespread extratropical extratropical cyclones, cyclones, etc.) etc.) [57]. [57]. A A combination combination of of precipitation precipitation characteristics characteristics rainfall, (e.g., the theamount amountof of rainfall, intensity, duration and spatial distribution) influences theevents flood (e.g., rainfall, intensity, duration and spatial distribution) influences the flood events [43,46]. Flashdue floods due to relatively small cells of conventional activity havemuch received much [43,46]. Flash floods to relatively small cells of conventional activity have received attention attention and are deemed characteristic of small to medium basins rainfallcannot cannotimmediately immediately and are deemed characteristic of small to medium basins [58].[58]. TheThe rainfall infiltrate as as ground ground water, water, i.e., runoff. It converges converges to the catchment catchment area. area. The The heavy heavy rainfall rainfall rises rises the the infiltrate amount of discharge to to thethe flood record by MLIT, this amount discharge from fromrivers riversand andcauses causesoverflowing. overflowing.According According flood record by MLIT, casecase often occurs in Japan. Table 1 lists the rainfall intensity classification by JMA [4]. [4]. this often occurs in Japan. Table 1 lists the rainfall intensity classification by JMA Table 1. 1. Rainfall Rainfall classification classification Japan Japan Meteorology Meteorology Agency (JMA). Table
RainfallIntensity Intensity Rainfall 10–20 mm/h 10–20 mm/h 20–30 mm/h 20–30 mm/h 30–50 mm/h 30–50 mm/h 50–80 mm/h 50–80 mm/h >80 mm/h >80 mm/h
Description Description Slightly strong rain Slightly strong rain Strong rain Strong rain Heavy rain Heavy rain Very hard rain Very hard rain Raging rain Raging rain
Figure 3 was generated from JMA data. It was interpolated by the Kriging Method [44] from 20 points observation in Aichi Prefecture during extreme rainfall (i.e., the rainfall intensity was 146
Urban Sci. 2017, 1, 7
6 of 22
generated from JMA data. It was interpolated by the Kriging Method [44] 6from UrbanFigure Sci. 2017,31,was 7 of 22 20 points observation in Aichi Prefecture during extreme rainfall (i.e., the rainfall intensity was mm/h or 263.5 mmmm in two hours onon 2929 August 2008). 146 mm/h or 263.5 in two hours August 2008).Flooding Floodingcould couldoccur occurwhen whenthe the amount amount of five hours hours or or 406 406 mm mm to to 608 608 mm mm for for one one week week [43]. [43]. rainfall was 199 mm to 435 mm for five
Figure 3. Rainfall distribution map.
3.2.2. Drainage Density Drainage density (DD) is the ratio of the sum length of streams in the watershed over its Equation (1) (1) contributing area [46] as shown in Equation
∑ (1) Drainage density, Dd==∑ L Drainage density, Dd (1) A where ∑ is the total length of streams and A is the area. ∑ and A must be measured in the same where ∑ L is the total length of streams and A is the area. ∑ L and A must be measured in the same units. In this study, the unit was m/m2. units. In this study, the unit was m/m2 . Drainage density influences the water output and sediment from the system [59]. Low drainage Drainage density influences the water output and sediment from the system [59]. Low drainage density area is commonly found in high permeable soil and high-density vegetation; high drainage density area is commonly found in high permeable soil and high-density vegetation; high drainage density area is commonly found in the impermeable surface material (e.g., rocky hill slopes), arid density area is commonly found in the impermeable surface material (e.g., rocky hill slopes), arid area and areas with sparse vegetation cover [47,51]. Integration of drainage density and rainfall were area and areas with sparse vegetation cover [47,51]. Integration of drainage density and rainfall were considered by many researchers as a parameter of flooding [49,50,60]. considered by many researchers as a parameter of flooding [49,50,60]. Drainage density has two influences regarding peak of the flood [47] i.e., direct (e.g., the length Drainage density has two influences regarding peak of the flood [47] i.e., direct (e.g., the length of of stream network and hillslope paths) and indirect (e.g., geomorphology) [48]. stream network and hillslope paths) and indirect (e.g., geomorphology) [48]. Figure 4 displays the drainage density, it was generated from GSI DEM. We extracted the Figure 4 displays the drainage density, it was generated from GSI DEM. We extracted the elevation elevation from the DEM data and created the stream from the elevation map. We generated the from the DEM data and created the stream from the elevation map. We generated the stream order stream order and calculated the catchment area. Rationing the stream total length and catchment area and calculated the catchment area. Rationing the stream total length and catchment area followed followed Equation (1) to generate the drainage density. Equation (1) to generate the drainage density.
Urban Sci. 2017, 1, 7 Urban Sci. 2017, 1, 7
7 of 22 7 of 22
Figure 4. Drainage map.
3.2.3. Slope
The slope slopeisisthe the ratio of steepness ordegree the degree of inclination of arelative featuretorelative to the ratio of steepness or the of inclination of a feature the horizontal horizontal plane.grade, Gradient, grade, incline are used interchangeable slopeis[61]. The plane. Gradient, incline and pitch are and usedpitch interchangeable with slope [61]. with The slope typically slope is typically denotedan asangle, a percentage, anThe angle, or a ratio. slope of a topographical denoted as a percentage, or a ratio. average slopeThe of aaverage topographical (topo) feature can (topo) featurefrom can be measured contour a topo map or by DEM. The is achieved be measured contour lines from on a topo maplines or byonDEM. The slope is achieved byslope dividing the rise by dividing the risethis over run.byMultiply this ratio byas 100 to expose slope a percentage. The slope over run. Multiply ratio 100 to expose slope a percentage. The as slope angle represented in angle represented in degrees is obtained by taking the arctangent of the ratio between rise and run degrees is obtained by taking the arctangent of the ratio between rise and run [61]. Table 2 lists the [61]. Table 2 lists the classification in Okazaki City. slope classification inslope Okazaki City. Figure 5 shows the distribution of slope in Okazaki City. It was generated from the elevation map extracted from GSI DEM data. Table 2. Slope classification [62]. Slope Class 1
Slope (%)2. Slope Slope (Degree) Table classification [62]. 0–0.5
0
Terminology Level
Slope Class Slope (%) Slope (Degree) Terminology 2 >0.5–2 0.3–1.1 Near level 1 0–0.5 0 Level 3 >2–5 >1.1–3 Very gentle slopes 4 >5–10 >3–5 Gentle 2 >0.5–2 0.3–1.1 Near levelslopes 5 >10–15 >5–8.5 Moderate slopes 3 >2–5 >1.1–3 Very gentle slopes 6 >15–30 >8.5–16.5 Strong slopes 4 >5–10 >3–5 Gentle slopes 7 >30–45 >16.5–24 Very strong slopes 5 >10–15 >5–8.5 Moderate slopes 8 >45–70 >24–35 Extreme slopes 6 >15–30 >8.5–16.5 Strong slopes 9 >70–100 >35–45 Steep slopes 10 7 >100 >45 steep slopes >30–45 >16.5–24 Very Very strong slopes 8 >45–70 >24–35 Extreme slopes 9 >70–100 >35–45 slopes Figure 5 shows the distribution of slope in Okazaki City. It wasSteep generated from the elevation map 10data. >100 >45 Very steep slopes extracted from GSI DEM
Urban Sci. 2017, 1, 7
8 of 22
Urban Sci. 2017, 1, 7
8 of 22
Figure 5. 5. Slope Figure Slopemap. map.
3.2.4. Soil
3.2.4. Soil
Soils in Japan are grouped into soil groups [63]. Soil groups were divided according to their
Soils in Japanand areparent grouped intosoil soilseries groups [63]. Soil groups were divided according morphology material; groups were divided according to the variation of the to their morphology and parentlayer, material; soil groups were divided according to the according variation of the thickness of humus freckling andseries texture; soil series is basic unit classification (grouped to parent material, morphology Tableis 3 lists theunit soil classification groups in Okazaki City. according thickness of humus layer, freckling and andprocess) texture;[63,64]. soil series basic (grouped to parent material, morphology and process) [63,64]. Table 3 lists the soil groups in Okazaki City. Table 3. Japanese system of soil groups [63].
Soil Groups
Description Table 3. Japanese system of soil groups [63]. Ando soils are from volcano parent material and unconsolidated soils. Their colors Ando soils are dark rich from organic matter and have well-drained conditions. At an altitude of Soil Groups Description 3300 m, their textures are sandy-silt regosoils [63,65]. Ando soils are from volcano parent material and soils. soils but poorly drained Ando soils wet have the same parentunconsolidated material as the Ando Ando soils Their colors are dark rich from organic matter and have well-drained conditions. conditions and are freckled due to groundwater or irrigation water. Their colors are an altitude of 3300 m, their textures are sandy-silt regosoils [63,65]. Ando soilsAt (wet) dark and rich from organics. They distribute in alluvial bottom land and are utilized Ando soils wet thefield same parent material as the Ando soils but poorly drained conditions and are as ahave paddy [63]. Ando soils (wet) freckled dueBrown to groundwater or irrigation water. Their colors arematerial. dark andTheir rich from Forest soils are composed by various parent colorsorganics. are yellowThey distribute in alluvial bottom land and are utilized as a paddy field [63]. Brown forest soils brown, and they are well drained and spread in a mountainous area as upland crops, Brown Forest soils are and composed bySmall various parent material. Their colorsfor arecultivating yellow-brown, tree crops pasture. parts of these soils are utilized [63]. Brown and they areGley wellsoils drained and spread in a mountainous area as upland crops, tree cropsThese and pasture. are poorly drained alluvial plains and high groundwater tables. soils forest soils Gley soils Small parts of these soils are utilized for cultivating [63]. are broadly used for paddy rice cultivation [63]. Gley soils are poorly drained alluvial plains and high groundwater Gray Lowland soils are from Holocene alluvial plains ortables. polders under well- to Gley soils These soils are broadly used for paddy rice cultivation Gray lowland soils imperfectly drained conditions. These soils[63]. are the most productive for paddy cultivated in Holocene Japan [63].alluvial plains or polders under well- to imperfectly Gray Gray Lowland soils aresoil from lowland soils drained conditions. These soils are the most productive for paddy cultivated soilmarshes, in Japanthe [63]. Muck soils decompose more than 20% of organic matter from back Muck soilsMuck soils decompose margin of peat moor, etc. Compared to Ando soils, they have low phosphate more than 20% of organic matter from back marshes, the margin of peat moor, etc. Muck soils retention and they are widely utilized as a paddy fieldand [63]. Compared to Ando soils, have low phosphate retention are widely utilized as a paddy field [63]. Red soils are decomposed from various parent materials. These soils decompose due Red soils are decomposed from various parent materials. These soils decompose due to humid conditions Red soils to to humid conditions and warmJapan. to temperate in western Japan. Red soils and the warm temperate climate in the western Red soilsclimate are spread in terraces andRed hillssoils of low altitude near seacoasts and are suitable for upland crops, tree crops and grasses [63]. Yellow soils
Yellow soils decompose due to humid warm and humid temperate climates. Their characteristics are similar to Red soils except for their yellow color. Some of them are poorly drained and have freckles [63].
Manmade soils (artificially flattened areas)
Manmade soils are emplaced soil at least to a depth of 35 cm from the surface. These soils are deeply disturbed or reshaped by humans. There are two types of manmade soils according to their altitude, i.e., Manmade Upland soils and Manmade Lowland soils [63].
Figure 6 displays the distribution of soil groups in Okazaki City. It was generated by manual digitalizing through ArcGIS 10.2.2. This soil map was produced by the National Land Agency (a.k.a MLIT) on 7 July 1975. Soil 1, water infiltration is used as a flood parameter. It influences the runoff, soil loss, aquifer 9 of 22 Urban Sci. 2017, 7 recharge, irrigation management and plant water availability. The rate of water infiltration depends on external factors and soil properties, which vary based on the type of soil [66]. Thus, a literature review done to investigate the characteristic of thein soil type [63,66–70]. infiltration is Figurewas 6 displays the distribution of soil groups Okazaki City. It Soil waswater generated by manual a parameter that needs to be known to explain many processes such as runoff, soil loss, and aquifer digitalizing through ArcGIS 10.2.2. This soil map was produced by the National Land Agency recharge, as well as for irrigation management and plant water availability [66].
(a.k.a MLIT) on 7 July 1975.
Figure 6.Soil Soilmap. map. Figure 6.
water levels in the level area very low [71]. This condition becomes worsesoil during Soil The water infiltration is used as a are flood parameter. It influences the runoff, loss,the aquifer rainy irrigation season. Themanagement infiltrating process from the previous rainy day still continuing when the new recharge, and plant water availability. Theis rate of water infiltration depends rainy day comes, or the rainfall intensity is higher than the infiltration rate, and this condition could on external factors and soil properties, which vary based on the type of soil [66]. Thus, a literature lead to flooding. Soil rate infiltration according to the slope is listed in Table 4. review was done to investigate the characteristic of the soil type [63,66–70]. Soil water infiltration is a parameter that needs to be known to explain many processes such as runoff, soil loss, and aquifer recharge, as well as for irrigation management and plant water availability [66]. The water levels in the level area are very low [71]. This condition becomes worse during the rainy season. The infiltrating process from the previous rainy day is still continuing when the new rainy day comes, or the rainfall intensity is higher than the infiltration rate, and this condition could lead to flooding. Soil rate infiltration according to the slope is listed in Table 4. Table 4. Soil infiltration rate based on Percent of Slope (USDA, 1990) [69,72]. Soil Texture, Type Coarse Sand Medium Sand Fine Sand Loamy Sand Sandy Loam Fine Sandy Loam Very Fine Sandy Loam Loam Silt Loam Silt Sandy Clay Clay Loam Silty Clay
Infiltration Rate (IR) mm/h 0%–4%
5%–8%
8%–12%
12%–16%
>16%
31.75 26.924 23.876 22.352 19.05 16.002 14.986 13.716 12.7 11.176 7.874 6.35 4.826
25.4 21.59 19.05 17.78 15.24 12.7 11.938 10.922 10.16 8.89 6.35 5.08 3.81
19.05 16.256 14.224 13.462 11.43 9.652 8.89 8.382 7.62 6.604 4.826 3.81 2.794
12.7 10.668 9.652 8.89 7.62 6.35 6.096 5.588 5.08 4.572 3.048 2.54 2.032
7.874 6.858 6.096 5.588 4.826 4.064 3.81 3.556 3.302 2.794 2.032 1.524 1.27
Urban Sci. 2017, 1, 7
10 of 22
3.2.5. Land Cover Land use is the surface cover of the earth in a specific location (e.g., vegetation type, a manmade structure, etc.) [73]. It can be derived directly from remote sensing data and it needs to be verified by survey [73–75]. Furthermore, the land use can represent the socioeconomic condition in a certain area [6,74]. The classification of land use is listed in Table 5. Table 5. Land use/land cover classification scheme by land use cover types stratified according to the U.S. Geological Survey’s (USGS) land use and land cover classification system for utilizing with remote sensor data [44,76]. Land Cover
Description
Built-up land
Area that has been populated (e.g., land use: residential, commercial, industrial, transportation and facilities).
Forest or rangeland
Area covered with mature trees, shrubby plants and other plants growing close together.
Water
Area covered with water such as river and lakes
Agricultural land
Rainfed cropping, planted and irrigated cropping areas, areas covered mainly with herbaceous vegetation with shrubs (e.g., open area)
Barren land
Mountainous or hill areas, no covered vegetation area, degraded land and all unused area.
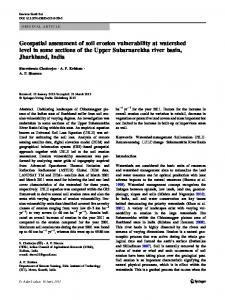
Figure 7 shows the distribution of a land cover map that was generated with Sentinel-2 imagery. We downloaded the Level-2A (bottom-of-atmosphere reflectance in cartographic geometry, prototype product). It was recorded on 22 November 2016. It is a panchromatic image with 10 m for visible and VNIR band 2, 3, 4 and 8) [77]. Urban Sci. 2017,(Band 1, 7 11 of 22
Figure 7. 7. Land Land cover cover map. map. Figure
3.3. Analytical Hierarchy Process (AHP) AHP is a decision-making technique utilized for solving complex problems, with many parameters of interrelated objectives or concerned criteria. The level of each parameter is not equal; some parameters are dominant over others. Different weights can generate the difference in the level
Urban Sci. 2017, 1, 7
11 of 22
3.3. Analytical Hierarchy Process (AHP) AHP is a decision-making technique utilized for solving complex problems, with many parameters of interrelated objectives or concerned criteria. The level of each parameter is not equal; some parameters are dominant over others. Different weights can generate the difference in the level of susceptibility [27]. It is based on ranking from the experts, literature reviews and previous study. The AHP pairwise have to be consistent with all pairwise comparisons. The AHP parameter for flooding was adapted from Ouma and Tateishi (2014) [6], and we modified by interviewing two hydrologists. Ouma et al. formulated the parameter with 16 experts (four hydrologists, four engineers and eight end-users). They selected six high-influence parameters (rainfall, drainage density, elevation, slope, soil and land use). We modified the flooding parameters as a result of the literature review and additional evaluation from experts. Thus, we utilized rainfall, drainage density, slope, soil and land cover as the parameters. 3.3.1. Relative Weight of the Parameters The ranking is related to their relative importance as listed in Table 6. The relative importance has a range from 1 to 9; 1 means an equal contribution of the pairwise parameter and 9 means a very important parameter [14,15]. Table 6. Nine-point pairwise comparison scale [14,15]. Intensity of Importance
Definition
Explanation
1
Equal importance
Two elements contribute equally to the objective
3
Moderate importance
Experience and judgment slightly favor one parameter overanother
5
Strong importance
Experience and judgment strongly favor one parameter over another
7
Very strong importance
One parameter is favored very strongly s and is considered superior to another; its dominance is demonstrated in practice
9
Extreme importance
The evidence favoring one parameter as superior to another is of the highest possible order of affirmation
Note: 2,4,6,8 can be used to express intermediate values, 1.1, 1.2, etc. for parameters that are very close in importance.
The number of parameter influences the matrix; 3 × 3 for three parameters, 4 × 4 for four parameters, 5 × 5 for five parameters and so on. The proposed method used a 5 × 5 matrix. The comparisons of parameters were generated from the expert judgment, literature review and the previous study. The weighting calculation follows Equation (2). A=
a11 a21 a31 a41 a51
a12 a22 a33 a42 a52
a13 a23 a34 a43 a53
a14 a24 a35 a44 a54
a15 a25 a35 a45 a55
1 , a 6= 0 , akk = 1, alk = akl kl
(2)
where A is the weight of the parameter, akl (kl = 11, 12, . . . 54, 55). The right eigenvalue (v) corresponding to the maximum eigenvalue (λmax ) is calculated to normalize and find the relative weight (Av ) of the matrix by following Equation (3). Av = λmax v
(3)
Urban Sci. 2017, 1, 7
12 of 22
3.3.2. Consistency Index (CI) and Consistency Ratio (CR) The output of AHP has to be consistent for all the pairwise comparisons measured by Consistency Index (CI) and Consistency Ratio (CR) [16]. The CI follows Equation (4); where n is a number of parameters. λmax − n CI = (4) n−1 The final calculation is consistency ratio; it is a ratio of the CI and random index (RI); RI value for five parameters is 1.12 [14]. The maximum threshold of CI is ≤0.1 and CR ≤ 10% [16]; the rational value is when the CI and CR have fulfilled the maximum threshold value. The consistency ratio (CR) followed Equation (5). CI CR = (5) RI 4. Results 4.1. Ranking of Map Criteria by AHP The main use of AHP is the ranking and prioritization of multi-criteria parameter. Priority framework quality affects the effectiveness of available sources which are the essential judgment from the decision maker. Furthermore, the experts usually use their experiential judgment when making the decision. Each of the expert participants determined the weight to the design factors with the following procedures [15]: (1) (2) (3)
Determine each factor percentage to distinguish the weight. Assign the least important factor from step 1 and assume the importance scale among the objective is linear. The importance of factor should be ranked from 1 to 5, where 1 represents the least important factor and 5 is the most important.
The calculation of the ranking of each factor was conducted by using pairwise comparison which can be seen in Equation (2). The results are shown in Table 7. There are five factors which were considered in this process, namely, rainfall, drainage density, slope, soil and land cover. Then, we normalized the converted matrix which is shown in Table 8. A more detailed calculation is described in Equation (3). The priority (Table 8) is also called normalized principal eigenvector, and it is used to weight the standardized raster layer. From Table 8, the consistency check CI can be calculated referring to Equation (4), as shown in Table 9. Then, we computed CR as also shown in Table 10. This step is necessary to determine if our comparisons are consistent. The CR is designed in such a way that if CR < 10%, the ratio indicates a reasonable level of consistency in the pairwise comparison. As shown in Table 9, since the CR is less than 10%, the ratio indicates a reasonable consistency in this analysis, and it implies that the determined weights are acceptable. In addition, the calculation of the eigenvector is used as a coefficient for the respective factor maps combined in the weighted overlay. Table 7. Ranking of flood vulnerability parameters. Criteria Rainfall Drainage density Slope Soil Land cover Summary
Rainfall 1 1 3 1/2 1/2 6
Drainage Density
Slope
Soil
Land Cover
1 1 2 1/2 1/2 5
1/3 1/2 1 1/2 1/4 2 13
2 2 4 1 1 10
2 2 4 1 1 10
Urban Sci. 2017, 1, 7
13 of 22
Table 8. Weighted comparison table.
Rainfall Drainage Slope Soil Land cover Total
Rainfall
Drainage
Slope
Soil
Land Cover
Priority Percent
0.167 0.167 0.500 0.083
0.200 0.200 0.400 0.100
0.143 0.214 0.429 0.107
0.200 0.200 0.400 0.100
0.200 0.200 0.400 0.100
0.174 0.196 0.434 0.098
17% 20% 43% 10%
0.083
0.100
0.107
0.100
0.100
0.098
10%
1
1
1
1
1
100%
Table 9. Weighted flood hazard ranking. Parameters
Rainfall intensity (R) [4]
Drainage density (DD) [78]
Slope (S) [79]
Soil(So) [71] (Basic infiltration rates by FAO)
Land cover(LC) [44]
Relative Weight
Re-Classified Parameter
Ranking
17%
10–20 mm/h 20–30 mm/h 30–50 mm/h 50–80 mm/h >80 mm/h
1 2 3 4 5
20%
0.00574 m/m2
1 2 3 4 5
43%
Very strong, extreme, steep and very steep slope Strong slope Gentle slope to moderate slope Very gentle slope Level to near level
2 3 4 5
10%
Less than 30 mm/h (sand) 20–30 mm/h (sandy loam) 20–10 mm/h (loam) 5–10 mm/h (clay loam) 1–5 mm/h (clay)
1 2 3 4 5
10%
Vegetation (forest) Vegetation (crops tree) Barren land Built-up land Rice field and open area
1 2 3 4 5
1
Table 10. Consistency of pair comparison.
Lambda
Rainfall
Drainage Density
Slope
Soil
Land Cover
1.0189
1.0024
1.0016
1.0024
1.0024
Note n = 5; CI = 0.007; CR = 0.6%
To calculate the weight and ranking in each factor, the pairwise comparison matrix and factor map are employed. The weight value provided the prioritize factor expressed as a percentage value between 0 and 100%. Using a linear weighted combination, the sum of weight was expressed as 100%. A summary of targeted factors, their weights and rankings are listed in Table 10. We applied the information in this table to generate the distribution of areas vulnerable to flooding. The ranking of each reclassified factor is based on the literature review. The range of ranking was 1 to 5; the highest influence factor was rank 5 and the lowest influence factor was 1. The order of normalized weight was lope parameter (43%), Drainage density (DD) parameter (20%), Rainfall intensity (17%) then
Urban Sci. 2017, 1, 7
14 of 22
infiltration rate (10%) and land cover (10%). Looking at the weight of each factor, one can see that slope has the highest weight. It implies that slope has more contribution to flooding than other factors. Slope influences the direction of the runoff or subsurface drainage. Furthermore, the slope has dominant control of the rainfall of stream flow, duration of flow and duration of infiltration process. Once the weight in each factor was determined, the multi-criteria analysis was performed to produce a flood-vulnerable area by using the GIS approach. To compute the vulnerable area, a weight linear combination was applied as shown in Equation (6). Vulnerable Index = 0.17 × R + 0.2 × DD + 0.43 × S + 0.1 × So + 0.1 × LC
(6)
The result is the flood-vulnerable area in the lowland of Okazaki City, shown in Figures 8 and 10. It was categorized into four vulnerable classes, e.g., “very low”, “low”, “moderate” and “high”, according to the expert’s knowledge-based classification. The result described that 28% of the area was classified as a high hazard zone. This area was close to the big river and in the lowland area; 5% of the lowland area of Okazaki City was categorized as a moderate level of vulnerability to flooding in the lowland area. The difference of infiltration rate categorized the lowland area into high and moderate flood-vulnerable levels. In contrast, 67% of Okazaki City was categorized as very low to low level of flood hazard. Most of the area was located at a higher elevation and far from the DD area. As shown in Figures 8 and 10, the main city of Okazaki is prone to high vulnerability, due to very slow infiltration rates and near level slope. A single map from a combination of multi-parameter and multi-criteria Urban Sci. 2017, 1, 7 in Figure 8, as the representation of flood prediction map for the study. 15 of 22 analysis is shown
Figure the field survey of of flood inundation in Figure 8. 8. Flood-vulnerable Flood-vulnerablearea areain inthe thelowland lowlandofofOkazaki OkazakiCity, City, the field survey flood inundation August 2008, andand thethe sampling area for for accuracy assessment. in August 2008, sampling area accuracy assessment.
In order to validate our assessment, a quantitative method was applied. This method is based on the contingency table as shown in Table 11. The flood threshold used for flood discrimination is highvulnerability area (red color) and non-flood discrimination is the rest (very low to moderate). In Table 11, a, b, c and d stand for “hit”, “false alarm”, “miss” and “correct negative”. The “Hit” represents correctly estimated flood area, “miss” represents when flooding is not estimated but actual flooding occurs, “false alarm” represents when flooding is estimated but flooding does not actually occur, and “correct negative” describes correctly estimated non-flooded area. Using the result shown in Table 11, we calculated the Probability of Detection (POD), Probability of False Detection (POFD), Critical
Urban Sci. 2017, 1, 7
15 of 22
4.2. Flood Validation The flood-vulnerable area was distributed in the level to near level slope of 0%–2%; drainage density was more than 0.00574 m/m2 ; rainfall was over 80 mm/h; there was a very slow infiltration rate (1–5 mm/h) and land surface was covered by rice fields and open area. In addition, to perform the validation, flooding-based field verification was conducted by the local government of Okazaki City and MLIT was used. The survey data of flood extent was employed for verification. Figure 8 shows the flood vulnerability map, survey data of flood extent in 2008 and sample area for accuracy assessment. In order to validate our assessment, a quantitative method was applied. This method is based on the contingency table as shown in Table 11. The flood threshold used for flood discrimination is high-vulnerability area (red color) and non-flood discrimination is the rest (very low to moderate). In Table 11, a, b, c and d stand for “hit”, “false alarm”, “miss” and “correct negative”. The “Hit” represents correctly estimated flood area, “miss” represents when flooding is not estimated but actual flooding occurs, “false alarm” represents when flooding is estimated but flooding does not actually occur, and “correct negative” describes correctly estimated non-flooded area. Using the result shown in Table 11, we calculated the Probability of Detection (POD), Probability of False Detection (POFD), Critical Success Index (CSI), Bias and Relative Operating Characteristic (ROC) [80–82] as explained in Equations (7)–(10). Table 11. The contingency table of AHP validation. Survey Flood Model
Flood Non-Flood Total
Non-Flood 282 (a) 37 (c) 319
a ( a + c)
POD =
b (b + d) a CSI = ( a + c)
POFD =
Bias =
( a + b) ( a + c)
352 (b) 820 (d) 1145
Total 607 857 1464
(7) (8) (9) (10)
POD explained how good the model estimates are in detecting flooding area; the range is 0 (false prediction) to 1 (perfect prediction). POFD shows false alarm of flood; its range 0 (no false prediction) to 1 (perfectly false prediction). Bias measures the similarity of “yes” model and “yes” survey. A perfect score is 1, 1 over forecast. CSI means how well the “yes” model corresponds to “yes” survey; 0 indicates no correspondent and 1 indicates perfect. We generated accurate results; POD (0.88) means high accuracy of flood event which occurred in predicted flood area, POFD (0.28) means low probability of false alarm of the flood, CSI 0.44 means normal correspondent and Bias (1.9) means over prediction of flooded area. The ROC can be seen in Figure 9 and the Area Under Curve (AUC) was 0.95.
We generated accurate results; POD (0.88) means high accuracy of flood event which occurred in predicted flood area, POFD (0.28) means low probability of false alarm of the flood, CSI 0.44 means normal correspondent and Bias (1.9) means over prediction of flooded area. The ROC can be seen in Figure Urban 9 and Area Sci.the 2017, 1, 7 Under Curve (AUC) was 0.95. 16 of 22
POD
ROC Curve / Model / AUC=0.95 1 0.9 0.8 0.7 0.6 0.5 0.4 0.3 0.2 0.1 0 0
0.2
0.4
0.6
0.8
1
POFD Figure 9. Relative Operating Characteristic curve for flood vulnerability in Okazaki City by using AHP procedure. Figure 9. Relative Operating Characteristic curve for flood vulnerability in Okazaki City by using
AHP procedure. ROC curves represent excellent, good, and worthless for an accuracy assessment. The accuracy is measured the area under the ROC curveand which was called An area ofassessment. 1 represents aThe perfect ROC curvesbyrepresent excellent, good, worthless forAUC. an accuracy accuracy test; an area of 0.5 represents a worthless test. The accuracy classification of AUC was explained as is measured by the area under the ROC curve which was called AUC. An area of 1 represents a perfect follows: 0.9–1 = excellent (A); 0.80–0.90 = good; 0.70–0.80 = fair; 0.60–0.70 = poor; 0.50–0.60 = fail. test; an area of 0.5 represents a worthless test. The accuracy classification of AUC was explained as Referring to Figure 9, our model produced flood vulnerability area with the AUC 95%. This means follows:that 0.9–1 = excellent (A); 0.80–0.90 = good; 0.70–0.80flooded = fair;and 0.60–0.70 = poor; our model could be considered excellent at separating non-flooded areas.0.50–0.60 The AUC = fail. Referring 9, by ourEquation model (11) produced flood vulnerability area with the AUC 95%. This means can to be Figure calculated
that our model could be considered excellent at separating flooded and non-flooded areas. The AUC h i n can be calculated by Equation (10)AUC = ∑ [ xi+1 − xi ] yi + yi+1 − yi (11) i =1
2
where x is the rate of POD for scenario i; and n is the number of (10) − of][POFD + for the − scenario ] AUC = i; y is [ the rate 2 suitability group.
where x4.3. is Urban the rate of POD for scenario i; y is the rate of POFD for the scenario i; and n is the number Flood-Risk Area of suitability group.
The assessment of flood-risk area was accomplished by using land cover type. We evaluated the risk of flooding based on land cover type by using cluster analysis [83]. Approximately 10,612.07 Ha 4.3. Urban was Flood-Risk vulnerable Area to flood in the lowland area of Okazaki City. The result stated that agriculture and residential areas comprised 49.5% and 29.6%, respectively, of totalland flood-vulnerable the the The assessment of flood-risk area was accomplished bythe using cover type.area, Wewhile evaluated lowest percentage of the vulnerable area was located in the open area (17.5%) and the vegetation, e.g., risk of flooding based on land cover type by using cluster analysis [83]. Approximately 10,612.07 Ha forest (3.4%). It occurred due to land cover influence on filtration rate. was vulnerable to flood in the lowland area of Okazaki City. The result stated that agriculture and Regarding the flood simulation with the building data from GSI (all permanent buildings; offices, residential areas comprised 49.5% 29.6%, respectively, of the1136.66 total flood-vulnerable area, while schools, hospitals, houses, etc.),and flooding affected approximately Ha total of the building the lowest the vulnerable located the open area (17.5%) to and vegetation, area percentage as shown in of Figure 10 with grayarea colorwas indicating theinbuilding area. According thethe building distribution, than halfdue of the the lowland of Okazaki City lived in flood-prone e.g., forest (3.4%). more It occurred to population land coverininfluence onarea filtration rate. areas. Moreover, Okazaki City was also covered by agricultural land which of paddy Regarding the flood simulation with the building data from GSI (allconsisted permanent buildings; (1400 Ha), wheat (560 Ha), soy (505 Ha), and vegetable and fruits (i.e., eggplant, strawberry, grape offices, schools, hospitals, houses, etc.), flooding affected approximately 1136.66 Ha total of the (48.9 Ha)) [84]. Most of the agricultural sector was located around Yahagi River which was also building area as shown in Figure 10 with gray color indicating the building area. According to the categorized as a flood-prone area. This condition caused major economic losses, in particular as a result building distribution,damage, more than half ofloss the population the lowland area of inundation Okazaki City lived in of infrastructure agriculture and suspension in of business activity. Flood caused not only economic loss but also caused various diseases such as waterborne disease, vector-borne disease, etc.
paddy (1400 Ha), wheat (560 Ha), soy (505 Ha), and vegetable and fruits (i.e., eggplant, strawberry, grape (48.9 Ha)) [84]. Most of the agricultural sector was located around Yahagi River which was also categorized as a flood-prone area. This condition caused major economic losses, in particular as a result of infrastructure damage, agriculture loss and suspension of business activity. Flood inundation caused not only economic loss but also caused various diseases such as waterborne Urban Sci. 2017, 1, 7 17 of 22 disease, vector-borne disease, etc.
Figure 10. Buildings in areas vulnerable to flooding in Okazaki City. Figure 10. Buildings in areas vulnerable to flooding in Okazaki City.
Urban sustainability can be influenced by economic development, socioeconomic policy, Urban sustainability canenvironment, be influenced economic socioeconomic policy, population growth, physical and by natural hazardsdevelopment, [28,85]. However, in the interim of planning, growth, development, and environment, management ofand an urban area, only the economic and social variables population physical natural hazards [28,85]. However, in the interim usuallydevelopment, considered. As result, in vulnerable sites,area, suchonly as areas with steep slopes, of are planning, anda management of an urban the economic and socialnatural variables occur, especially floods which cansites, cause vastasdestruction the slopes, social and economic arehazards usuallyoften considered. As a result, in vulnerable such areas with of steep natural hazards network lead tofloods the loss of human livesvast anddestruction property. In to avoid the aforementioned often occur,and especially which can cause of order the social and economic network and outcome, during the planning and property. growth ofIn anorder urbantoarea, it isthe necessary for the decision makers, lead to the loss of human lives and avoid aforementioned outcome, during engineers, planners, and managers to consider the physical variables of the urban area, in particular the planning and growth of an urban area, it is necessary for the decision makers, engineers, planners, itsmanagers susceptibility to naturalthe hazards. and to consider physical variables of the urban area, in particular its susceptibility to analysis such as AHP is an effective decision support tool for dealing with complex naturalMulti-criteria hazards. decision constellations where technological, economical, ecological, and social aspects have to be Multi-criteria analysis such as AHP is an effective decision support tool for dealing with complex included. The AHP method was applied and combined with GIS and Remote Sensing for assessing decision constellations where technological, economical, ecological, and social aspects have to be the level of flood vulnerability of areas. Furthermore, this method was relatively inexpensive, easy to included. The AHP method was applied and combined with GIS and Remote Sensing for assessing use and, more importantly, allows the combination of many parameters, statistical analyses and the level of flood vulnerability of areas. Furthermore, this method was relatively inexpensive, easy physical properties which can be derived from satellite or survey data. However, AHP has its to problems use and, more importantly, theAHP combination many parameters, and and challenges. Forallows instance, relies on of input from the experts,statistical and it is analyses sometimes physical properties which can be derived from satellite or survey data. However, AHP has its problems difficult to find experts. and challenges. For instance, AHP relies on input from the experts, and it is sometimes difficult to find experts.
5. Conclusions It is difficult to reduce the occurrence of natural disasters, including floods. What we can do is minimize their impact. Assessing areas vulnerable to flooding disasters is one of the parameters in creating a flood-risk map for disaster mitigation and urban planning. This study tried to assess the area that was vulnerable to flooding using integrated approaches of remote sensing, GIS, and spatial multi-criteria evaluation through the Analytical Hierarchy Process (AHP) approach. The parameters of slope, drainage density, rainfall intensity, infiltration rate, and land cover were applied to predict
Urban Sci. 2017, 1, 7
18 of 22
affected area of flooding. The AHP calculation shows that slope was the highest weight (43%) in determining vulnerability to flooding through the spatial-weighted overlay, followed by drainage density (20%), rainfall intensity (17%), infiltration rate (10%) and land cover (10%). This calculation resulted in a 0.6% consistency ratio. The slope parameter was the most important parameter because the slope influences the flow direction, runoff and soil infiltration. There are several measurement methods for urban planning in Japan, which are applied to each area by the local government depending on local circumstances under the City Planning Law [86]. According to the structure of City Planning System from the Ministry of Land, Infrastructure, Transportation and Tourism (MLIT), there are three components, i.e., Land Use Regulation, Urban Facilities and Urban Development Projects; one part of the Urban Development Projects is promotion for reconstruction of the disaster-stricken urban area. We proposed the result of this study as a consideration for urban planning in Okazaki City. The result of the flood-vulnerable areas shows excellent accuracy; Probability of Detection (POD—0.88), Probability of False Detection (POFD—0.28), Critical Success Index (CSI—0.44), Bias (1.9) and Area under Curve (AUC—0.95) from the Relative Operating Characteristic (ROC) graph. This method can be utilized to complement the hazard map of MLIT. The total area of Okazaki City is approximately 95,679.2 Ha, and 10,612.07 Ha or 11.1% of the total area is highly vulnerable to flooding. From the total flood-vulnerable area in the lowland area, the land cover with the highest risk of flood was a residential area (29.6%) and agricultural area (49.5%). Those areas were close to the big river and had a slow infiltration rate, in addition to having a level to near level slope. These conditions influence the economic situation. By analysis of the building distribution and the flood-risk area, it is clear that approximately 1366.66 Ha total of construction area (i.e., offices, schools, hospitals, houses, etc.) is in the flood-prone area. This study contributes an important approach for the effectiveness of disaster mitigation and urban planning.This method can be applied in other geographical areas, even if they have different topographical characteristics than this study area. This study aimed to evaluate the physical parameter of flood vulnerability. The use of other parameters, including river proximity, in addition to a comparison study using other sources of elevation data, will be analyzed for future work, and we will also consider the social, economic, ecological, cultural and institutional variables. Acknowledgments: The authors give thanks to GSI for providing elevation data, Japan Meteorological Agency for rainfall data, MLIT for the soil map, and ESA’s Earth Observation Programmes for providing Sentinel-2 imagery. Our greatest acknowledgment belongs to Urban Science reviewers for their great suggestions to improve this study. We also thank Takumi Kajitani who explained the study area, Koji Asai for the valuable discussion, and Takahiro Osawa, I Nyoman Sudi Parwata and Abd. Rahman As-syakur, for their great contribution during this study. Special thanks to Kira LaMarra Adams for her kindness in proofreading this manuscript. Author Contributions: Andi Besse Rimba prepared the data, processed the data by using remote sensing and GIS, Abu Bakar Sambah calculated the AHP procedure. Together with Martiwi Diah Setiawati, Fusanori Miura, Abu Bakar Sambah and Andi Besse Rimba conceptualized the problem and prepared the manuscript. Conflicts of Interest: The authors declare no conflict of interest.
References 1. 2. 3. 4. 5.
Kazama, S.; Sato, A.; Kawagoe, S. Evaluating the Cost of Flood Damage Based on Changes in Extreme Rainfall in Japan. Sustain. Sci. 2009, 4, 61–69. [CrossRef] Ministry of Land, Infrastructure and Transport (MLIT); International Center for Water Hazard and Risk Management (ICHARM). Flood Hazard Mapping Manual in Japan; MLIT and ICHARM: Tokyo, Japan, 2005. Tockner, K.; Bunn, S.E.; Gordon, C.; Naiman, R.J.; Quinn, G.P.; Standord, J.A. Flood plains: Critically threatened ecosystems. In Aquatic Ecosystems; Cambridge University Press: Cambridge, UK, 2008. Japan Meteorology Agency (JMA). Hourly Wather Observation. Available online: http://www.jma.go.jp/ en/amedas_h/index.html (accessed on 22 October 2016). Hong, J.-Y.; Bae-Ahn, J. Change of early summer of precipitation in the Korean Peninsula and Nearby Regions based on RCP simulation. J. Clim. 2015, 28, 3557–3578. [CrossRef]
Urban Sci. 2017, 1, 7
6. 7. 8. 9. 10. 11. 12.
13. 14. 15. 16. 17. 18.
19. 20.
21. 22. 23. 24.
25. 26. 27. 28.
29.
19 of 22
Ouma, Y.O.; Tateishi, R. Urban Flood Vulnerability and Risk Mapping Using Integrated Multi-Parametric AHP and GIS: Methodological Overview and Case Study Assessment. Water 2014, 6, 1515–1545. [CrossRef] Rufat, S.; Tate, E.; Burton, C.G.; Maroof, A.S. Social vulnerability to floods: Review of case studies and implications for measurement. Int. J. Disaster Risk Reduct. 2015, 14, 470–486. [CrossRef] Larsen, J.B. Forestry between land use intensification and sustainable development: Improving landscape functions with forests and trees. Geogr. Tidsskr. Dan. J. Geogr. 2009, 109, 191–195. [CrossRef] United Nations. World Urbanization Prospects—The 2011 Revision; United Nations: New York, NY, USA, 2012. Wilby, R.L.; Keenan, R. Adapting to flood risk under climate change. Prog. Phys. Geogr. 2012, 2012, 348–378. [CrossRef] Schanze, J.; Zeman, E.; Marsalek, J. Flood Risk Management: Hazards, Vulnerability and Mitigation Measures; Springer: Berlin, Germany, 2006. Panagiota, M.; Jocelyn, C.; Erwan, P. State of the Art on Remote Sensing for Vulnerability and Damage Assessment on Urban Context; Urban Seismology-Seismic Risk Evaluation by Using Innovative Techniques; GIPSA-Lab: Saint-Martin-d’Hères, France; ISTerre: Gières, France, 2011. Ebert, A.; Kerle, N. Urban social vulnerability assessment using object-oriented analysis of Remote Sensing and GIS Data. Int. Arch. Photogram. Remote Sens. Spat. Inf. Sci. 2008, 37, 1307–1312. Saaty, T.L. The analytical Hierarchy Process—What it is and how it is used. Math. Modell. 1987, 9, 161–176. [CrossRef] Saaty, T.L. Decision making with the analytic hierarchy process. Int. J. Serv. Sci. 2008, 1, 83–98. [CrossRef] Saaty, T.L. A scaling method for priorities in hierarchical structures. J. Math. Psychol. 1977, 15, 234–281. [CrossRef] Siddayao, G.P.; Valdez, S.E.; Fernandez, P.L. Analytic Hierarchy Process (AHP) in Spatial Modeling for Floodplain Risk Assessment. Int. J. Mach. Learn. Comput. 2014, 4, 450–457. [CrossRef] Kazakis, N.; Kougias, I.; Patsialis, T. Assessment of flood hazard areas at a regional scale using an index-based approach and Analytical Hierarchy Process: Application in Rhodope–Evros region, Greece. Sci. Total Environ. 2015, 538, 555–563. [CrossRef] [PubMed] Bathrellos, G.D.; Karymbalis, E.; Skilodimou, H.D.; Gaki-Papanastassiou, K.; Baltas, E.A. Urban flood hazard assessment in the basin of Athens Metropolitan city, Greece. Environ. Earth Sci. 2016, 75, 319. [CrossRef] Bathrellos, G.D.; Skilodimou, H.D.; Chousianitis, K.; Youssef, A.M.; Pradhan, B. Suitability estimation for urban development using multi-hazard assessment map. Sci. Total Environ. 2017, 575, 119–134. [CrossRef] [PubMed] Sambah, A.B.; Miura, F. Remote sensing and spatial multi-criteria analysis for tsunami vulnerability assessment. Disaster Prev. Manag. 2014, 23, 271–295. [CrossRef] Sambah, A.B.; Miura, F. Integration of Spatial Analysis for Tsunami Inundation and Impact Assessment. J. Geogr. Inf. Syst. 2014, 6, 11–22. [CrossRef] Poursaber, M.R.; Ariki, Y. Estimation of Tsunami Hazard Vulnerability Factors by Integrating Remote Sensing, GIS and AHP Based Assessment. Open Access Libr. J. 2016, 3, 1–11. [CrossRef] Kayasthaa, P.; Dhital, M.R.; de Smedt, F. Application of the analytical hierarchy process (AHP) for landslide susceptibility mapping: A case study from the Tinau watershed, west Nepal. Comput. Geosci. 2013, 52, 398–408. [CrossRef] Hasekiogulları, ˘ G.D.; Ercanoglu, M. A new approach to use AHP in landslide susceptibility mapping: A case study at Yenice (Karabuk, NW Turkey). Nat. Hazards 2012, 63, 1157–1179. [CrossRef] Shahabi, H.; Hashim, M. Landslide susceptibility mapping using GIS-based statistical models and Remote sensing data in tropical environment. Sci. Rep. 2015, 5, 9899. [CrossRef] [PubMed] Ahmed, B. Landslide susceptibility modelling applying user-defined weighting and data-driven statistical techniques in Cox’s Bazar Municipality, Bangladesh. Nat. Hazards 2015, 79, 1707–1737. [CrossRef] Rozos, D.; Bathrellos, G.D.; Skillodimou, H.D. Comparison of the implementation of rock engineering system and analytic hierarchy process methods, upon landslide susceptibility mapping, using GIS: A case study from the Eastern Achaia County of Peloponnesus, Greece. Environ. Earth Sci. 2011, 63, 49–63. [CrossRef] Ahmed, B. Landslide susceptibility mapping using multi-criteria evaluation techniques in Chittagong Metropolitan Area, Bangladesh. Landslides 2015, 12, 1077–1095. [CrossRef]
Urban Sci. 2017, 1, 7
30.
31.
32.
33.
34.
35. 36.
37. 38. 39. 40. 41.
42. 43.
44.
45. 46. 47. 48. 49. 50. 51.
20 of 22
Ekrami, M.; Marj, A.F.; Barkhordari, J.; Dashtakian, K. Drought vulnerability mapping using AHP method in arid and semiarid areas: A case study for Taft Township, Yazd Province, Iran. Environ. Earth Sci. 2016, 75, 1–13. [CrossRef] Bathrellos, G.D.; Gaki-Papanastassiou, K.; Skilodimou, H.D.; Skianis, G.A.; Chousianitis, K.G. Assessment of rural community and agricultural development using geomorphological-geological factors and GIS in the Trikala prefecture (Central Greece). Stoch. Environ. Res. Risk Assess. 2013, 27, 573–588. [CrossRef] Bathrellos, G.D.; Gaki-Papanastassiou, K.; Skilodimou, H.D.; Papanastassiou, D.; Chousianitis, K.G. Potential suitability for urban planning and industry development using natural hazard maps and geological-geomorphological parameters. Environ. Earth Sci. 2012, 66, 537–548. [CrossRef] Ran, J.; Nedovic-Budic, Z. Integrating spatial planning and flood risk management: A new conceptual framework for the spatially integrated policy infrastructure. Comput. Environ. Urban Syst. 2016, 57, 68–79. [CrossRef] Van Herk, S.; Zevenbergen, C.; Ashley, R.; Rijke, J. Learning and Action Alliances for the integration of flood risk management into urban planning: A new framework from empirical evidence from The Netherlands. Environ. Sci. Policy 2011, 14, 543–554. [CrossRef] Plate, E.J. Flood risk and flood management. J. Hydrol. 2002, 267, 2–11. [CrossRef] Weblio. Okazaki City. Available online: http://www.weblio.jp/wkpja/content/%E5%B2%A1%E5% B4%8E%E5%B8%82_%E6%A6%82%E8%A6%81#cite_ref-chunichi2016-2-18_4-0 (accessed on 22 July 2016). (In Japanese) Okazakishi. Current Status and Problems of Biodiversity. Available online: http://www.city.okazaki.lg.jp/ 1300/1303/1326/p011109.html (accessed on 22 July 2016). (In Japanese) Okazakishi. Creating Master Plan of Okazaki Municipal Water Environment: Draft; Master Plan of Okazaki Municipal Water Environment: Okazaki, Japan, 2015. (In Japanese) Adachi, T. Flood damage mitigation efforts in Japan. In Proceedings of the Fifth US-Japan Conference on Flood Control and Water Resources Management, Tokyo, Japan, 27–29 September 2009. Okazakishi. Okazaki City. Available online: http://disapotal.gsi.go.jp/viewer/index.html?code=4 (accessed on 7 July 2016). Edwards, J.; Gustafsson, M.; Näslund-Landenmark, B. Handbook for Vulnerability Mapping: EU Asia Pro Eco Project Disaster Reduction through Awareness, Preparedness and Prevention Mechanisms in Coastal Settlements in Asia Demonstration in Tourism Destinations; EU and International Affairs Department; Swedish Rescue Services Agency: Karlstad, Sweden, 2007. Greenbaum, N.; Margalit, A.; Schick, A.P.; Sharon, D.; Baker, V.R. A high magnitude storm and flood in a hyperarid catchment, Nahal Zin, Negev Desert, Israel. Hydrol. Process. 1998, 12, 1–23. [CrossRef] Setiawati, M.D.; Miura, F.; Aryastana, P. Validation of hourly GSMaP and ground base estimates of precipitation for flood monitoring in Kumamoto, Japan. In Geospatial Technology for Water Resource Applications; CRC Press: Boca Raton, FL, USA, 2016. Rimba, A.B.; Miura, F. Predicting Flood-vulnerability of Areas Using Satellite Remote-sensing Images in Kumamoto City, Japan. In Geospatial Technology for Water Resource Applications; CRC Press: Boca Raton, FL, USA, 2016. Setiawati, M.D.; Miura, F. Evaluation of GSMaP Daily Rainfall Satellite Data for Flood Monitoring: Case Study—Kyushu Japan. J. Geosci. Environ. Protect. 2016, 4, 101–117. [CrossRef] ‘ Horton, R.E. Erosional Development of Streams and Their Drainage Basins; Hydrophysical Approach to Quantitative Morphology. Geol. Soc. Am. Bull. 1945, 56, 275–370. [CrossRef] Pallard, B.; Castellarin, A.; Montanary, A. A look at the links between drainage density and flood statistics. Hydrol. Earth Syst. Sci. 2009, 13, 1019–1029. [CrossRef] Merz, R.; Bloschl, G. Flood frequency hydrology: 2. Combining data evidence. Water Resour. Res. 2008, 44, 1–6. [CrossRef] Di Lazzaro, M.; Zarlenga, A.; Volpi, E. A new approach to account for the spatial variability of drainage density in rainfall-runoff modeling. Boletín Geológico y Minero 2014, 152, 301–313. Anwar, M.R. The rainfall-runoff modeling using of the watershed physical characteristic approach. Int. J. Civ. Environ. Eng. 2011, 11, 71–75. Moglen, G.E. On the sensitivity of drainage density to climate change. Water Resour. Res. 1998, 34, 855–862. [CrossRef]
Urban Sci. 2017, 1, 7
52. 53. 54. 55. 56.
57. 58. 59. 60.
61. 62. 63. 64. 65.
66. 67. 68. 69. 70. 71. 72. 73. 74. 75. 76. 77.
21 of 22
Bateman, A.; Medina, V.; Velasco, D. Soil Infiltration Effect in Flat Areas Floods Simulation. In Proceedings of the 18th International Conference on Water Resources, Barcelona, Sapin, 21–24 June 2010. Ghazavi, R.; Vali, A.; Eslamian, S. Impact of Flood Spreading on Infiltration Rate and Soil Properties in an Arid Environment. Water Resour. Manag. 2010, 24, 2781–2793. [CrossRef] Zope, P.E.; Eldho, T.I.; Jothiprakash, V. Impacts of land use–land cover change and urbanization on flooding: A case study of Oshiwara River Basin in Mumbai, India. CATENA 2016, 145, 142–154. [CrossRef] Al-Khudhairy, D.; Shepherd, I. Changes in Land-Use and Land-Cover: A Cause of Flooding? A Literature Review; Institute for Systems, Informatics and Safety: Ispra, Italy, 1997. Halounova, L.; Holubec, V. Assessment of Flood with Regards to Land Cover Changes. In Proceedings of the 4th International Conference on Building Resilience, Incorporating the 3rd Annual Conference of the ANDROID Disaster Resilience Network, Salford Quays, UK, 8–11 September 2014; Volume 18, pp. 940–947. Trenberth, K.E. The impact of climate change and variability on heavy precipitation, floods, and droughts. In Encyclopedia of Hydrological Sciences; John Wiley & Sons, Ltd.: Hoboken, NJ, USA, 2005. Bracken, L.J.; Cox, N.J.; Shannon, J. The relationship between rainfall inputs and flood generation in South–East Spain. Hydrol. Process. 2007, 22, 683–696. [CrossRef] Gregory, K.J.; Walling, D.E. The variation of drainage density within a catchment. Int. Assoc. Sci. Hydrol. Bull. 1968, 13, 61–68. [CrossRef] Ogden, F.L.; Pradhan, N.R.; Downer, C.W.; Zahner, J.A. Relative importance of impervious area, drainage density, width function, and subsurface storm drainage on flood runoff from an urbanized catchment. Water Resour. Res. 2011, 47, 12. [CrossRef] Geokov. Geokov Education. Available online: http://geokov.com/education/slope-gradient-topographic. aspx (accessed on 7 July 2016). Haynes, R.H. The Canadian System of Soil Classification, 3rd ed.; NRC Research Press: Ottawa, ON, Canada, 1998. Amano, Y. Classification of Cultivated Soils in Japan. JARQ 1985, 18, 4. Obara, H.; Maejima, Y.; Kohyama, K.; Ohkura, T.; Takata, Y. Outline of Comprehensive Soil Classification System of Japan-First Approximation. Jpn. Agr. Res. Q. 2014, 3, 217–226. [CrossRef] Perrin, J.L.; Bouvier, C.; Janeau, J.L.; Ménez, G.; Cruz, F. Rainfall/runoff processes in a small peri-urban catchment in the Andes mountains. The Rumihurcu Quebrada, Quito (Ecuador). Hydrol. Process. 2001, 15, 843–854. [CrossRef] Tejedor, M.; Neris, J.; Jiménez, C. Soil Properties Controlling Infiltration in Volcanic Soils (Tenerife, Spain). Soil Sci. Soc. Am. J. 2013, 77, 202–212. [CrossRef] Kyuma, K.; Kawaguchi, K. Major Soils of Southeast Asia and the Classification of Soils Under Rice Cultivation (Paddy Soils). Kyoto Univ. Center Southeast Asian Stud. 1966, 4, 290–312. Academia Sinica Institute of Soil Science. In Proceedings of Symposium on Paddy Soil, 1st ed.; Science Press: Beijing, China; Springer: Berlin/Heidelberg, Germany, 1981. Kern, J. Water Use and Conservation; California Department of Water Resources: Sacramento Country, CA, USA, 2010. Doerr, S.H.; Shakesby, R.A.; Walsh, R.P.D. Soil water repellency: Its causes, characteristics and hydro-geomorphological significance. Earth Sci. Rev. 2000, 51, 1–4. [CrossRef] Brouwer, C. Gestion des Eaux en Irrigation Manual de Fromation No. 5 Methodes D’irrigation; Devision de la Mise en Valeur des Terres et Des Eaux; Food and Agriculture Organization (FAO): Rome, Italy, 1990. (In French) Johnson, A.I. A Field Method for Measurement of Infiltration, 2nd ed.; U.S. GeoloTical Survey: Denver, CO, USA, 1991. Sohl, T.; Benjamin, S. Role of remote sensing for land-use and land-cover change modeling. In Remote Sensing of Land Use and Land Cover: Principles and Applications; CRC Press: Boca Raton, FL, USA, 2012; pp. 225–239. Ahmed, B.; Ahmed, R. Modeling Urban Land Cover Growth Dynamics Using Multi-Temporal Satellite Images: A Case Study of Dhaka, Bangladesh. ISPRS Int. J. Geo-Inf. 2012, 1, 3–31. [CrossRef] Ahmed, B.; Ahmed, R.; Zhu, X. Evaluation of Model Validation Techniques in Land Cover Dynamics. ISPRS Int. J. Geo-Inf. 2013, 2, 577–597. [CrossRef] Anderson, J.R.; Hardy, E.E.; Roach, J.T.; Witmer, R.E. A Land Use and Land Cover Classification System for Use with Remote Sensor Data; Geological Survey; Land Cover Institute: Washington, DC, USA, 1976. ESA. ESA Sentinel Online. Available online: https://earth.esa.int/web/sentinel/user-guides/sentinel-2msi/resolutions/spatial (accessed on 22 October 2016).
Urban Sci. 2017, 1, 7
78. 79. 80. 81. 82.
83. 84. 85. 86.
22 of 22
Esri. ArcGIS Spatial Analyyst: Advanced GIS Spatial Analysis Using Raster and Vector Data; Esri: New York, NY, USA, 2001. Demek, J. Manual of Detailed Geomorphological Mapping; Academia, Publishing House of the Czechoslovak Academy of Science: Prague, Czech Republic, 1972. Mason, I. A model for assessment of weather forecasts. Aust. Meteorol. Mag. 1982, 30, 291–303. Brooks, H.E. Tornado-warning performance in the past and future. Bull. Am. Meteorol. Soc. 2004, 85, 837–843. [CrossRef] Brooks, H.E.; Marsh, P.T.; Kowaleski, A.M.; Groenemeijer, P.; Thompson, T.E.; Schwart, C.S.; Shafer, C.M.; Kolodziej, A.; Dahl, N.; Buckey, D. Evaluation of European Storm Forecast Experiment (ESTOFEX) forecasts. Atmos. Res. 2011, 100, 538–546. [CrossRef] Eastman, R.J. DIRISI Andes: Guide to GIS and Image; Clark University: Worcester, MA, USA, 2001. Okazakishi. Okazaki Agriculture Review. Available online: http://www.city.okazaki.lg.jp/1300/1301/ 1313/p017725.html (accessed on 7 July 2016). Xiao, Q.; McPherson, E.G.; Simpson, J.R.; Ustin, S.L. Hydrologic processes at the urban residential scale. Hydrol. Process. 2007, 21, 2174–2188. [CrossRef] Ministry of Land, Infrastructure, Transport and Tourism (MLIT). Introduction of Urban Land Use Planning System in Japan; City Planning Devision of MLIT: Tokyo, Japan, 2013. © 2017 by the authors; licensee MDPI, Basel, Switzerland. This article is an open access article distributed under the terms and conditions of the Creative Commons Attribution (CC BY) license (http://creativecommons.org/licenses/by/4.0/).