Mar 17, 2014 - Physisorption versus chemisorption in inelastic electron tunneling spectroscopy: ... While for the molecule physisorbed on either the hcp.
PHYSICAL REVIEW B 89, 125420 (2014)
Physisorption versus chemisorption in inelastic electron tunneling spectroscopy: Mode position, intensity, and spatial distribution Heiko Gawronski1 and Karina Morgenstern2 1
Institut f¨ur Experimentalphysik, FU Berlin, Arnimallee 14, D-14195 Berlin, Germany 2 Ruhr-Universit¨at Bochum, Lehrstuhl f¨ur Physikalische Chemie I, Universit¨atsstrasse 150, D-44780 Bochum, Germany (Received 10 December 2013; revised manuscript received 4 February 2014; published 17 March 2014) Local vibrational spectra of meta-dichlorobenzene molecules adsorbed on different parts of the Au(111) reconstruction are investigated using a low-temperature scanning tunneling microscope. The spectra show substantial variations on subnanometer length scale. While for the molecule physisorbed on either the hcp or the fcc domain of the reconstruction only low-energy modes are beyond the detection limit, higher-energy modes are observed for the molecule chemisorbed at the elbow site. The different adsorption strengths of the molecules manifest themselves in an energy shift of the modes. These shifts are used to identify through which part the molecule is bonded to the surface. DOI: 10.1103/PhysRevB.89.125420
PACS number(s): 68.37.Ef, 68.43.Bc, 71.15.Mb, 82.37.Gk
I. INTRODUCTION
Inelastic electron tunneling spectroscopy by scanning tunneling microscopy (STM-IETS) offers the fascinating possibility to probe the vibrational properties of individual molecules. In STM-IETS, a small part of the electrons lose energy by exciting vibrations of adsorbates during the flow of a tunneling current through a region of atomic dimensions. The so-called inelastic channel opens when the electron energy matches �ω of a molecular vibration. Above �ω, the inelastically tunneling electron can continue into a different state with a proportionately smaller energy. STM-IETS uses abrupt changes in conductance at �ω/e to measure vibrational energies. The interpretation of spectra is, however, hampered by the fact that usually only a limited number of possible molecular modes is detected. It is a topic of current research to reveal reasons for this quenching [1–5]. For instance, for CO [5,6] and O2 [7], the detected modes were found to depend on the chemical identity of the tip. For H2 O molecules, only three external modes were detectable because of electron-induced diffusion at higher energy [8]. A few larger molecules, for which many more modes are expected, were investigated. For trans-2-butene and its reaction product 1,3-butadiene [9] and for cis-2-butene [10], only the C-H stretch was clearly identified. Obviously, only a limited number of existing vibrational modes are detectable by STM-IETS, but the technical difficulties, the tip identity and induced motion [7,8], are only partly responsible. Consequently, theory has tried to reveal intrinsic causes. It emerged that STM-IETS does not have any strict quantum-mechanical selection rules, i.e., all vibrational modes contribute to the tunneling current. However, some modes have a higher propensity for inelastic tunneling than others [3]. Elaborate calculations of specific adsorbed systems successfully calculated their propensity rules [2,4,5]. The origin of the selectivity in active modes is traced back to the symmetry relationship between vibrational modes and to the electronic structure of the sample and the tip at the Fermi level [2]. On the one hand, the intensity of a mode depends on the precise details of the coupling between the molecule’s nuclear and electronic degrees of freedom. On the other hand, the intensity of a mode depends on the coupling strength 1098-0121/2014/89(12)/125420(5)
between a molecular and a tip orbital. This coupling is related to the degree of vacuum extension of the tunneling active states perturbed by the vibrations. In particular, the symmetry of orbital modes depends on the adsorption geometry of the molecules. Furthermore, there is a preference for coupling between tunneling electrons and dipoles oriented normal, rather than parallel to the electrode plane [5]. In summary, vibrational modes, molecule-substrate and tip electronic states, and electron-vibration couplings have to be considered for determining the intensity of a mode. However, even if the mode is intense, its measurability in experiment depends on the tip’s position above the molecule as calculated [1,11] and measured [12–14]. In this article, we investigate the influence of a not yet explored parameter, namely the molecule’s adsorption strength, on the detectability of STM-IETS modes. We present the spatial distribution of molecular modes of a small organic molecule, meta-dichlorobenzene adsorbed on a surface with distinctly different adsorption sites, Au(111). The spectra reveal a major influence of the molecule’s binding site on the detectability of STM-IETS modes. The different adsorption strengths of the molecule at the different binding sites are corroborated by the energy shifts of the modes. Our results suggest that STM-IETS might be used to determine molecular adsorption strength.
II. EXPERIMENTAL METHODS
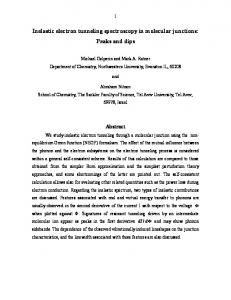
The measurements are performed with a custom-built 5K-STM that facilitates measurements with a noise level of 0.5 pm [15]. The single crystalline Au(111) surface is cleaned by repetitive cycles of Ne+ sputtering (1.3 kV, 2.2 μA, 40 min) and annealing (900 K for 10 min followed by 950 K for 2 min). The molecule deposition follows the recipe used before for deposition of dichlorobenzene on Ag(111) and Cu(111) [16]. The commercial meta-dichlorobenzene [mDClB, see the inset of Fig. 1(b)] shows no detectable impurities in its chromatogram. It is further cleaned by degassing under vacuum conditions at 110 ◦ C. The vapor pressure of the solid m-DClB at room temperature is sufficient for deposition of submonolayer coverage. The vapor is leaked from a glass
125420-1
©2014 American Physical Society
HEIKO GAWRONSKI AND KARINA MORGENSTERN
(a)
elb
ow
1nm
PHYSICAL REVIEW B 89, 125420 (2014)
(b)
(c)
1 nm
fcc
(d) hcp
fcc
1 nm
1 nm
FIG. 1. (Color online) m-DClB adsorption on Au(111): (a) atomically resolved STM image of Au(111) near bulged elbow site, 10 mV, 0.13 nA; (b)–(d) molecules in different adsorption sites, 55 mV, 15 pA; upper insets with four times enhanced contrast and reduced in size to a third; lower insets: molecules in the same orientation as on the STM image, but not to scale: (b) on elbow site; (c) in hcp domain; (d) in fcc domain.
crucible into a steel tube that ends approximately 3 cm in front of the sample. The sample temperature during deposition is 17 K. Measurements are performed at 5 K. Spectra are recorded with a lock-in technique set to the second harmonic of a sinusoidal (361.1 Hz) modulation voltage (6 or 8 mV, peak-to-peak) that is superimposed to the bias voltage. Spectra shown are single unfiltered spectra, which were reproduced on similar parts of the molecule at least three times. The set point is 1.9 × 10⁻¹⁰ A and between −200 and −313 mV. For a better signal-to-noise ratio, sometimes the R-signal of the lock-in is recorded. Thus the absolute value of the dI /dV is shown and the phase information is lost. The correct phase is ensured by recording the x signal for a few spectra (e.g., Fig. 2). Positions of the spectra are drift-corrected to a precision of ±1 pixel. To ensure that the tip and/or changes to the tip do not influence the spectra, a spectrum is recorded on the bare surface before and after a series of spectra taken on the molecule. Only series for which both surface spectra are featureless in the region of interest apart from the substrate phonons [18] are considered for further analysis. Note that measurements are only considered valid if the tip is stable over extended time periods (typically several hours to days).
III. RESULTS A. Surface and molecule
It is well known that the Au(111) surface reconstructs into √ a “herringbone” pattern with a (22 × 3) unit cell, in which the gold atoms in the topmost surface layer are compressed ¯ direction. In STM images, the up to ∼4.2% along the [110] reconstruction shows up as brighter dislocation lines of Au atoms located near bridge positions that separate areas of fcc stacking from those of hcp stacking [19]. Long-range elastic interactions introduce additional domain boundaries, approximately every 14 nm, at which the domains bend by ±120◦ [20]. A so-called bulged elbow site as shown in Fig. 1(a) is associated with a surface dislocation and serves as a preferential nucleation site for a number of different metal adatoms and molecules during growth [21–24].
Despite a preference of m-DClB to follow this trend [Fig. 1(b)], the low adsorption temperature of our experiment leads to adsorption also within fcc and hcp domains [Figs. 1(c) and 1(d)]. Such molecules can be laterally displaced in lateral force manipulation at resistances between 1 and 5 × 10⁷ �, hinting at physisorption. In all adsorption sites, a single m-DClB molecule is imaged as a triangular-shaped protrusion. One of the edges of the triangle is less sharp. The less sharp edge corresponds to the ring side, while the sharp points of the triangle indicate the two chlorine atoms as identified before [16]. Based on this assignment, the orientation of the molecules at the three adsorption sites is deduced [insets in Figs. 1(b)–1(d)].
B. Spectra on hcp and fcc domains
We record spatially resolved vibrational spectra of the differently adsorbed molecules. Spectra of molecules adsorbed in hcp and fcc domains do not differ within experimental precision. Spectra of molecules at elbow sites are distinctly different and will be discussed separately below. We first compare spectra taken above the molecule in a hcp domain to the surface spectrum [Fig. 2(a)]. The surface spectrum shows an inverted peak close to the Fermi level of the substrate. Such a peak results from the substrate phonons [18]. Above the chlorine atoms of the molecule, the peak shows the typical signature of a molecular vibration with a maximum in the positive voltage range and a minimum in the negative voltage range. However, the shape of the peak at ≈ ±13 mV is not consistent with a single Gaussian peak. The spectra recorded above the chlorine atoms of a molecule adsorbed on the fcc domain have a comparable shape and intensity [Fig. 2(b)]. This similarity between spectra recorded on equivalent sites for molecules adsorbed in the two different domains is generally observed. In contrast, the spectra are different above different parts of the molecule. For instance, the peak in the spectra recorded above the ring is more intense and more symmetric than the one above the chlorine atoms [Fig. 2(b), black line]. To investigate the spatial variation of the peaks further, we present a series of spectra taken along a line across a molecule adsorbed in the fcc domain [Fig. 2(c)]. The peak
125420-2
PHYSISORPTION VERSUS CHEMISORPTION IN . . .
PHYSICAL REVIEW B 89, 125420 (2014) TABLE I. Vibrational energies and modes of m-dichlorobenzene in gas phase [17,25].
8
1.5
(a)
6
1.0
(b)
d2I/dV2 (10-9A/V2)
d2I/dV2 (10-8A/V2)
4 0.5 0.0 -0.5 X X
-1.0 -1.5 -200
-100
0
100
0 -2 -4 -6
200
Energy (meV)
2
X
-8 -200
X
0
100
200
V (mV)
V (mV)
1 (c) 1 7
d I/dV (arb. units)
3 4
(d)
broadened calculated modes
2 2
arb units
final spectrum
7 -200
-100
0 V (mV)
100
200
assignment
20.0 24.2 24.4
C–Cl torsion C–Cl torsion C–Cl torsion
Out-of-plane In-plane Out-of-plane
band II
44.6 48.4 52.0 53.6
C–Cl torsion C–Cl stretch C–Cl stretch Ring torsion
In-plane In-plane In-plane Out-of-plane
66.1
Ring torsion
Out-of-plane
81.4 83.7 94.7 95.7
Ring stretch Ring torsion C–H torsion Ring stretch
In-plane Out-of-plane Out-of-plane In-plane
band III
band IV band V
sum
5 6
xy character
X
-100
2
Type
inverted sum
-50 -40 -30 -20 -10 0 10 20 30 40 50 V (meV)
FIG. 2. (Color online) Spectra of DClB adsorbed on the (a) hcp and (b),(c) fcc domain, Vmod = 8 mV, set point at 1.9 × 10⁻¹⁰ A; crosses in STM images indicate the position of the tip during spectroscopy: (a) surface spectrum (black) as compared to two molecule spectra (green and red) above the chlorine atoms; set point at 200 mV. (b) Spectrum above ring (black) as compared to two spectra above the chlorine atoms (green and red); set point at 250 mV. (c) Series of spectra along a line parallel to the chlorine-chlorine line; spectra are shifted along the vertical axis for clarity; vertical lines mark ±11 mV; set point at 250 mV. (d) Simulated spectrum based on calculated modes and efficiencies [25] up to 25 meV (thin vertical lines) and broadened by a modulation of 8 meV and kT at 5 K (thin Gaussian lines); sum of broadened spectra and point symmetric peak of sum (thick black lines as marked); final expected signal [thick cyan (gray) line]; dashed vertical lines mark the same value (±11 meV) as in (c).
energy varies in intensity and shape on the length scale of 0.1 nm. Its maximum varies between 7 and 15 meV. The point symmetry of the peaks identifies them as inelastic signals, which should be compared to vibrational modes of the adsorbed molecule. The gas phase values of dichlorobenzene up to 100 meV are displayed in Table I. The calculated values for the molecule adsorbed on a hcp domain of Au(111) shift only negligibly from these gas phase values, which is indicative of physisorption [25]. In addition, six external modes in the energy range between 3 and 7 meV are expected for a physisorbed molecule, named in the following band I [25]. Three chlorine-related modes between 20 and 25 meV are close in energy (band II). The modes of band I and band II broadened by temperature and modulation broadening and weighted by the calculated efficiencies [25] add up to a peak
at 6 meV with a shoulder to higher energies [Fig. 2(d), black line]. The experimental spectra show a rather similar shape, in particular close to the chlorine atoms [Figs. 2(a) and 2(b)]. The peak position is, however, at higher energy in experiment. This difference is traced back to the fact that the peak is very close to the Fermi level of the substrate. An apparent peak shift to higher energy is induced by superposition with the point-symmetric peak at negative voltage [Fig. 2(d), gray line]. The final peak position at 9 meV is well within the experimentally observed range. From this excellent agreement between experiment and published efficiencies, we conclude that the peak of a nonsingle Gaussian shape results from the weighted superposition of vibrational modes up to 25 meV. The main peak is due to external vibrations in band I. Its efficiency in experiment is a remarkable η ≈ 12%. The main contributions of the shoulder come from out-of-plane C-Cl torsion [25]. We thus stress that apparent peaks in STM-IETS spectra even of small organic molecules should not be assigned to a single vibration, but rather to bands of vibrations. Consequently, the apparent shift in peak position within ±4 meV observed in Fig. 2(c) is attributed to the spatial distributions of the vibrational modes [1,11–14]. We attribute the nondetectablity of modes at higher energy to their low efficiencies due to the weak adsorption of the molecule in the hcp and fcc domains. Physisorption is in agreement with a tiny energy shift of the modes as compared to the gas phase values [25]. C. IETS spectra for molecules adsorbed in an elbow site
More modes should be detectable for more strongly bound molecules. Indeed, the intensity of the modes increases by approximately one order of magnitude for molecules adsorbed at the elbow site (Fig. 3). This higher intensity makes a multitude of modes detectable at higher energy. Furthermore, the spatial variation of the modes on the sub-nanometer scale is more pronounced at different parts of the molecule. Figure 3 demonstrates this variability along a line parallel to the Cl-Cl connection of the molecule [Fig. 3(a)], along the symmetry axis of the molecule [Fig. 3(b)], and along the outer rim from the chlorine atom [Fig. 3(c)]. From these spectra, we determine
125420-3
HEIKO GAWRONSKI AND KARINA MORGENSTERN
(a)
PHYSICAL REVIEW B 89, 125420 (2014)
(b)
(c)
2.50 2.25 2.00
1.50 1.25 1.00
|d2I/dV2|
|d2I/dV2|
|d2I/dV2 (10-7A/V2)|
1.75
0.75 0.50 0.25 0.00 -200
-100
V (mV)
0
100
V (mV)
70
200 -200
-100
0
100
200
V (mV)
70
-200
60
60
60
50
50
50
40
40
40
30
30
30
20
20
20
10
10
10
0
0
0.0
0.5
1.0
1.5
2.0
2.5
-100
0
100
200
V (mV)
70
0
1.0
1.5
x (nm)
x (nm)
2.0
2.5
0.0
0.2
0.4
0.6
0.8
1.0
x (nm)
FIG. 3. (Color online) STM-IETS spectra for m-DCLB adsorbed in an elbow site at positions indicated by crosses in the STM images, the R-signal corresponds to the absolute value of dI /dV ; the topmost spectrum corresponds to the spectrum at the beginning of the arrow; spectra are shifted along the vertical axis for clarity [27]. Top row: STM images; middle row: IET spectra; bottom row: position of maxima extracted from the spectra in the middle row via multiple Gaussian fits; vertical bars represent peak width; horizontal bars represent the region of bands as discussed in the text; different symbols in the highest energy band indicate the different shifts of the chlorine- and ring-related vibrations, respectively. (a) Spectra along the line that connects the two chlorine atoms; spectra at (almost) symmetrical positions in identical colors; Vmod = 6 mV. (b) Spectra along the symmetry axis of the molecule; Vmod = 8 mV. (c) Spectra along the line connecting a chlorine atom with a C5 ring atom, Vmod = 8 mV; set point 300 mV at 1.9 × 10⁻¹⁰ A.
the peak positions (Fig. 3, middle row). Thereby, the peak width (as indicated by the bars) is usually consistent with the superposition of several modes that are close in energy, justifying the discussion of peak bands (cf. Table I). We now compare the spectral positions to the gas phase modes and to the spectra recorded for the physisorbed molecule. We concentrate here on bands I to III, starting with the external modes in band I. These modes are most clearly observed at the edges of the triangle. Their energy is
least affected by the binding. They are with ∼2 meV only slightly blueshifted from the one expected for physisorption. The blueshift is indicative of a stronger binding to the surface. The chlorine-related band II is mostly excited in the inner part of the molecule. The modes are redshifted to lower energy as compared to the gas phase value, which is indicative of a weakening of the internal Cl-C bond. The peaks in band III do not show a common shift. In some regions they are redshifted, in others blueshifted. Note that
125420-4
PHYSISORPTION VERSUS CHEMISORPTION IN . . .
PHYSICAL REVIEW B 89, 125420 (2014)
band III consists of three chlorine-related and one ring-related mode. This suggests that the chlorine-related modes in this band are redshifted as the ones in band II, here to ≈45 meV, but the ring-related mode is blueshifted, here to above 55 meV. The splitting of the peak in some of the spectra [Fig. 3(c) between 0.4 and 0.6 nm] corroborates that not all modes of band III are shifted in the same direction. In summary, the metal-molecule bond and the bonds within the ring are strengthened, while the Cl-C bond is weakened. Such a change in bonding is consistent with a binding of the molecule via the chlorine atoms. Note that for this qualitative comparison, the efficiencies of the modes are not needed, and thus a comparison to gas phase data is sufficient to determine the molecule’s binding.
spatial distribution of its vibrational modes in STM-IETS. This gives another important ingredient to the interpretation of STM-IETS spectra, the only known way to characterize individual molecules chemically. Moreover, the shift in energy is used to identify binding strength and possible binding mechanism, here via the chlorine atoms. This demonstrates that STM-IETS is not only able to provide chemical information about adsorbed molecules, but also the adsorption strength and binding mechanism of the molecules to the surface. We propose that the STM-IETS spectra will be sensitive to binding within molecular clusters. STM-IETS studies might thus be able to give unprecedented insight into intermolecular binding on a single molecule scale. ACKNOWLEDGMENTS
IV. CONCLUSION
In conclusion, we demonstrate for dichlorobenzene on Au(111) that the binding strength of the molecule to the surface influences the intensity, the detectability, and the
We acknowledge extremely helpful discussions with Adolfo Fuentes and Mats Persson, University of Liverpool, UK [26]. We thank the Deutsche Forschungsgemeinschaft for financial support.
[1] N. Lorente and M. Persson, Phys. Rev. Lett. 85, 2997 (2000); N. Lorente, Appl. Phys. A 78, 799 (2004). [2] N. Lorente, M. Persson, L. J. Lauhon, and W. Ho, Phys. Rev. Lett. 86, 2593 (2001). [3] A. Troisi and M. A. Ratner, J. Chem. Phys. 125, 214709 (2006). [4] M. Paulsson, T. Frederiksen, H. Ueba, N. Lorente, and M. Brandbyge, Phys. Rev. Lett. 100, 226604 (2008); N. Okabayashi, M. Paulsson, H. Ueba, Y. Konda, and T. Komeda, ibid. 104, 077801 (2010); S. R. Burema, N. Lorente, and M.-L. Bocquet, J. Chem. Phys. 136, 244507 (2012). [5] A. Garcia-Lekue, D. Sanchez-Portal, A. Arnau, and T. Frederiksen, Phys. Rev. B 83, 155417 (2011). [6] F. Moresco, G. Meyer, and K. H. Rieder, Mod. Phys. Lett. B 13, 709 (1999). [7] J. R. Hahn and W. Ho, Phys. Rev. Lett. 87, 196102 (2001). [8] H. Gawronski, K. Morgenstern, and K. H. Rieder, Eur. Phys. J. D 35, 349 (2005). [9] Y. Kim, T. Komeda, and M. Kawai, Phys. Rev. Lett. 89, 126104 (2002). [10] Y. Sainoo, Y. Kim, T. Okawa, T. Komeda, H. Shigekawa, and M. Kawai, Phys. Rev. Lett. 95, 246102 (2005). [11] J. B. Maddox, U. Harbola, N. Liu, Ch. Silien, W. Ho, G. C. Bazan, and S. Mukamel, J. Phys. Chem. A 110, 6329 (2006). [12] M. Grobis, K. H. Khoo, R. Yamachika, X. Lu, K. Nagaoka, S. G. Louie, M. F. Crommie, H. Kato, and H. Shinohara, Phys. Rev. Lett. 94, 136802 (2005). [13] B. C. Stipe, M. A. Rezaei, and W. Ho, Phys. Rev. Lett. 82, 1724 (1999).
[14] Y. Wang, E. Kioupakis, X. Lu, D. Wegner, R. Yanachika, J. E. Dahl, R. M. K. Carlson, S. G. Louie, and M. F. Crommie, Nat. Mater. 7, 38 (2008). [15] M. Mehlhorn, H. Gawronski, L. Nedelmann, A. Grujic, and K. Morgenstern, Rev. Sci. Instrum. 78, 033905 (2007). [16] V. Simic-Milosevic, J. Meyer, and K. Morgenstern, Phys. Chem. Chem. Phys. 10, 1916 (2008). [17] K. Morgenstern, Prog. Surf. Sci. 86, 115 (2011). [18] H. Gawronski, M. Mehlhorn, and K. Morgenstern, Science 319, 930 (2008). [19] J. V. Barth, H. Brune, G. Ertl, and R. J. Behm, Phys. Rev. B 42, 9307 (1990). [20] S. Narasimhan and D. Vanderbilt, Phys. Rev. Lett. 69, 2455 (1992). [21] B. Voigtl¨ander, G. Meyer, and N. M. Amer, Phys. Rev. B 44, 10354 (1991). [22] J. A. Meyer, I. D. Baike, E. Kopatzki, and R. J. Behm, Surf. Sci. 365, L647 (1996). [23] M. B¨ohringer, K. Morgenstern, W.-D. Schneider, R. Berndt, F. Mauri, A. D. DeVita, and R. Car, Phys. Rev. Lett. 83, 324 (1999). [24] K. Morgenstern, J. Kibsgaard, J. Lauritsen, E. Laegsgaard, and F. Besenbacher, Surf. Sci. 601, 1967 (2007). [25] A. Fuentes, Ph.D. thesis, University of Liverpool, 2014. [26] A. Fuentes (private communication). [27] Spectra are recorded in the region ±300 mV but peaks are only observed below 110 meV, and we concentrate here on the region up to 60 meV for a quantitative analysis.
125420-5