PicoTales: Collaborative Authoring of Animated Stories using Handheld Projectors Simon Robinson,1 Elina Vartiainen,1 Matt Jones,1 Gary Marsden2 1 Future Interaction Technology Lab 2 Dept. of Computer Science Swansea University, SA2 8PP, UK University of Cape Town { s.n.w.robinson, e.vartiainen, Cape Town, South Africa matt.jones } @swan.ac.uk
[email protected] ABSTRACT
In this article we describe a novel approach to collaborative video authoring using handheld projectors. PicoTales are created by sketching story elements on a projector+phone prototype, and then animated by moving the projected image. Movements are captured using motion sensor data, rather than visual or other tracking methods, allowing interaction and story creation anywhere. We describe in detail the design and development of our prototype device, and also address issues in position estimation and element tracking. An experiment was conducted to evaluate the prototype, demonstrating its accuracy and usability for ad-hoc creation of story videos. The potential of the system for story authoring is shown via a further experiment looking at the quality of the animated story videos produced. We conclude by considering possible future developments of the concept, and highlighting the benefits of our design for collaborative story capture. Author Keywords
Mobile projection, story authoring, collaboration. ACM Classification Keywords
H.5.2: Input devices and strategies; Interaction styles. General Terms
Design, Experimentation, Human Factors. INTRODUCTION
People like to create stories together. They may do this while co-located, sitting around a dinner table, for instance, reliving and embellishing a shared experience. They can also now do this in an asynchronous and dispersed fashion, by creating and then adding to a thread of comments and media in a social networking service. Previous work has considered system support for capturing and authoring stories collaboratively. Much work, for instance,
Published in Proceedings of CSCW 2012, pages 671–680, ACM (2012). DOI: 10.1145/2145204.2145306
has considered the important role such interactions can play in education (e.g., [14]) or to aid community enhancement in developing regions (e.g., [15]). Technologically, the platforms proposed have included web and desktops [4]; shared surfaces [8] and mobiles [14]. Unlike the conventional single user mouse and keyboard arrangements, shared surfaces such as TellTable [8] allow more than one person to engage in the process at the same time. This is achieved both directly, by support for multiple person touches and indirectly by groups gathering round and commenting on each others’ efforts. These tabletop approaches, though, have the disadvantage of being fixed to particular locations. Mobile approaches, such as Mobile Stories [14] provide portability, enabling situated storytelling as well as the convenience of usage anywhere. Mobile devices have the further benefit of being particularly suited to developing world contexts where there is sparse access to other forms of computing technology [22]. The relatively small screens, though, bring both potential usability issues and may limit the forms of expression. Furthermore, the types of bystander participation seen with tabletop approaches are not possible. Our work demonstrates a new platform for combining the benefits of larger shared surfaces with those of mobiles. This systems orientated paper, then, shows how pico-projectors and mobile sensors can provide for collaborative authoring. Handheld pico-projectors are an important emerging technology. Now widely available, these portable large displays could potentially be included as a standard component of mobile devices in the near future, bringing many possibilities for interaction beyond small device screens. In particular, their high mobility shows huge potential for collaboration. Naturally, previous research has looked at how these devices might be used and developed as public displays [29], or for group interaction [7]. Here, however, we are interested in the use of projections as input. Rather than using projection to display pre-constructed content, in our research we investigate how these devices might help groups author stories together for later retelling and reuse. We imagine people not just viewing existing stories using pre-compiled content, but also animating projected sketches to create interactive narratives that can then be retold and relived later. Consider the following scenario, which illustrates the approach.
Ajala is a health worker in a rural Indian village. Today she is with a group of young women villagers who are going to help author a story about the importance of giving babies clean water. She gives the storytelling devices to two of the villagers – Nisha and Prapti – and they point the projectors onto the wall in the community centre. Ajala asks the ladies what places in the village have good water – “the well,” they reply. Nisha sketches a well on her device’s touch screen and it is immediately displayed on the wall for all to see. Meanwhile, Prapti draws a woman carrying a water jug on her head; “make the jug bigger!” shout several of the ladies; the others laugh. Prapti moves the drawing of the woman towards the well and Nisha adds an arrow to show that water should come from it. Prapti moves the lady away from the well and Nisha erases her sketch, replacing it with a picture of baby. As Prapti moves the lady towards the baby, Nisha finishes her sketch by adding a smile to the baby’s face. Later, Ajala sends the animated story to her PC and adds subtitles in two local languages. In the weeks to come, health team-members download it to mobile devices to show this village’s story to many other discussion groups. We have constructed a prototype that aims to support this group work by recording projected sketches into jointly-authored video stories – PicoTales. Participants use a mobile interface to draw simple story elements, then animate by pointing and moving the projected image. These sketches are saved by the system, then rendered into animated videos with no further interaction required by the users. The digital packages of content can, however, be edited if necessary. No visual tracking system is required – we take a sensor-based approach, aiming to allow story creation anywhere. The contribution of this paper, then, is to introduce and demonstrate the notion of mobile projection as input for the spontaneous capture of animated video stories. We have had to innovate on infrastructure-free calibration and tracking to provide a robust platform for the system’s applications. This paper describes the system and studies evaluating the accuracy of the tracking and the effectiveness of this lightweight platform in terms of the quality of the stories created. BACKGROUND
The question we consider in this paper is whether we can support collaborative authoring of stories through the combination of pico-projectors and mobiles with motion sensors. As already noted, the work is motivated by previous collaborative authoring studies in various contexts. Our design was further inspired by research on the use of projections for engaging interactions. A key aspect of the platform is the lightweight, sensor based tracking employed. All the technology can be carried in the hand – we do not, for instance, have to deploy arrays of cameras in the environment to capture users’ interactions. We review this work below, highlighting the points of departure evident in our contribution. Motivating Collaborative Authoring
Much of the previous research into collaborative authoring has focused on technologies for children. KidPad [13], for
example, extended existing sketching software to create a mouse-based storytelling environment that intuitively zoomed and panned children’s creations. Stanton et al. [26] built upon this to allow multiple mice to be used simultaneously to encourage groups of children to collaborate in drawing story sketches. Cao et al. [8] investigated multitouch table-based collaborative storytelling with sketching and image capture. Two separate modes allowed children to first create story elements, and then use these to narrate the story. More recently, Fails et al. [14] have investigated how these collaborative storytelling approaches might work on mobile devices. Their mobile system allows children to create booklike stories that draw from text, pictures and audio, using two phones held together to view the content. Balabanovi´c et al. [2] describe StoryTrack, an early digital photo storytelling device that allowed recording of sequences of photos with associated voice annotations. Later work has investigated this type of interaction on mobile phones. Ah Kun and Marsden [1] created a synchronised mobile photo sharing and storytelling application. Each phone user can view and annotate shared photos, and interactions can either be turn-byturn or completely ad-hoc. Related research has investigated how these technologies might be used to help record stories in developing world contexts. Bidwell et al. [5] created a mobile storytelling device aimed at enabling communities in rural Africa to record and share stories with audio and photos. Their findings highlighted the importance of collaboration in authoring, despite not explicitly supporting this behaviour. In contrast to these mouse-, table-, phone- or touch screenbased collaborative approaches, our projector-based prototype focuses on real-time recording of story sketches. Like other collaborative sketching tools (e.g., [30]) we aim to support and promote quick, spontaneous sharing of users’ ideas, as opposed to final polished narratives. Similar table-based storytelling systems can provide an attractive focus point for group story creation, but are as a result restricted to this single location. In our design we aim to allow story sketching anywhere, allowing the storytellers to choose both the place and the size of the surface they use for their creation. Projection
Projection has been used in play and ad-hoc storytelling throughout history [32]. From digital shadow puppets [35] to torch-based exploration [16], researchers and artists have worked to develop digital versions of these interactions. Previous research has investigated the use of both lasers [19] and flashlights to interact with static projected content [21], to play games [9] or to control a projected display [10]. Commercial projector storytelling systems are also available,1 showing story images while children follow along in a book. Other researchers have investigated how projections might be used to interact and play with physical objects. Sugimoto et al. [28] used handheld projectors to guide a robot, finding that the system enhanced engagement and supported storytelling. Games are also a common theme for pico projection – Löchtefeld et al. [18] describe LittleProjectedPlanet, an augmented 1 Magic
Storytime Theatre – Tomy (2007)
reality game that uses real-world objects as levels on which projected balls can bounce and roll. In our design we focus on story capture without the need for visual tracking of the storytelling surface. In other designs, stories based around interaction with real-world objects must be replayed from the same viewpoint, or captured on video. PicoTales are standalone, and can be replayed at a later time based on the recorded movements of the projector. Projector Tracking
Projector-based pointing interaction has previously been investigated (e.g., [3]), including multi-user variants (e.g., [7]), but has usually focused on peephole-type displays [20], or shadow pointing to the projected image to interact [11]. The majority of these systems have made use of visual-based device tracking methods, primarily due to their higher accuracy. Some previous systems (e.g., [3]) use cameras on the projection device but do not discuss tracking accuracy; others (e.g., [6]) use commercial image-based tracking systems with high (up to millimetre-level) precision, but substantial cost.2 These previous methods either require infrastructure to be placed in the environment [7], or have limitations with respect to the distance that participants can stand from each other and the projection surface [25]. In our prototype we use a sensor-based approach, sacrificing pinpoint accuracy for the ability to project and interact spontaneously in any location – our aim is to be both affordable and portable. As a result, in evaluating our system a key question is the extent to which our low fidelity sensor-based design might impact on the value of the system for creating stories that can be later shared. Previous sensor-based projection tracking designs have used fixed positions [12], or made assumptions about the user’s arm position [23]. Willis et al. [34] used motion sensor input for pointing-based games, incorporating an ultrasonic distance sensor, though this was used only for evaluating users’ pointing behaviour. While motion sensors are common on current mobile devices, long range distance sensors are unfortunately not currently included. More recently Willis et al. [33] have developed a camera-based approach, using a customised camera+projector with infrared fiducial markers for tracking. Their approach is an alternative to the sensor-based tracking we demonstrate, but it requires new devices and also does not allow tracking of projections outside the view of the device’s camera. To allow for a potential implementation on current devices, in our design we use a novel projector-based position and movement estimation procedure that predicts where users are located relative to each other and to the projection surface. Strachan and Murray-Smith [27] found sensor data to be sufficient for this type of pointing-based interaction even in high-uncertainty scenarios. In a similar approach to ours, Lee and Keh [17] used sensor data for simple position calibration, but at fixed distances from a wall, unlike in our prototype. Lee and Keh also noted the importance of accounting for shifts in users’ arms as they move the device. In our design, a one-time calibration step when first using the device aims to measure this arm shift, and improve tracking accuracy as a result. 2 Vicon
Bonita (vicon.com), for example; $10,000 upwards
Nokia 5800
Optoma PK101
SHAKE SK6
Figure 1. The PicoTales prototype. Each user holds their phone in-hand, sketching on the device’s screen and moving it to animate their projected story. Movements are recorded by the attached sensor pack. Figure 2. The simple phone-based sketching interface for drawing PicoTales. Users touch the screen to draw, selecting one of the coloured squares to use that colour, or × to erase the current sketch. The entire display (including the interface elements) is projected, but only the sketch is shown in the resulting story animation.
PICOTALES PROTOTYPE
Our PicoTales prototype allows groups of people to draw and project simple sketches to author their stories. Projected story elements and interactions are automatically composed into a video animation of the action. Rather than using an integrated projector phone, we chose to combine three separate components, as current all-in-one models lack sufficient battery life and the sensors required for our approach. The prototype setup consists of a Nokia 5800 mobile phone, firmly attached to an Optoma PK101 projector and a SHAKE SK6 sensor pack [31]. Figure 1 shows the device configuration. A Python application on the phone provides the simple user interface. Story videos are created by a separate PC at present, to allow easier viewing of the resulting stories, though this step could be incorporated into the phone client in future versions. Our prototypes connect wirelessly to the story PC, streaming live accelerometer and magnetometer data, and receiving commands when user actions are required. Authoring Stories
Each story participant holds one of our prototypes in-hand, with several participants able to take part in each story – we have tested with up to three simultaneous users. Each time participants create a PicoTale they are prompted to perform a lightweight distance estimation step before they begin. This allows the system to calculate their positions relative to each other, and their distance from the projection surface (see next Section for technical details). The phone then displays the interface shown in Fig. 2, and starts recording the story from this point onwards until users exit the application. Participants draw on the phone’s screen to tell their story, pointing the projected sketch to interact with other participants’ drawings, and moving it to animate. While users sketch and move the phone, realtime sensor data is recorded to track
animating their story elements by pivoting the phone around its axis could point to the same positions as another who moves their whole arm to animate, but the resulting sensor data would not reflect the extent of their movements. We address this issue with an approach similar to the calibration procedures often used for touch screens, by using the results from a one-time calibration step to scale the real-time sensor data that is recorded while users project. Provided that story participants are consistent in their pointing method (rotation or translation), this approach allows us to more accurately track the positions that they point to on the surface.
ܬ1 m
d θ Pri.
Pri.
Sec.
Figure 3. Estimating participants’ positions. Step 1: The first (primary) participant initially points straight ahead at the projection surface, then estimates 1 m above, below, left and right of this point. Step 2: Other (secondary) participants join the session by pointing to each of four markers projected by the first.
where they are pointing to on the projection surface. All of the movements and sketches are recorded in the resulting story video. Currently only the visual story elements are recorded – we imagine users narrating as they animate, but we do not yet record the audio in the current implementation. When participants finish their story, a separate PC creates the PicoTale. The logged sensor data is analysed to calculate the position each participant was standing during the story, and to track where they pointed while projecting each sketched story element. This is then brought together into an XML version of the story, containing the sketch data and all the timings, positions, and zoom levels required to show the elements in the positions they were projected. This PicoTale can then be played back immediately on-screen, or exported as a video. Our current prototype only supports viewing of the PicoTale, but because we record both sketches and their positions, we plan future versions that allow later editing and reshaping of the animation. At first, users could retell the story with the same visual content, but just as the narrative evolves over time, so too could the visual elements of the PicoTale. TECHNICAL CHALLENGES
In order to allow story creation on any surface, rather than just in places with visual tracking capabilities (e.g., [6]), we take a motion sensor-based approach to user and device position tracking. Although less precise than visual methods, this approach offers benefits that we believe outweigh its inaccuracies – we allow story creation anywhere, and record the actual sketches that users create, rather than a video. Tracking
Sensor-based tracking gives only the orientation of a device, rather than its position in 3D space. As a result, a person
Effective tracking also requires knowledge of the distance of the projection surface from the user, because the angle at which they hold the device, and thus the position of their sketch on the surface, is dependent on its position. For example, consider pointing to an object on a wall from 0.5 m, then moving back and pointing to the same object from 2.0 m. In both cases the target object is the same, but the amount of movement required is considerably different. To address this, a short calibration step before each story authoring session estimates the surface distance via simple trigonometry. Position Estimation
When using the PicoTales application for the first time, people are prompted to measure and stand 1 m away from a wall. The device then guides them through a calibration procedure – pointing straight ahead and then estimating 1 m to the left and right, then 1 m above and below the original point – see Fig. 3, part 1. Because the distance from the projection surface is known to be 1 m, we can calculate the actual distance they moved the device: d1 = 1 × tan θ1 . Future distance estimations do not require the user to measure 1 m from the surface; only the four 1 m estimates are required. We can then estimate the distance from the surface: d2 = d1 ÷ tan θ2 . When only one person is telling a story, it is sufficient to know the distance of the surface to accurately track their pointing. For more than one participant, we must also discover their positions relative to each other. When additional (secondary) participants use the PicoTales application, their positions are estimated by pointing to four markers projected by the first (primary) participant. The primary participant points straight ahead while the others point to each marker in turn when highlighted – see Fig. 3, part 2. This procedure gives four estimates of secondary participants’ relative positions. Currently we use these estimates to calculate relative positions and heights between users – in our prototype we assume that all participants stand at the same distance from the wall. In total the distance estimation procedure takes around 14 seconds for two participants (average 9 s primary, 5 s secondary, based on data from our experiment). EVALUATION
We evaluated the PicoTales prototype in two experiments, studying both technical and story authoring aspects. The first investigated the reliability and limitations of our sensor-based position estimation and tracking methods. The second study focused on authoring, and the value of the system for sharing.
STUDY 1: POSITION & TRACKING
Wall 1
D5
Position Estimation: Can our position estimation methods reliably determine where users are standing relative to the projection surface?
D4
T1 Tracking positions
0.5 m
Tracking: Can sensor-based pointing tracking accurately predict where story elements are projected?
0.5 m
Wall 2
0.5 m
Because our approach is technically very different to visualbased approaches, it is essential to test its accuracy for creating story videos that closely portray the animations users create. Our research questions were:
1.0 m
Tasks and Measures
D3
0.5 m
0.5 m
D2
T2
2.0 m
T3
Task 1: Position Estimation
To assess the real-world technical limitations of our positioning method it is important to measure its accuracy from a range of surface distances and user positions. We studied three separate distances and four separate secondary participant positions, allowing us to quantify position estimation accuracy from a range of distances and projection angles that represent the approximate usable range of the projector. At the start of the task, the height at which each participant naturally holds the device is measured in order to be able to compare the position at which the projector is actually held with the estimates given by the system. One participant (P1 hereafter) then performs the primary position estimation procedure while standing at position D3 on Row 1 (see Fig. 4), pointing straight ahead on Wall 1, then 1 m left, right, above and below this point. P1 then moves to position D1 and Participant 2 (P2 hereafter) performs the secondary position estimation procedure from positions D2 –D5 , pointing to each of the markers projected by P1 while P1 remains at position D1 . P1 then repeats the primary position estimation procedure, and then stands at position D5 while P2 repeats the secondary position estimation from positions D4 –D1 . This procedure is repeated on rows 2 and 3. Following this, the entire task is repeated with participants’ roles reversed – i.e., P2 moves to D3 to complete the primary estimation procedure, with P1 now following the secondary estimation procedure. In total, then, after each participant has completed the task in both primary and secondary roles, this task measures six primary and 24 secondary position estimates per person. Because participants are standing at known positions we are able to compare the estimated position with their actual position and measure the accuracy of our estimation procedure. Task 2: Tracking
Each participant stands in turn at position T1 (see Fig. 4), and points a projected circle to each of 15 tracking points on Wall 2. Points are labelled on Wall 2 in three rows of five markers at 0.1 m, 1.1 m and 2.1 m above the ground, on an evenly-spaced grid 1 m apart. The points are aligned so that the centre marker on each row of five is directly in front of the participant, with two either side on each of the three rows. The centre point is highlighted, and the remaining points are numbered 1–14. The markers are on a separate wall to that used for the position estimation task to avoid influencing 1 m estimates in that task.
D1 Row 1
Row 2
Row 3
Distance estimation positions
Figure 4. Participant locations and surfaces used for the study, viewed from above as marked on the floor of the user study lab. Position estimation took place from all 15 evenly-spaced positions (D1 –D5 on rows 1–3), projecting onto Wall 1. Tracking tasks used positions T1 – T3 , projecting onto Wall 2. Story authoring took place from positions D3 and T2 , again projecting onto Wall 2.
Participants complete this task individually, pointing first to the centre point, then to a random tracking point as instructed by the device, then back to the centre point. This procedure is repeated for each point at each of the three positions T1 – T3 . This task, then, measures 42 pointing estimates for each participant, allowing analysis of the differences between the system’s estimated pointing positions and the actual (known) positions pointed to by participants for each point. Procedure
16 participants (8M; 8F) aged from 18 to 65 were recruited to take part in a lab study. Two were left-handed, the remainder were right-handed. Ten participants were students, six were members of university staff. There were ten study sessions in total: four of the participants attended individually, completing the position estimation and tracking tasks; 12 participants took part in pairs. Participants had not met prior to the study. Two researchers managed the study, with one observing participants’ behaviours and the second guiding participants through the tasks. Study sessions took place in late afternoon (between 3:30pm and 5:30pm) due to the lighting constraints of the projectors, with sessions ranging in length from 30–90 minutes depending on participants’ approach to each task. At the start of each session each participant was met by the researchers, and introduced to the system and its purpose. Participants were then guided through an ethically-reviewed informed consent process, and given a short demonstration of using the system to create a sketched story. The resulting PicoTale was then replayed to the participants to highlight how the system might be used to record projected content.
0.0
Distance from surface (m)
Following this demonstration participants were led through the position estimation and tracking tasks. Participants were encouraged to try to be accurate when pointing, but asked to not spend a large amount of time being excessively precise – although the study is clearly evaluating the system in a controlled environment, we were keen to investigate its accuracy in likely real-world conditions, rather than just the best possible use case. To ensure we were able to compare position estimations with the actual location of the user, participants were asked to, when standing in each position, align themselves so that their hand holding the device was positioned over the appropriate position marker (rather than their feet). For participants who took part alone, the markers required for the secondary position estimation procedure were displayed by a projector held by one of the researchers.
Primary position estimation accuracy
0.5 1.0
Projection surface
1.5
Actual distances
2.0
Distance estimates median mean
2.5
min, max
3.0
Figure 5. Primary position estimation accuracy. Estimations are more accurate when participants are closer to the projection surface.
Secondary position estimation accuracy
Finally, a short interview took place to gather opinions about the system, its usability and suggested usage scenarios. After the study each participant was thanked for their time and rewarded with a bookstore voucher as a token of our appreciation. Results and Analysis
Six primary and 24 secondary position estimates were gathered for each participant from each of the angles and positions shown in Fig. 4. Most needed some guidance from the researcher as to where they needed to stand for each position estimation step, but all completed the remainder of the task unaided. Many different approaches to the task were seen, including a large variation in 1 m estimations that was very clear from observation alone. For example, one participant approached this task by holding out their (non-device) hand to their side and lining up the projector beam with this in order to estimate the 1 m distance – an interesting approach that could help improve the accuracy of their distance estimation. There were also many different methods for pointing the projector – for example, two of the participants moved their whole body, several moved their arm only, and others instead rotated their wrist to direct the projection. Position Estimation
Turning first to the primary position estimation results, estimating distances from the projection surface. Figure 5 shows the distance estimates for all 16 participants combined, comparing the known position with that given by the system. Distance estimation is more accurate at 1 m from the surface, with a mean estimate of 1.08 m (sd: 0.07 m), increasing to 1.60 m (sd: 0.28 m) at 1.5 m, and 2.11 m (sd: 0.40 m) at 2 m from the wall. As previously noted, participants often made inaccurate and highly variable guesses of 1 m. However, as our results indicate, errors in distance estimation that would be caused by this variance have been mitigated by the one-time initial step we use to calibrate participants’ 1 m estimation accuracy. Turning now to the secondary position estimation results, estimating participants’ positions relative to each other. Estimates are far more accurate when participants are closer together, tending to diverge when participants are positioned further away from each other. Figure 6 shows the range of position estimations for each distance from the projection surface and at 0.5 m and 1.0 m distances between the users, combined over
Projection surface
0.5 m
Actual participant positions Estimated position at each surface distance 1.0 m 1.5 m 2.0 m
1.0
Secondary
Primary
Secondary
1.0
1.0 m
1.5
Secondary
0.5
Primary
0.5
Secondary
1.5
Distance between participants (metres)
Figure 6. Secondary position estimation accuracy with participants standing 0.5 m (top) and 1.0 m (bottom) away from each other. During the task, secondary participants completed the procedure while standing both to the left and to the right of the primary participant – their actual position in each case is shown as a blue vertical line. The position of the primary participant is indicated by the red vertical line. Box plots show the positions estimated by the system when both participants were standing at 1.0 m, 1.5 m and 2 m from the surface. Estimations are more accurate when participants are closer to each other and to the surface.
all 16 participants. At these distances the estimates are within 0.25 m of the known positions (0.5 m: 0.40 m (sd: 0.15 m); 1.0 m: 0.75 m (sd: 0.33 m)). However, as participants moved further away from each other to 1.5 m and 2.0 m (not shown above), the deviation in estimations increases (mean: 1.22 m; sd: 0.75 m and mean: 1.84 m; sd: 0.88 m respectively). Tracking
Forty-two tracking estimates were recorded per participant. There were 28 errors where participants misread the instruction and subsequently pointed to an incorrect marker. We removed these outliers, leaving a total of 644 estimates. Table 1 shows the distance errors between the positions estimated by the system and the actual positions the participants were pointing to for each of the markers in the grid when standing at 1.0 m and 1.5 m from the wall. For points in columns 2–4 the tracking of participants’ pointing is more accurate than those further away, where the position estimation varies more widely, and is clearly less accurate. This result
Row \ Col
1 2 3 Row \ Col
1 2 3
Tracking points grid – participant at 1.0 m from the wall 1 2 3 4 5 0.97 (0.4) 0.33 (0.2) 0.23 (0.1) 0.35 (0.1) 1.39 (0.3) 0.77 (0.3) 0.30 (0.2) – 0.35 (0.3) 0.75 (0.8) 1.15 (0.3) 0.82 (0.2) 0.69 (0.3) 0.63 (0.4) 1.40 (0.7) Tracking points grid – participant at 1.5 m from the wall 1 2 3 4 5 0.72 (0.4) 0.35 (0.2) 0.46 (0.1) 0.39 (0.1) 1.30 (0.4) 0.93 (0.6) 0.31 (0.2) – 0.32 (0.2) 0.72 (0.5) 1.06 (0.4) 0.72 (0.5) 0.89 (0.3) 0.69 (0.4) 2.01 (1.2)
Table 1. Tracking accuracy, showing the mean absolute distance (metres (s.d.)) between the known point that the participant pointed to, and the estimate given by the system, at 1.0 m and 1.5 m from the wall. ‘–’ represents the central point of the grid. Closer points (those within 1 m either side of the centre of the grid) are tracked more accurately than those further away. Tracking is less accurate at greater distances.
extent to which the low resolution of the sketches reduced their understanding of the story. Each question asked participants to rate the video on a Likert-type scale from 1 (‘not at all’) to 7 (‘to a great extent’). After the study participants were rewarded with a gift voucher as a token of appreciation. To maintain the anonymity of the original participants, we transcribed the conversations that took place during the story authoring sessions, and added these as subtitles to the original videos. Conversations were presented in subtitles exactly as they took place – we did not remove non-narrative elements or edit to improve comprehension. As a result, each story was shown as it might be represented if it had been created by real users rather than during an experiment. Results and Analysis
echoes that of the position estimation task, with relatively accurate position estimation possible up to around 1.5 m, and deviation rapidly increasing beyond this. Interestingly, in this task, points positioned lower on the wall have been less accurately tracked in all cases, suggesting perhaps that angling the device precisely towards a point near to the ground was more challenging than pointing to those markers placed higher. STUDY 2: STORY AUTHORING
Our second investigation focused on the story authoring aspect of the system, looking at whether the prototype resonates with the people that use it, and at how effective the resulting videos are at telling the story to others. Our research questions were: Story Authoring: What are participants’ reactions to the concept, and how do they use it to animate stories? Story Comprehension: To what extent can people other than the creators understand the stories from the videos generated? Method
Twelve of the participants who took part in our first study in pairs also authored stories together, giving six story videos in total. Participants were not given time to prepare a narrative, just asked to animate a story together, about any subject they wished. When story authoring finished, the resulting PicoTale was shown to them on a separate PC, and they were asked to think aloud while a researcher noted their comments. Following methods used by others (e.g., [24]), we conducted a separate story comprehension study in order to evaluate the potential of the system’s animated videos for storytelling. 79 participants (39M; 40F) aged from 18 to 65 were recruited to complete a web-based questionnaire to assess each of the videos. Each person was sent a unique login code for the study website and could complete the questionnaire at their convenience. 55 participants were students, 24 were members of university staff; none had participated in the first study. Participants were asked five questions about each video, rating the extent to which the video was understandable; whether the video was a useful representation of the story; if the entities in the conversation appeared in the video; whether there were meaningful interactions between sketched elements; and, the
The six pairs of participants who created story videos were enthusiastic about using the system to create animations, with most commenting that storytelling was fun and enjoyable. All 79 story comprehension participants rated the videos on each scale, and most gave further comments about the concept’s potential and its usefulness for storytelling. Story Authoring
Two distinct approaches were observed during story authoring. Two of the PicoTales were very much pre-planned, with participants choosing a familiar nursery rhyme and then animating the story as required. The eight remaining participants created animations more spontaneously by beginning to draw characters first, and then deciding what storyline to act out as the story progressed. All participants took time to negotiate with each other to agree on who would create each element, then collaborated to move the elements into place and animate interactions between them. Even when the storyline to animate was planned beforehand, all stories were told as part of a conversation rather than pre-agreed dialogues – participants interleaved the narration with their discussion about how to progress the storyline via their sketches. All participants drew at least one sketch each, but three of the pairs sketched and erased several times to draw up to eight different story elements per person. The three remaining pairs drew only one story element per person. All participants edited or added to their sketches several times after initially projecting, however. Participants tended to draw, then animate briefly before adding more detail and reusing the same element in another part of the storyline. Most participants looked at the projected image ahead while sketching, rather than looking down at the device’s screen. The PicoTales generated were between 1 and 5½ minutes in length (average 2:48 minutes; sd: 1:45). The two stories that were pre-arranged were the shortest, and also involved only one sketched character per person. Participants in these stories spent most of their time sketching the characters, and then only briefly animated the nursery rhyme that they had chosen. Several participants, including those who had pre-arranged a storyline, stated that they thought that they would have been able to author a more interesting story if they had had more time to plan beforehand: “it was good, except for that fact
1
2
To what extent ...did you understand the story in this video? ...was the animation a useful representation of the story described in the subtitles? ...did the entities described in the conversation appear in the video? ...could you perceive meaningful interactions between the sketched elements in the video? ...did the low resolution of the sketches reduce your understanding of the video?
Average rating for each video (s.d.) 1 2 3 4 5 6 4.8 3.9 5.2 4.4 5.4 4.6 (1.7)
(1.9)
(1.4)
(1.5)
(1.6)
(1.8)
4.5
2.3
4.5
4.1
4.0
4.5
(1.5)
(1.3)
(1.7)
(1.5)
(1.6)
(1.7)
5.2
3.7
5.1
4.9
4.6
5.0
(1.3)
(1.8)
(1.3)
(1.3)
(1.4)
(1.5)
4.2
2.7
4.5
4.0
4.2
4.2
(1.5)
(1.4)
(1.6)
(1.5)
(1.7)
(1.6)
2.8
3.9
3.2
3.5
3.2
2.9
(1.7)
(2.1)
(1.6)
(1.7)
(1.8)
(1.6)
Table 2. Video ratings, showing the mean and standard deviation of each rating given for each video. Participants answered each question on a Likert-type scale from 1 (‘not at all’) to 7 (‘to a great extent’).
3
5
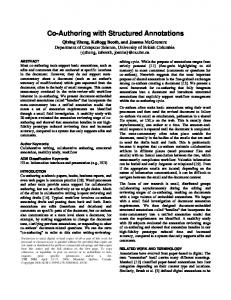
Figure 7. Representative frames from a selection of the stories authored by participants. In each case, a frame from the video of the actual projected story is shown on the left, and the system’s rendering at the corresponding time is shown to the right. Numbers correspond to those in Table 2. Interface elements are projected, but are not shown in the PicoTale. Some participants (video 2, for example) spent a long time sketching; others found simpler elements to be more effective.
that we didn’t really have a story” and “if we’d had more time to decide what to draw, it would have been easier.” Clearly the restrictive environment of the study has affected some participants’ story authoring experiences. Others appreciated the simple interface – one participant said: “the simplicity is actually quite a good thing, because it takes away the focus on the technology rather than the story that’s being generated.” Some participants commented that they
would like to be able to draw more than one character at a time, however. Rather than just sketching and erasing, these users would have preferred a more complex drawing interface that could re-load previous sketches or other content. Figure 7 shows four examples of the actual projected content (left), compared in each case to the PicoTale animation at the corresponding time (right). Story authors liked watching their animation when it was replayed to them. Participants appreciated the value of the system for authoring, but noted that movement accuracy could be improved. Horizontal movement was usually more accurate than vertical, with comments such as “overall the drawing was fine but the positioning was slightly off; [the positioning] is accurate around 70-80% of the time – close but not exact” and “the likeness is obviously spot on [...] they’re going in the right directions, but [vertically] they’re not quite in unison.” Many suggested uses were noted for the system beyond story authoring, including several typical pico projector applications: mobile business uses and slideshow annotation, for example. More novel suggestions included helping with language learning by demonstration, developing world education support, and annotating (and animating) everyday objects. One participant commented that using the system was “not practical, but fun [...] like a game”, while another felt that it was a “new way of interacting.” Story Comprehension
Table 2 shows the ratings for each video averaged over the 79 participants who completed the story comprehension study. Ratings show that viewers were able to understand the videos and that, in most cases, the animation was a useful representation of the story. Despite the original participants having no training and limited sketching tool capabilities, they have been able to use the PicoTales system to author meaningful stories that can be understood by others who have had no experience with the system. Viewers were able to recognise the elements described in the narrative from the sketches they saw in the video. Despite
positioning inaccuracies caused by our lower-resolution tracking, the viewers could also perceive meaningful interactions between story elements.
creation of animated stories that are understandable after the event. However, we have not studied the impact of the approach on people’s storytelling behaviour.
When the quality and comprehensibility of the drawings are better, the ratings given have improved. Lower quality sketches have led to lower ratings for videos, despite the presence of subtitles. Comparing the snapshots in Fig. 7 for video 2 with those of video 3, for example, shows a clear difference in sketch legibility. This has been reflected in the ratings for video 2, which was consistently rated lower. This video told a simple pre-arranged nursery rhyme, the storyline of which is likely to have been familiar to most viewers. However, video 2 was also rated as less understandable than video 5, which told another familiar nursery rhyme. Both stories were narrated in the conversation in addition to the sketches, but video 5 has been rated as more understandable, with more meaningful interactions between sketches. The sketched elements in the stories have helped viewers to follow along and understand the narratives.
In our story authoring study we saw that people were able to create PicoTales with very little preparation. However, future implementations of the technology will need to consider how the spontaneous and unplanned usage we aimed for affects the way that people actually recall and tell their stories. We have since added facilities for including pre-loaded content, but other extensions might have to allow for slower and more considered reflection, rather than impromptu narratives.
CONCLUSIONS
In this paper we have demonstrated and evaluated a novel pico projector-based story authoring tool. We believe this is the first example of using pico projectors to interactively author and record content by tracking device movements. Participants in our experiment were able to author stories together despite having had no previous experience with the system, and not knowing that they would have to create stories before using the prototype. The stories that were created were understandable by other people later. Participants in our experiment enjoyed using the prototype, and were able to successfully author animated PicoTales. People liked the notion of using a projector for authoring. We have provided this interaction using sensor-based tracking rather than the more constrained visual methods that have often been used previously. Clearly the tradeoff of our method is that the fidelity of the tracking is lower, but we believe that this is offset by our higher flexibility, lower cost and no requirement for nonstandard hardware. We are also able to remove restrictions in the positions that people can stand relative to each other and the surface they are projecting onto, by estimating these in a short calibration procedure before story authoring begins. Following our initial study we have incorporated feedback from participants into the system’s design, and have added several requested features. Our system now allows users to select between projecting sketches, images already on the phone, or photos taken with the device’s front camera. Each of these story elements is projected and tracked as before, and appears in the resulting video. This addition allows story authors to include people or objects directly in the narrative – rather than sketching a figure, for example, they can take a photo of themselves and insert it in the PicoTale.
Furthermore, stories have clearly been told and retold throughout history without any advanced technology. We have shown that the stories created by our prototype were understandable when viewed later, but did not investigate whether emotional impact or memorability were actually improved by augmenting storytelling with digital imagery. Future uses of such story authoring tools might focus less on sketching of stories, and more on ways to use the tools to support people’s narratives. Future Work
In our initial prototype we have shown how some of the key issues in tracking and position estimation can be addressed, allowing people to author stories that are understandable by others. Our current position estimation method can accurately estimate distances and relative user positions at smaller distances; at greater distances the level of precision is lower. Tracking of where users point the device is accurate to a similar extent. Our current approach, therefore, provides a quick way to allow story authoring via projector tracking and distance estimation without the overheads and location restrictions of visual or other methods. Our future work will explore potential improvements to both technological and story authoring elements of the system. One exciting potential use for the system lies in the developing world. In their work on digital storytelling in Africa, Bidwell and Retmaier et al. [5] noticed how stories were recounted collaboratively: storytellers would speak in rapid succession, each adding their part to the narrative. The downfall of the digital storytelling system that was created was that it ran on a single handset, making it impossible to capture a collaborative story. Still relying only on individual handsets, the integration of the system we have created allows these shared stories to be authored and shared in a more natural way. Furthermore, the lack of light in most dwellings in Africa (there is little mains electricity in much of the continent) means that pico projectors are ideally suited to the environment – bright projections are not required, so current technology would be suitable. ACKNOWLEDGEMENTS
This research is funded by EPSRC: EP/J000604/1 and EP/I001 778/1. Elina Vartiainen is supported by the Wihuri Foundation. REFERENCES
Impact of the Approach
In this research we have investigated the limitations of the PicoTales prototype, and shown its ability to support the
1. Ah Kun, L. and Marsden, G. Co-present photo sharing on mobile devices. In Proc. MobileHCI ‘07, ACM (2007), 277–284.
2. Balabanovi´c, M., Chu, L. and Wolff, G. Storytelling with digital photographs. In Proc. CHI ‘00, ACM (2000), 564–571. 3. Beardsley, P., Baar, J. van, Raskar, R. and Forlines, C. Interaction using a handheld projector. IEEE Computer Graphics and Applications 25.1 (2005), 39–43. 4. Bers, M. and Best, M. Rural connected communities: a project in online collaborative journalism. In Proc. CSCL ‘99, ISLS (1999), 41–46. 5. Bidwell, N., Reitmaier, T., Marsden, G. and Hansen, S. Designing with mobile digital storytelling in rural Africa. In Proc. CHI ‘10, ACM (2010), 1593–1602. 6. Cao, X. Handheld Projector Interaction. PhD thesis. University of Toronto, 2009. 7. Cao, X., Forlines, C. and Balakrishnan, R. Multi-user interaction using handheld projectors. In Proc. UIST ‘07, ACM (2007), 43–52. 8. Cao, X., Lindley, S., Helmes, J. and Sellen, A. Telling the whole story: anticipation, inspiration and reputation in a field deployment of TellTable. In Proc. CSCW ‘10, ACM (2010), 251–260. 9. Cao, X., Massimi, M. and Balakrishnan, R. Flashlight jigsaw: an exploratory study of an ad-hoc multi-player game on public displays. In Proc. CSCW ‘08, ACM (2008), 77–86. 10. Chatting, D. and Sutton, J. Visible imagination: projected play. In Proc. HCI ‘09, BCS (2009), 405–409. 11. Cowan, L. and Li, K. ShadowPuppets: supporting collocated interaction with mobile projector phones using hand shadows. In Proc. CHI ‘11, ACM (2011), 2707–2716. 12. Dao, V., Hosoi, K. and Sugimoto, M. A semi-automatic realtime calibration technique for a handheld projector. In Proc. VRST ‘07, ACM (2007), 43–46. 13. Druin, A., Stewart, J., Proft, D., Bederson, B. and Hollan, J. KidPad: a design collaboration between children, technologists, and educators. In Proc. CHI ‘97, ACM (1997), 463–470. 14. Fails, J., Druin, A. and Guha, M. Mobile collaboration: collaboratively reading and creating children’s stories on mobile devices. In Proc. IDC ‘10, ACM (2010), 20–29. 15. Frohlich, D., Rachovides, D., Riga, K., Bhat, R., Frank, M., Edirisinghe, E., Wickramanayaka, D., Jones, M. and Harwood, W. StoryBank: mobile digital storytelling in a development context. In Proc. CHI ‘09, ACM (2009), 1761–1770. 16. Ghali, A., Benford, S., Bayoumi, S., Green, J. and Pridmore, T. Visually tracked flashlights as interaction devices. In Proc. Interact ‘03, IOS (2003), 487–494. 17. Lee, G. and Keh, Y. A novel interface and application using synchronized multi projector phones. In MP² Workshop at CHI ‘11, 2011. 18. Löchtefeld, M., Schöning, J., Rohs, M. and Krüger, A. LittleProjectedPlanet: an augmented reality game for camera projector phones. In MIRW Workshop at MobileHCI ‘09, 2009.
19. Olsen Jr., D. and Nielsen, T. Laser pointer interaction. In Proc. CHI ‘01, ACM (2001), 17–22. 20. Rapp, S., Michelitsch, G., Osen, M., Williams, J., Barbisch, M., Bohan, R., Valsan, Z. and Emele, M. Spotlight navigation: interaction with a handheld projection device. In Pervasive ‘04 Videos, 2004. 21. Reeves, S., Pridmore, T., Crabtree, A., Green, J., Benford, S. and O’Malley, C. The spatial character of sensor technology. In Proc. DIS ‘06, ACM (2006), 31–40. 22. Reitmaier, T., Bidwell, N. and Marsden, G. Field testing mobile digital storytelling software in rural Kenya. In Proc. MobileHCI ‘10, ACM (2010), 283–286. 23. Robinson, S. and Jones, M. HaptiProjection: multimodal mobile information discovery. In Ubiprojection Workshop at Pervasive ‘10, 2010. 24. Sharmin, M., Bailey, B., Coats, C. and Hamilton, K. Understanding knowledge management practices for early design activity and its implications for reuse. In Proc. CHI ‘09, ACM (2009), 2367–2376. 25. Shilkrot, R., Hunter, S. and Maes, P. PoCoMo: projected collaboration using mobile devices. In Proc. MobileHCI ‘11, ACM (2011), 333–336. 26. Stanton, D., Neale, H. and Bayon, V. Interfaces to support children’s co-present collaboration: multiple mice and tangible technologies. In Proc. CSCL ‘02, ISLS (2002), 342–351. 27. Strachan, S. and Murray-Smith, R. Bearing-based selection in mobile spatial interaction. Personal and Ubiquitous Computing 13.4 (2009), 265–280. 28. Sugimoto, M., Ito, T., Nguyen, T. and Inagaki, S. GENTORO: a system for supporting children’s storytelling using handheld projectors and a robot. In Proc. IDC ‘09, ACM (2009), 214–217. 29. Virolainen, A., Åkerman, P. and Häkkilä, J. Burn-to-share: content sharing with mobile projectors. In Proc. MUM ‘10, ACM (2010), 18:1–18:4. 30. Weibel, N., Cowan, L., Pina, L., Griswold, W. and Hollan, J. Enabling social interactions through real-time sketchbased communication. In Proc. UIST ‘10 Demos, ACM (2010), 405–406. 31. Williamson, J., Murray-Smith, R. and Hughes, S. Shoogle: excitatory multimodal interaction on mobile devices. In Proc. CHI ‘07, ACM (2007), 121–124. 32. Willis, K. A pre-history of handheld projector-based interaction. Personal and Ubiquitous Computing (Online First; 21st April 2011), 1–11. 33. Willis, K., Poupyrev, I., Hudson, S. and Mahler, M. SideBySide: ad-hoc multi-user interaction with handheld projectors. In Proc. UIST ‘11, ACM (2011), 431–440. 34. Willis, K., Poupyrev, I. and Shiratori, T. MotionBeam: a metaphor for character interaction with handheld projectors. In Proc. CHI ‘11, ACM (2011), 1031–1040. 35. Worthington, P. Shadow Monsters. Interaction Design, Royal College of Art. 2005.