Journal of Agricultural Science; Vol. 11, No. 2; 2019 ISSN 1916-9752 E-ISSN 1916-9760 Published by Canadian Center of Science and Education
Pipette Method: Errors Resulting From Aliquot Collection Depth in Soil Clay Quantification Jaedson Cláudio Anunciato Mota1, Carlos Eduardo Linhares Feitosa2, Lucas de Sousa Oliveira1, José Israel Pinheiro1, Alfredo Mendonça de Sousa1, Thiago Leite de Alencar3, Márcio Godofrêdo Rocha Lobato1, Alexandre dos Santos Queiroz1 & Ícaro Vasconcelos do Nascimento1 1
Universidade Federal do Ceará, Fortaleza, Ceará, Brazil
2
Universidade Federal do Rio Grande do Sul, Rio Grande do Sul, Brazil
3
Instituto Federal de Educação, Ciência e Tecnologia do Piauí, Piauí, Brazil
Correspondence: Lucas de Sousa Oliveira, Universidade Federal do Ceará, Fortaleza, Ceará, Brazil. E-mail:
[email protected] Received: September 19, 2018 doi:10.5539/jas.v11n2p244
Accepted: November 5, 2018
Online Published: January 15, 2019
URL: https://doi.org/10.5539/jas.v11n2p244
Abstract Granulometry represents the relative proportions of the fractions that compose the soil, being an important agronomic tool to infer mean values of density, water availability and cation exchange capacity, besides being useful in soil classification. Among the methods employed to determine the fractions composing the soil, those which consider the separation by sedimentation for the clay fraction still have problems in the analytical protocol, which are directly responsible of errors in the results obtained. Given the above, this study aimed to evaluate the best pipette immersion depth to collect the aliquot containing only clay, to calculate and discuss the errors associated with collection of the aliquot containing clay fraction in soil granulometric analysis. Samples for granulometric analysis were collected in the superficial layer and top of the B horizon of an Argissolo Amarelo, corresponding to the textural classes sandy loam and sandy clay. Regardless of soil textural class, the depth h = 5 cm established in the calculation using the Stokes’s equation leads to overestimation and underestimation of clay and silt fractions in the soil. The collection should be performed with the pipette tip positioned at h/2 = 2.5 cm. Keywords: soil physics, granulometric analysis, Stokes’s law 1. Introduction Granulometry represents the relative proportions of the fractions that compose the soil. In most cases, it is a reference to the quantities of sand, silt and clay, fractions which are not changed by soil use and management, because they result from pedogenetic processes. It has great agronomic importance because, based on it, it is possible to infer mean values of density (Sivarajan et al., 2018), water availability (Rabot et al., 2018) and cation exchange capacity, besides being useful in soil classification (Klein et al., 2013). Regarding laboratory protocols, there is a great variety of techniques in soil granulometric analysis, and approximately four hundred methods are known nowadays (Almeida, 2008). Among the most widely known methods, two deserve special attention for being the most commonly used: the pipette method (Robinson, 1922) and the hydrometer method (Bouyoucos, 1927). Soil granulometric analysis is normally carried out in three steps: application of pretreatments to remove flocculating and cementing agents, sample dispersion, and quantification of fractions (Ruiz, 2005). The first step aims to remove organic matter, iron oxides, carbonates and soluble salts (Ruiz, 2005). Soil sample dispersion is conducted by using a combination of chemical processes and mechanical disaggregation (Durner et al., 2017). Sieving is used for the sand fraction and sedimentation for the smaller particles—silt and clay (Cunha et al., 2014b). For the sand fraction, separation by sieving leads to results with better precision and accuracy; however, separation by sedimentation for silt and clay fractions still has several problems in the various methods used in the analytical protocol, which are directly responsible of errors contained in the results obtained in the measurement of these granulometric fractions (Durner et al., 2017). Incomplete dispersion of soil particles, associated with the inefficiency of the procedures used, leads to errors in the quantification of the clay fraction 244
jas.ccsenet.org
Journal of Agricultural Science
Vol. 11, No. 2; 2019
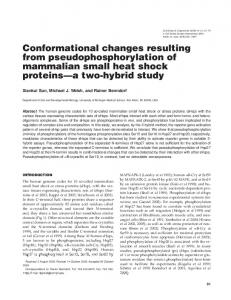
and, consequently, of silt and sand fractions (Cunha et al., 2014b). These experimental errors, depending on the magnitude, may cause serious consequences for the utilization of the soil granulometric analysis results, from the simplest applications, directly related to soil use and management, to the more complex ones, which involve the modelling of soil physical, chemical, biological and mechanical processes (Corá et al., 2009). Pipette method is also one of the main methods used to determine clay content. The method is frequently used due to the technical impossibility of manufacturing sieves with adequate diameters for the dimensions of these particles (Dias, 2004). It is worth highlighting that clay particles in the soil exhibit a laminar shape and the mesh opening in sieve manufacturing considers the equivalent diameter of spherical particles. Thus, contents of clay particles in the soil are usually determined using a method that is based on the sedimentation velocity of the particles. The principle of this method is the quantification of clay content based on the weighing of samples, collected at a certain depth in aqueous medium within a given time of sedimentation. Among its limitations, special attention should be paid to the collection depth established in the calculations using the Stokes’s law, a factor that leads to errors in the determination of clay contents by this method (Dias, 2004; Durner et al., 2017). In this context, the hypothesis tested in the present study is that the aliquot collected at the depth h established in the calculation by the Stokes’s law, leads to overestimation of soil clay fraction because sit also contains silt. Therefore, the objectives were to: i) define the best depth for pipette immersion to collect the aliquot containing only clay; and ii) calculate and discuss the errors associated with the collection of the aliquot containing the clay fraction. 2. Method and Methods 2.1 Experimental Site To perform soil granulometric analysis, samples were collected at the Federal University of Ceará, Campus of Pici, in the upper layer (0-5 cm) and from the first 5 cm of the B horizon (in both situations, in the first five centimeters) of a Argissolo Amarelo (Embrapa, 2013), corresponding sandy loam and sandy clay textures, respectively (Santos et al., 2013). All analyses were carried out at the Soil Physics Laboratory of the Soil Sciences Department in the Federal University of Ceará. 2.2 Pipette Immersion Depths for Aliquot Collection in the Quantification of Clay Fraction For each treatment 10 samples of oven-dried fine earth (ODFE) weighing 20 g were used. Each sample was put in a 250 mL beaker to which 100 mL of distilled water and 10 mL of o 1 mol L-1 sodium hydroxide, a chemical dispersant, were added. The mixture was allowed to rest for 12 to 16 hours for chemical dispersion of particles. Following that, physical dispersion was carried out in vertical shaker at 12.000 rpm for 5 min for the sandy loam material, and 10 min for the sandy clay one. Subsequently, sands were separated in a sieve with 0.053 mm mesh. The filtrate, composed of clay and silt, was collected in a 1 L sedimentation cylinder. The cylinder volume was topped up with distilled water, and the suspension was agitated for homogenization per 20 seconds (Gee & Or, 2002). According to the Stokes’s law, the 5 cm depth containing only the clay fraction in suspension was considered. After the time of sedimentation, three procedures were used to collect the 25 mL aliquot containing clay notably (i) by suction, immersing the pipette tip to 2.5 and 5 cm depths from the liquid surface, (ii) by suction, immersing the pipette tip to 2.5 and 5 cm depths from the liquid surface, and (iii) by siphoning of solution containing clay + dispersant using a drain installed on the side of the sedimentation cylinder at 5 cm from the 1 L mark. (25 mL were collected from the drained volume. An illustration of the apparatus individually used in each treatment is presented in Figure 1.
245
jas.ccsenet.org
Journal of A Agricultural Sciience
Vol. 11, No. 2; 2019
Figuree 1. Detail of thhe pipettes andd drain to colleect the aliquot ccontaining clayy The siphonning proceduree was taken ass reference beccause there is no risk of conntaining silt, ass in the protocol by suction, w when the pipettee tip is immerssed at the depthh h, used to caalculate sedimeentation time bby the Stokes’ss law. The aliquoot was transferrred to a 30 mL L beaker and ddried in the oveen at105 ºC, uuntil constant w weight to determine the weightt of the clay frraction + dispeersant. A blankk control was used to determ mine the dispeersant weight in the aliquot colllected. Equatiion 1 was usedd to determine clay percentagge: Vt Wc Wbb Clay (%) 100 E Vp WODFE
(1)
where, Vt was the total volume v (50 mL L), Vp was thee pipetted voluume (2.5 mL), Wc was the ovven-dried weig ght of clay in 2.55 mL of suspennsion (g); Wb w was the oven-dried weight ((105 ºC) of thee blank in 2.5 m mL of this solution (g); and WODFE was the weight w (g) of ooven-dried finee earth. 2.3 Statistiical Design annd Error Analyysis For each ssoil texture, thhe experiment of granulomettric analysis (m methods to collect the aliquuot containing clay) was conduucted in a com mpletely randomized design,, in 2 × 3 facttorial scheme ((two textures: sandy and cla ayey; three proceedures to colleect the aliquot containing claay + dispersantt including (i) suction with ppipette tip at 2.5 cm depth from m the aqueouus suspension surface, (ii) suction with pipette tip at 5 cm depth from the aqu ueous suspensionn surface, and (iii) siphoningg, though a drrain installed oon the side of the sedimentaation cylinder 5 cm from the 1 L mark. 2.4 Data A Analysis Analysis oof variance waas carried out ffor the collectiion methods aand the soil texxtural class as well. Mean values of clay coontent were coompared usingg Tukey tests at 5% probability. The anallyses were carrried out using g the statistical program Assisstat (Silva & A Azevedo, 2016). The relativve difference bbetween the prroposed treatm ments and the refference to quanntify the clay ffraction was caalculated usingg Equation 2: t t δr (%) reeference proposed 100 (2) t reference 3. Results and Discussion The analyssis of variancee revealed highhly significant difference (p = 0.01) betweeen the two soill textural classses as well as annd between thee aliquot collecction methods but did not shhow interactionn between soil textural classs and aliquot colllection method (Table 1).
246
jas.ccsenet.org
Journal of A Agricultural Sciience
Vol. 11, No. 2; 2019
Table 1. A Analysis of varriance for soil fractions conssidering the m methods to colleect the aliquott containing clay in two soil teextural classes Source of vvariation
DF
Soil texturees (F1) Clay collecction methods (F2) Interaction F1xF2
Clay fractionn
Silt fraction
Sand fraction
M Mean squares
F
Meean squares
F
Mean squares
F
1
8336698.24
30311.11**
1552.86
41.26**
9103449.47
30981.60**
2
7665.51
27.73**
10042.54
27.70**
41.70
1.42ns
147.833
5.03**
1821445.71
6198.9 90**
2
177.21
0.662
ns
1882.77 8000.69
4.886
21.28
**
Treatmentss
5
1667652.74
Residual
54
277.60
377.63
29.38
2% %
122%
1%
Coefficientt of Variation
6073.57
**
**
Note. DF: degrees of freedom. Accordingg to the resultss in Figures 2((a) and 2(b), thhe mean clay contents (g kgg-1) in both texxtural classes were statisticallyy higher in thee clay collectioon method withh a pipette at h = 5 cm than those obtainedd in the methods of siphoning and collectionn at h = 2.5 cm m, corroboratingg the hypothessis previously ppresented in thhe present stud dy.
Figure 2. Meean values of cclay by the meethods of collection of the aliiquot containinng clay (A = sandy looam; B = sanddy clay) Note. Meaans followed byy the same lettter do not diffeer statistically according to thhe Tukey test aat 5% probabillity. w—knowing thhe limitations of its use in n the It is impoortant to poinnt out that, coonsidering thee Stokes’s law sedimentattion of soil particles—the p depth h only ensures that at that point,, and at that time, the partticles precipitateed are the oness with equivalent diameter llarger than thaat of the particles to be deterrmined (Gee & Or, 2002). Connsidering the interest i in quanntifying the claay fraction (wiith equivalent diameter ≤ 2 µ µm), at the dep pth h, for a certaain time t deppendent on tem mperature, paarticles with eqquivalent diam meter immediaately larger th han 2 µm-silt aree assumed to settle s at the boottom. Howeveer, it has been demonstrated that the aqueoous solution sh hould not be colllected with thee pipette positioned at the deppth h = 5 cm bbecause, as shoown (Figure 1)), the silt fractiion is also colleccted along withh the clay fracttion. The explannation for the presence of cllay and silt—iinstead of onlyy clay—when the solution iss collected with the pipette tip at depth h = 5 cm comes froom a simple annalysis of the ccollection of thhe aliquot conttaining the aqu ueous solution. B Based on Figuure 3, in the coollection a mannual or autom matic pipettor iss attached to tthe opposite en nd of the pipettee tip.
247
jas.ccsenet.org
Journal of A Agricultural Sciience
Vol. 11, No. 2; 2019
Figurre 3. Detail of tthe pressures innvolved in thee aqueous soluttion collectionn o the When the analyst immerses the pipettte tip up to thee depth h = 5 cm and presses it, the interrnal pressure of pipettor + pipette set beccomes lower tthan the atmosspheric pressurre and the aqueous solution is naturally pu ushed into the pipette. It occurs that, when thhe atmosphericc pressure pushhes the liquid column h, it ccauses silt, whiich is immediateely below h, too enter the pipeette as well. Fuurther, when thhe manual or aautomatic pipeettor is immerssed at depth h, thhere is a displaacement in the fluid volume because the deevice is denserr. Since the deepth h is consid dered as the lim mit to quantifyy the clay fracction, any alteration causinng displacement in the fluidd volume lead ds to discrepanccy in the values obtained to rrepresent this ggranulometric fraction. Consequenntly, the aliquuot containing the aqueous solution will contain silt aand clay partiicles, which iss not consistent with soil clayy content. Thuus, to prevent silt from beinng counted as clay, the pipeette tip needs to t be contained within the collumn h—prefeerably in the ceenter—and nott at the depth h used to calcuulate sedimentation time by thee Stokes’s law w. Regardingg the relative difference, foor the sandy ttexture the prrotocol with ssuction at h = 2.5 cm lead ds to insignificaant underestim mation of the clay fraction,, -0.3%, wherreas the protoocol with sucction at h = 5 cm overestimaates the clay fraction f by 4.11%. In relationn to the clayeyy textural class, there were underestimatio on of -0.6% andd overestimatioon of 2.4%, resspectively, for bboth protocolss mentioned abbove. The analyssis of variancee revealed highh significant diifference in thee silt fraction for both soil teextural classes, due to the methhods of clay fraction fr collecttion, as well ass the interactioon between booth sources of vvariation (Table 1). For the sanndy loam textuure, the mean values of silt did not differ between the m methods of siphhoning and suction at h = 2.5 cm, although in i the latter thee silt values were statisticallyy similar to thoose observed iin the protocol with I this texturaal class, the siiphoning methhod statistically differed froom the metho od of suction at h = 5 cm. In w showed lower mean vvalues of silt (F Figure 4a). Thhere was no siggnificant differrence collection at h = 5 cm, which between thhe methods off collection byy siphoning annd suction at h = 2.5 cm in the soil with sandy clay texture (Figure 4bb).
248
jas.ccsenet.org
Journal of A Agricultural Sciience
Vol. 11, No. 2; 2019
Figure 4. Mean values v of silt oobtained by thee methods of ccollection of thhe aliquot contaaining clay (A = sandy looam; B = sanddy clay) Note. Meaans followed byy the same lettter do not diffeer statistically according to thhe Tukey test aat 5% probabillity. w demonstratted that the aliiquot containinng clay collectted at h = 5 cm m also containss silt, In all the ssituations, it was which is thhe reason whyy the silt fractiion was signifficantly undereestimated com mpared with thee value obtained in the siphonning protocol. Some analysis protocols suggest thatt the proportioon of silt shouuld be definedd by subtractiion from the other fractions ((clay and sandd) in relation to the originaal sample (Ruuiz, 2005). Acccording to theese authors, in n the estimationn of the sedim mentation time of the silt fraaction, a moree accurate form m to quantifyy this fraction is to consider tthe Law of Sttokes (Stokes, 1851), makinng a few assuumptions—forr instance, thaat the forms of the fractions ccomposing the soil are not onnly spherical aand that, in thee sedimentatioon for granulom metric analysiss, the sediments have a uniforrm displacemennt velocity, wiith a straight-lline trajectory, thus avoidingg turbulence du uring the process. It is worth highlighting h thaat the temperaature should alsso remain consstant during thhe analysis, bec cause sedimentattion velocity is i inversely prroportional to fluid viscosityy. Therefore, ooscillations in the temperatu ure of the enviroonment during the process leead to changees in fluid visccosity and, consequently, inn the sedimentation velocity of the particless. The authors concluded thaat some matheematical deterrminations leadd to more accurate results in tthe granulomettric analysis, aalso reducing th the silt/clay rattios, used as crriteria in soil characterization n and classificatiion. Regardingg the sand fracttion, the analyysis of variancee showed signnificant effect oof the soil texttural classes an nd of the interacction between soil textural cclasses and claay fraction colllection methoods but did noot detect signifficant difference between clay fraction collecction methods (Table 1). mental proceduure, it was nott expected to differ d Since the sand fraction was separatedd by sieving inn the experim ng to regardless of the protocool for clay fracction collection, a fact confiirmed in the annalysis of variance. Accordin Ruiz (20055), the separattion by sievingg provides morre accurate annd reliable resuults, but soil saample dispersiion is fundamenttal to maintaiin the accuraccy, which reqquires a good combination of the chemiical processess and mechanicaal disaggregation. 4. Conclussion Regardlesss of soil texturral class, the aaliquot collecteed at the depthh h = 5 cm estaablished in thee calculation by the Stokes’s equation leads to overestimattion of the claay fraction andd to underestim mation of silt ffraction in the soil. The collecction should bee carried out w with the pipette tip positionedd at h/2 = 2.5 cm. Referencees Almeida, B. G. (2008)). Métodos aalternativos dee determinaçãão de parâmeetros físicos ddo solo e uso de condiicionadores quuímicos no estudo da qualiidade do solo (Dissertação, Escola Superrior de Agronomia Luiz de Queiroz, Piiracicaba). httpps://doi.org/10.11606/T.11.20008.tde-181122008-100808 method for thee mechanical aanalysis of soills. Soil Science e, 23, Bouyoucos, G. J. (1927)). The hydromeeter as a new m 343-3352. https://doii.org/10.1097/000010694-1922705000-000022
249
jas.ccsenet.org
Journal of Agricultural Science
Vol. 11, No. 2; 2019
Corá, J. E., Fernandes, C., Beraldo, J. M. G., & Marcelo, A. V. (2009). Adição de areia para a dispersão de solos na análise granulométrica. Revista Brasileira de Ciência do Solo, 33, 255-262. https://doi.org/10.1590/S010 0-06832009000200003 Cunha, J. C., Freire, M. B. G. S., Ruiz, H. A., Fernandes, R. B. A., & Alvarez, V. H. (2014). Comparação de dispersantes químicos na análise granulométrica de solos do Estado do Pernambuco. Revista Brasileira de Engenharia Agrícola e Ambiental, 18, 783-789. https://doi.org/10.1590/1807-1929/agriambi.v18n08p783789 Dias, J. A. (2004). A análise sedimentar e o conhecimento dos sistemas marinhos (p. 90). Universidade do Algarve. Durner, W., Iden S. C., & von Unold, G. (2017). The integral suspension pressure method (ISP) for precise particle-size analysis by gravitational sedimentation. Water Resources Research, 53, 33-48. https://doi.org/ 10.1002/2016WR019830 Embrapa. (2013). Sistema Brasileiro de Classificação de Solos (3rd ed.). Brasília, Brazil. Gee, G. W., & Or, D. (2002). Particle-size analysis. In J. H. Dane, & G. C. Topp (Eds.), Methods of soil analysis (3rd ed., pp. 255-293), Physical methods (Book Series, 5). Madison: Soil Science Society of America. Klein, V. A., Madalosso, T., Reichert, J. M., Suzuki, L. E. A. S., Veiga, M., Albuquerque, J. A., & Pauletto, E. A. (2013). Metodologias de controle de qualidade de análises granulométricas do solo. Ciência Rural, 43, 850-853. https://doi.org/10.1590/S0103-84782013000500015 Rabot, E., Wiesmeier, M., Schlüter, S., & Vogel, H. J. (2018). Soil structure as an indicator of soil functions: A review. Geoderma, 314, 122-137. https://doi.org/10.1016/j.geoderma.2017.11.009 Robinson, G. W. (1922). A new method for the mechanical analysis of soils and other dispersions. The Journal of Agricultural Science, 12, 306-321. https://doi.org/10.1017/S0021859600005360 Ruiz, H. A. (2005). Incremento da exatidão da análise granulométrica do solo por meio da coleta da suspensão (silte + argila). Revista Brasileira de Ciência do Solo, 29, 297-300. https://doi.org/10.1590/S0100-0683200 5000200015 Santos, R. D., Lemos, R. C., Santos, H. G., Ker, J. C., Anjos, L. H. C., & Shimizu, S. H. (2013). Manual de descrição e coleta de solos no campo (p. 100). Viçosa, MG, Sociedade Brasileira de Ciência do Solo. Silva, F. A. S., & Azevedo, C. A. V. (2016). The Assistat Software Version 7.7 and its use in the analysis of experimental data. African Journal Agricultural Research, 11(39), 3733-3740. https://doi:105897/AJAR20 16.11522 Sivarajan, S., Maharlooei, M., Bajawa, S. G., & Nowatzki, J. (2018). Impact of soil compaction due to wheel traffic on corn and soybean growth, development and yield. Soil and Tillage, 4, 230-236. https://doi.org/ 10.1016/j.still.2017.09.001 Stokes, G. G. (1851). On the effect of the internal friction of fluids on the motion of pendulums. Transaction of the Cambridge Philosophical Society, 9, 8-106. Copyrights Copyright for this article is retained by the author(s), with first publication rights granted to the journal. This is an open-access article distributed under the terms and conditions of the Creative Commons Attribution license (http://creativecommons.org/licenses/by/4.0/).
250