Platform for simulation of automated crop production. M. Hakojärvi1, M. Hautala1, J. Ahokas1, T. Oksanen2, T. Maksimow2, A. Aspiala2, A. Visala2. 1University ...
Agronomy Research 8 (1), 797–806, 2010
Platform for simulation of automated crop production M. Hakojärvi1, M. Hautala1, J. Ahokas1, T. Oksanen2, T. Maksimow2, A. Aspiala2, A. Visala2 1 2
University of Helsinki, Department of Agricultural Sciences Helsinki University of Technology, Department of Automation and Systems Technology
Abstract. During the last few decades technology used in crop production has developed
noticeably. The work of farmers has decreased and continues decreasing by means of technology and automation. The aim of this research project was to find out requirements for methods and automated machines needed in automated crop production. Agricultural machines capable of utilizing variable rate application (VRA) technology enable considering spatial variability in agricultural fields during different field operations. Agricultural field robots are the next step in technology, capable of utilizing sensor and actuating technologies, without human driven tractors. However, agricultural field robots are still under research, and commercial products do not exist. The next generation of crop farming, in the vision of authors, is based on automatic crop farming, which incorporates stationary and moving sensors systems, robots, model based decision making, automated operation planning which are adapting to spatial variability according to the measurements as well as to weather conditions. This article presents a top-down approach of automated crop farming using simulation, trying to cover the most important pieces on a fully automatic farm and the environment is modelled. The developed simulation environment is presented as well as preliminary simulation results. The environment simulator is based on a collection of models, including models for crop and weed growth, soil water flow and generators for spatial variation and statistically varying weather.
Keywords: robots, decision making, operation planning, crop growth models, environment
simulation
INTRODUCTION Despite the remarkable developments done by today in the farming methods and the used machinery must be further developed. This will inevitably lead to increase in the amount of automation used in machines and gradually to the use of automated machines which are able to work autonomously without humans. The aim of this research project was to study problems facing during development towards automated crop production (Hakojärvi et al. 2008). Modelling and simulation were used as research methods. One of the projects aims was to develop a collection of suitable models concerning crop farming in Finland. To attain this aim the existing models were used when possible. Missing models were developed but the emphasis was on structure. The models are aimed to be as simple and transparent as possible so that they 797797
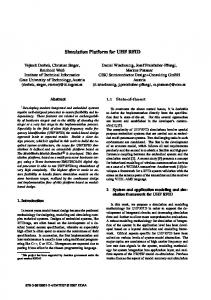
can be used as a tool for decision making e.g. in choosing machines and timing cultivation operations. Schematics of the components related to the crop growth model are presented in Fig. 1.
Figure 1. Schematics of the components related to the crop growth model. The present status of crop growth models was reviewed by Hay and Porter (2006). Also Larcher (2003) gave an overview of relevant plant ecology. Simulator structure The structure of the developed AutoCrop simulator consists of three layers. The bottom layer contains models for soils, weather, solar, crop growth, pests, and weeds. In the simulator, the fields are split into small regular pieces. The interaction of these models is modeled in the middle layer as well as operations and actions made in the field. The top layer is modeling decision making processes, operation planning and the effects on environment. Fields, field properties, roads, shadowing forests, sheds and storages form scenarios in AutoCrop simulator. The purpose is to create a tool for studying scenarios of a different kind related to weather, machine size and timing of different treatments, for instance. Fields, roads, forests and locations of sheds and storages are laid by user, and field spatial properties are generated automatically based on expectation values and variances for each soil property. Landscape height is generated in the same way. In the simulator, both the spatial space and time space are discretised, and they are parameters. The default values are 5 x 5 meters (cell size in a grid) in spatial space and in the horizontal direction. In time space the step is 1 hour. A denser grid would give more accurate results but on the other hand it takes more time to compute, and the selected default values are considered a good compromise with current computer processors. The cell size in the grid also determines the smallest area of a field which can be treated separately, which is to be considered in decision making.
798798
As in simulator both spatial and time space are simulated and models apply to both, a hybrid approach simulator is required. This means that time-dependent effects are modeled separately from spatial effects and in simulator computing they are handled one at a time. In other words, in every step in the simulator, in the first phase all the cells (field) are computed separately one time step further and in the second phase is to compute interaction between cells. These two phases are alternately repeated. In the other simulators, the weather is either generated or measured weather station data is directly applied in the simulator. For AutoCrop simulator generated weather was selected due to requirements for different scenarios, requiring for example dry and moist seasons. Hourly simulated variables are temperature, rainfall, humidity and solar radiation. Temperature, rainfall and humidity are generated using statistical data from the weather station in Helsinki during 1971–2000, utilizing monthly expectation values and variance, and daily trend. The solar radiation is computed using an available solar simulator (ArcGIS Solar Analyst), which includes the computing of shadows from landscape, forests and buildings. In shadow areas, the decrease in solar radiation was considered but the effects of temperature, humidity and rainfall were not taken into account. The time range in the simulator was selected to be one cultivating season, and in Finland, this was set to start from the beginning of April and last to the end of October. In the beginning, the fields are very humid and weather is cold, and when the simulator is started the temperature rises and fields start to dry, and decision making starts to analyze when the field is ready for seeding. Plant growth and water transport models The present status of crop growth models was reviewed by Hay and Porter (2006). Also Larcher (2003) gave an overview of relevant plant ecology. The number of parameters typically used in models is huge and their influence difficult to sort out. In the STICKS-model, for example, there are 132 parameters and tens of thousands of simulations were performed in the sensitivity analysis (Ruget et al. 2002). This kind of approach is certainly beneficial when studying the plant growth in well-known growth conditions, like growth chambers. However in field conditions there is a lot of variation in growth conditions because of variations in e.g. altitude, soil type, soil structure and radiation. Therefore the actual growth conditions of a crop are not accurately known, which is the reason why we have chosen a different strategy. Plant growth and water transport models with varying detail were developed depending to reduce the number of parameters without loosing the main effects on crop growth. Reducing the number of parameters clarifies the structure of the models which makes the model more transparent for the user. Another benefit is the reduction of necessary measured information from the fields when utilizing the model on an actual farm. The overview of one version of the plant growth models is presented in Fig. 2. The model contains fixed parameters and the magnitude of each may be altered by a multiplication factor in order to find out its influence on the plant growth. The model and its parameters are: mass of seed, biomass partitioning between shoot and root, sowing density and specific leaf area. In its most primitive form the model is fully analytical (Hautala and Hakojärvi 2010). 799799
The normal values of parameters were: Mass of the seed was 45 mg and root to shoot ratio 0.3. Specific leaf area was 20 m2/kg. The sowing density was 500 seeds/m2, i.e. the ratio of assimilative leaf area to ground area for plant (later LAI) in the beginning was 0.021 m2/m2. Biomass growth comes from the experimental facts that C3-plants produce 1.4 g CH2O per MJ solar energy when total solar radiation is above 100 W per m2 of leaf area when water and nutrients are not lacking (Monteith 1977). Radiation was considered effective 14 hours/day in each simulation. Root growth was 1 cm/day in depth and the maximum root depth was limited to 1.0 m. This determines the available water for plant in soil. At the beginning of simulations, the seeds were expected to be germinated and the initial root length was set to be 5 cm downwards from the depth of sown seed.
Figure 2. A flowchart of the calculations in the plant growth model. The model for the soil water movements used here includes 10 layers (Fig. 3). At first the water flow from one layer to another was calculated according to Darcy’s law. The benefits of this approach are the changes of soil affecting the water flow in soil as a function of soil moisture content, which makes the soil moisture changes realistic. However, in larger areas the calculation of this procedure takes considerable amount of time. To reduce the time used in soil water calculations, the water movement in soil was allowed only when the water content exceeds FC. The magnitude of water flow is limited by saturated hydraulic conductivity (K), which limits the water flow between layers. Further the water content of a layer is limited by soil wet capacity (SWC), which can not be exceeded even if FC and K would allow the water flow to a layer. Also water flow away from the soil profile may always be limited by the subsurface drain, 0.00864 mm/day, which is the recommended sizing value in Finland. Water evaporation from a bare soil surface layer is 5 mm/d, when the water content of the first layer is at SWC and as the first layer of soil dries out or the leaf area of the crop
800 800
grows, the evaporation is decreased. Further details of the water transport models and related phenomena are given in Hautala & Hakojärvi (2008) and Hautala & Hakojärvi (2009).
Figure 3. Effect of evaporation, transpiration, rain and drainage to water content θi of each layer in soil and water percolation downwards in soil. Initially, the water content in all layers is at field capacity (FC). The crop is able to use the water in soil from FC to permanent wilting point (PWP), because the amount of water above FC is able to flow rapidly in the soil which makes the water unavailable for the crop. An experimental (and physical) fact is that about 500 moles of water becomes transpirated when 1 mole of CO2 is used in photosynthesis (Taiz & Zeiger 1991). This water is taken from the root volume if available, otherwise the crop growth is decreased. Growth of the crop is ceased if growth conditions are not suitable, i.e. the water content of soil in the area restricted by the crop roots is less than PWP or more than SWC. Also a pond above the soil surface leads to the suspension of growth until the water has run off, infiltrated into the soil or evaporated. The rain model In a recent study, the statistics of 50 year summer precipitation in one location in Finland was given (Kilpeläinen et al. 2008). The cumulative distributions of rain event duration, dry spell duration and precipitation in a rain event were given as a sum of two exponentials. The yearly rain is obtained by a Monte-Carlo method. If F(x) represents one of these distributions, then a random number 0