PMOSFET Layout Dependency with Embedded SiGe Source/Drain at POLY and STI Edge in 32/28nm CMOS Technology
L. Song, Y. Liang, H. Onoda1, C. W. Lai2, T. A. Wallner, A. Pofelski3, C. Gruensfelder2, E. Josse3, T. Okawa1, J. Brown5, R.Q. Williams5,J. Holt, J.W. Weijtmans2, B. Greene, H. K.Utomo, S. C. Lee5, D. Nair, Q. Zhang, C. Zhu, X. Wu2, M. Sherony, Y. M. Lee2, W. K. Henson, R. Divakaruni and E. Kaste IBM Semionductor Research and Development Center (SRDC), Hopewell Junction, NY, 12533, 1Toshiba America Electronic Components Inc, 2 GLOBALFOUNDRIES, 3STMicroelectronics, 4IBM System and Technology Group, Burlington, 5Samsung Electronics Components Inc. E-mail:
[email protected]
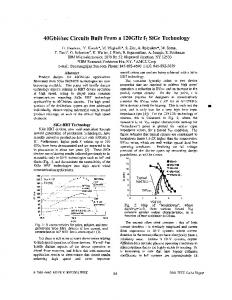
Introduction As CMOS technology continues scaling down, especially to the nano-device regime, different stress elements, such as dual stress liner (DSL) and eSiGe, have been introduced to the standard process flow as the must-have performance boosters[1-2]. Recently, distinct layout effects have been reported for eSiGe technology, such as gatepitch, STI interaction and Source/Drain (S/D) length effects [3-5]. The layout effects could be dramatically degraded when aggressive pitch scaling happens. For example, as shown in Fig.1, the drive current loss due to PFET active area scaling in 45/65nm node is less than 5%. However, this number could easily exceed 15% in 32/28nm as technology scales. In the following discussions, we will present the device impacts from eSiGe layout with PC-bounded and STIbounded eSiGe growth for both Box-profile and Sigma-profile in 32/28nm technology node. Experiments The pFETs discussed in this paper were fabricated with gate first high-k metal gate (HK/MG) process [6-7]. After the HK/MG module, the pFET active regions were recessed and selectively epitaxial grown Box or Sigma shaped embedded SiGe. Standard Halo/Ext and S/D implantation are followed by the DSL process. The devices studied within this paper feature 30nm designed channel length. The DSL interface was far away in the devices under test. The test structure layout and cross-section cartoons are shown in Fig. 2. SA or SB used in the later charts refers to the distance from the active Poly edge to Si-substrate edge on source or drain sides separately. In this paper, only symmetrical S/D devices are discussed. When SA/SB is less than the distance to very first neighbor Poly (PC), the eSiGe growth becomes STI-bounded, thus it is identified as a STI-bounded device. Once SA/SB extends beyond the first neighbor PC, no matter how many PC it will pass, the S/D for an active gate becomes PC-bounded. We then obtain a PC-bounded device. For STI-bounded devices, eSiGe growth against the STI edge affected the morphology and volume of the eSiGe S/D active region [8, 10]. Fig. 3 illustrates that how having an eSiGe process can boost up the pFET performance by 22%. With adopting better eSiGe process and introducing closer eSiGe proximity, we can even further improve the pFET performance. Results and discussion A. Box eSiGe vs. Sigma eSiGe Fig. 4 shows pFET threshold voltage (Vt) continues increasing with shrinking SA/SB for a box eSiGe scheme. This monotonic Vt increase is as much as 20mV higher compared to devices without eSiGe. The right chart shows the extracted Ieff loss at fixed Isoff. Along with the Vt increase, the pFET’s performance is clearly degraded. Fig. 5 shows 12% pFET performance degradation of the PC-bounded vs STI-bounded cases in Box eSiGe process. Fig. 6 shows the measurement of under-chanel Si Lattice deformation profile by dark field holography (DFH) [9]. Compared to the PCbounded device, the STI-bounded box eSiGe device shows relaxation of the eSiGe stress. The stress degradation could be due to two reasons: 1) reduction of eSiGe volume due to faceted eSiGe morphology at STI edge; 2) STI proximity effect [10]. The mobility reduction due to the above reasons was confirmed from Iodlin data, as shown in Fig. 7. Small SA/SB device suffers from 6~11% Iodlin loss. In the Sigma eSiGe scheme, Vt increases for PC-bounded conditions, while performance was degraded as shrinking SA/SB when eSiGe growth is PC-bounded. This trend is consistent with the
978-1-4577-2084-0/12/$26.00 ©2012 IEEE
Box eSiGe result (Fig. 8). However, a large Vt drop happens when the device becomes STI-bounded, and smaller drive current loss was observed. TEM and DFH investigation indicated that epi-fill morphology varies significantly when eSiGe growth is STI-bounded. This fill-height directly impacts the overlap capacitance in later halo/ext process, therefore reduced device performance offset and degradation in other device parameters. B. Width Dependence Width dependence of eSiGe layout effect is observed in both Box eSiGe and Sigma eSiGe growth (Fig. 9). In Box eSiGe, except for narrow width device, both medium and wide width PFET show similar increasing Vt trend. In Sigma eSiGe, narrow width device shows similar trend as Box eSiGe, while both medium and wide device show significant Vt drop when device has STI-bounded S/D. PFET width effect is influenced by multiple process factors, including eSiGe growth morphology related with epi growth rate, process parameters, STI sidewall angle and STI divot. STI stress effect also has a non-negligible effect. C. Fill-Height Dependency The experiments of eSiGe fill-height further confirm our observation, by which the layout effect and device performance are impacted significantly. The Vt shift from PC-bounded to STIbounded was confirmed in three different STI environments. Over-fill eSiGe scheme shows the largest Vt shift. And PC-bounded devices are more sensitive over the fill-height than STI-bounded ones. The epi-fill height sensitivity over different layout is clearly the main reason for such device performance shift and variation. D. Variation Study The eSiGe layout effect can also increase the device variability dramatically. Fig. 10 compares the Vt variation between PC-bounded and STI-bounded eSiGe growth for three different STI environments. In each layout, the STI-bounded process consistently shows higher Vt variation than the PC-bounded process. Fig. 11 shows the significant increase of Ieff variation when shrinking SA/SB till STI bounded condition. Compared with the non-eSiGe condition, Ieff variation constantly increases by 20-30% due to STI-bounded eSiGe growth. D. Layout Optimization Extending Si-substrate edge to ensure PC-bounded eSiGe growth significantly reduces device variation as shown in Fig. 12. However, at the cost of density, such density loss is estimated to be as much as 5~15% in 28nm, depending on the specific designs. As scaling continues, tradeoff between device variation reduction and density scaling needs to be carefully evaluated, and innovations in both design optimization and process improvement are crucial. Conclusions The eSiGe layout effect induced by PC-bounded or STI-bounded eSiGe shows impact on device performance and variability increase. For PC-bounded device, performance degradation could be explained by the mobility loss due to reducing eSiGe volume and less stress strength. For STI-bounded device, performance degradation varies, due to strong interaction between eSiGe fill morphology and device overlap capacitance. This observation was confirmed by an eSiGe fill level study. Compared to PC-bounded eSiGe, STI-bounded devices have increase variation due to eSiGe process. Acknowledgement This work had been supported by the Bulk CMOS and SOI technology development projects at the IBM Microelectronics, Div. Semiconductor Research and Development Center, Hopewell Junction, NY 12533.
10
(a)
Drive Current Loss in 45/65nm Nodes Drive Current Loss (%)
References: [1]T. Ghani et al., IEDM Tech. Dig., 2003 [2]P.R. Chidambaram et al., Symp. VLSI Tech., 2004 [3]H Aikawa, et all., Symp. VLSI Tech, 2008 [4]K. Ota, etc all., Symp. VLSI Tech., 2006 [5]C Cheng, et all., IEEE TED, 2009 [6]F. Arnaud et al, IEDM Tech. Dig., 2008 [7]J. Yuan et al, ICSICT, 2010 [8] G. Eneman, et all., Sybm, VLSI Tech., 2005 [9] M Hytch et al, Nature 453, 2008 [10] Y. S. Choi, et all., IEEE TED, 2010
1x Pitch STI Bounded
5
(b)
1x Pitch PC Bounded PC
0 (c)
2x Pitch STI Bounded
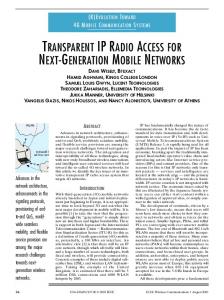
Figure 2 (Left): Examples of eSiGe Layout; SA/SB refers to the distance from active Poly (PC) edge to substrate edge on Source/Drain Side, indicated by the blue arrows in the picture. (Right): crosssection cartoons corresponding to the left layout.
Smaller Active Area (Pitch scaling)
0.05
0.03 0.02 0.01 0.00
0.1 0.5
1.0
1.5
Min_SASB STI Bounded Ref_SASB PC Bounded
eSiGe Macro no eSiGe Macro
20
PFET_Isoff (A.U)
1
Δ Ieff @ fixed Isoff (%)
25 eSiGe Macro no eSiGe Macro
0.04 Delta Vtsat (V)
PFET_Isoff (A.U)
PFET w. Box eSiGe Process PFET w/o eSiGe
SA
-5
Figure 1: In 45/65nm technology nodes, the drive current loss due to PFET active area scaling could be observed, but less than 5%. 10
S
RX SB Sub S
15 10 5
1
0
-0.01 SA/SB Size
PFET_Ieff (A.U)
1.0
SA/SB Size
15
Iodlin Loss (%)
Sigma eSiGe Process PC-bounded Device
PFET_Isoff (A.U)
Small SA/SB (PC-bounded)
10
Figure 5: PMOS has clear performance degradation from PC-bounded eSiGe layout to STI-bounded eSiGe layout.
Iodlin measured @ Vdd=50mV Vg=Vth+Vod
Small SA/SB (STI-bounded)
Mid-size SA/SB (PC-bounded)
5
1.5
PFET_Ieff (A.U)
Figure 4: In Box eSiGe process, monotonic threshold voltage increase could be observed with reduced SA/SB size. And compared to w/o eSiGe device, Vt shift could be about 20mV larger. (Left) Clear performance degradation from large SA/SB to small SA/SB. Larger degradation was observed in device with eSiGe. (Right)
Figure 3: PMOS performance could be largely improved (22%) by using eSiGe process; further improvement could be seen by optimizing eSiGe process.
1 Small SA/SB
0.1 Large SA/SB
0
1.5%
no eSiGe
Box eSiGe
Sigma eSiGe
0.01 0.5
-5
1.0
1.5
2.0
PFET_Ieff (A.U)
Figure 8: In Sigma eSiGe process, for PC-bounded device, device performance degraded as shrinking SA/SB, consistent with Box eSiGe
Figure 7: Iodlin was extracted @ fixed Vtlin. Compared to large SA/SB device, clear mobility degradation was observed in small SA/SB device. This is consistent with holography result in Fig. 6. Figure 6: Under-chanel stress profile of dark field Holography in STIbounded box eSige device (Left) and PC-bounded box eSige device (Right) Figure 10: Larger Vt variation in STI-bounded device than PC-bounded.
0.05
0.04
Delta Vtsat (V)
0.03 0.02 0.01 0.00 -0.01
0.04 0.03 Delta Vtsat (V)
Chanel Width Wide Medium Narrow
Device Width Wide Medium Narrow
0.02
Δ Ieff% Sensitivity
0.05
0.01 0.00 -0.01 -0.02
-0.02 -0.03
-0.03 SA/SB Size
SA/SB Size
Figure 9: Width dependence of eSiGe layout effect was observed in both Box eSiGe (Left) and Sigma eSiGe (Right) growth. In Sigma eSiGe, W=0.08um device shows similar trend as Box eSiGe. But both W=1um and W=0.3um device show large Vt drop when becoming STI-bounded.
30 25 20 15 10 5 Ref 0 -5 -10 -15 -20 -25
Higher Fill Lower Fill
PC-Bounded STI-Bounded
20.00% 15.00% 10.00% 5.00% 0.00% STI Layout 1
STI Layout 2
STI Layout 3
0.15
Compared to Ref. Fill Height
PC-Bounded
Vt Variation (Std)
The stress in the channel is degraded, thus the mobility of the PFET.
Vt Variation (%)
25.00%
Non- Optimized Layout 0.1
Optimized Layout
0.05
STI-Bounded
Figure 11: Performance delta between PC-Bounded and STIBounded conditions strongly depends on the eSiGe fill-height.
0 1
2
3
4
5
6
7
8
Figure 12: With layout optimization, less variation and a better Vt control could be achieved.