Systematic Biology Advance Access published February 8, 2011
Point of View
c The Author(s) 2011. Published by Oxford University Press, on behalf of the Society of Systematic Biologists. All rights reserved.
For Permissions, please email:
[email protected] DOI:10.1093/sysbio/syq100
K IN -L AN H AN1,2,3,∗ , E DWARD L. B RAUN1 , R EBECCA T. K IMBALL 1 , S USHMA R EDDY4,5 , R AURI C. K. B OWIE6,7 , M ICHAEL J. B RAUN2,3 , J ENA L. C HOJNOWSKI 1 , S HANNON J. H ACKETT 5 , J OHN H ARSHMAN 5,8 , C HRISTOPHER J. H UDDLESTON 2 , B EN D. M ARKS9 , K ATHLEEN J. M IGLIA 10 , W ILLIAM S. M OORE10 , F REDERICK H. S HELDON 9 , D AVID W. S TEADMAN 11 , C HRISTOPHER C. W ITT12,13 , AND TAMAKI Y URI1,2,14 1 Department
of Biology, University of Florida, Gainesville, FL 32611, USA; of Vertebrate Zoology, Smithsonian Institution, Suitland, MD 20746, USA; 3 Behavior, Ecology, Evolution, and Systematics Program, University of Maryland, College Park, MD 20742, USA; 4 Department of Biology, Loyola University Chicago, Chicago, IL 60626, USA; 5 Zoology Department, Field Museum of Natural History, Chicago, IL 60605, USA; 6 Museum of Vertebrate Zoology and 7 Department of Integrative Biology, University of California Berkeley, Berkeley, CA 94720, USA; 8 4869 Pepperwood Way, San Jose, CA 95124, USA; 9 Museum of Natural Science, Louisiana State University, Baton Rouge, LA 70803, USA; 10 Department of Biological Sciences, Wayne State University, Detroit, MI 48202, USA; 11 Florida Museum of Natural History, University of Florida, Gainesville, FL 32611, USA; 12 Department of Biology and 13 Museum of Southwestern Biology, University of New Mexico, Albuquerque, NM 87131, USA; and 14 Sam Noble Oklahoma Museum of Natural History, University of Oklahoma, Norman, OK 73072, USA; ∗ Correspondence to be sent to: Department of Biology, University of Florida, PO Box 118525, Gainesville, FL 32611, USA; E-mail:
[email protected]. 2 Department
Received 14 December 2009; reviews returned 1 April 2010; accepted 3 November 2010 Associate Editor: Frank Anderson
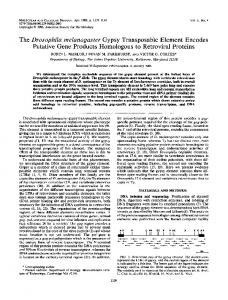
distinguished and are unlikely to be interpreted as homologous (Rokas and Holland 2000; Shedlock and Okada 2000; Ray et al. 2006). For example, TEs can insert into almost any position in the genome in two different orientations. Additionally, the existence of multiple TE types and subtypes (Jurka 1998; Wicker et al. 2005, 2007) makes it possible to identify independent insertion of different types based upon their sequence. Finally, most insertions include only part of the complete TE sequence, so independent insertions may be different segments of the original even if they are of the same subtype and in the same orientation. Despite the reasons to expect RGCs to be perfect homoplasy-free characters, many different RGCs can exhibit homoplasy (Ray et al. 2006; Gibb et al. 2007). Although even very rare events like protein domain fusion/fissions can be reversed (Braun and Grotewold 2001; Braun 2003), the most commonly invoked explanation for RGCs that appear homoplastic are differences between individual gene trees associated with specific RGCs and the species tree (Fig. 1a) (Hillis 1999; Shedlock and Okada 2000; Shedlock et al. 2004; Ray et al. 2006; Sasaki et al. 2006; Nishihara et al. 2009; but see Murphy et al. 2007, for a possible exception). In fact, the only available statistical method for RGC analyses (Waddell
[Rare genomic changes] provide an independent source of phylogenetic information largely immune from some of the problems that affect primary sequence data.—Rokas and Holland (2000) In an attempt to find the true evolutionary tree of life, phylogeneticists have searched for “perfect” characters—those free of homoplasy. Rare genomic changes (RGCs) are infrequent mutations such as transposable element (TE) insertions, intron gains or losses, gene order changes, inversions, gene duplications, and even fusion/fissions of protein domains (Rokas and Holland 2000). RGCs are candidates for perfect characters, as they are believed to exhibit little or no homoplasy for two reasons. First, they typically accumulate slowly, with some types of RGCs accumulating so slowly that they are useful for defining the deepest branches in the tree of life (Keeling and Doolittle 1997; Stechmann and Cavalier-Smith 2002). Other RGC types, however, such as TE insertions, accumulate rapidly enough to be useful for defining more closely related groups (e.g., Watanabe et al. 2006; Kaiser et al. 2007). Second, regardless of their rate of accumulation, RGCs are thought to have a large state space (Steel and Penny 2000), which means that independent RGCs can be 1
Downloaded from sysbio.oxfordjournals.org at UNM Health Sciences Library and Informatics Center on February 11, 2011
Are Transposable Element Insertions Homoplasy Free?: An Examination Using the Avian Tree of Life
2
SYSTEMATIC BIOLOGY
et al. 2001) assumes that conflicts among RGCs reflect lineage sorting, thus it uses a coalescent model (Hudson 1992) to predict the distribution of character states. Consequently, this model assumes RGCs that appear to conflict with the species tree can be explained by hemiplasy, a situation where lineage sorting gives rise to the illusion of homoplasy with respect to the species tree (Avise and Robinson 2008). Hemiplasy is expected to be more likely to occur on short internodes in the species
tree, whereas bona fide homoplasy is most likely to occur on long internodes because the probability that a specific gene tree conflicts with a species tree is typically related to the length of the relevant internal branches (e.g., Pamilo and Nei 1988; Degnan and Rosenberg 2009). Because coalescent models only account for conflict due to hemiplasy, the models proposed for analyses of RGC data will have to be expanded if RGCs also exhibit homoplasy. Insertions of TEs, specifically retrotransposons, are the RGCs most commonly used in vertebrate phylogenetics (Shedlock and Okada 2000; Kriegs et al. 2006; Nishihara et al. 2006a; Ray et al. 2006; Kaiser et al. 2007; Kriegs et al. 2007; Treplin and Tiedemann 2007). The presumption that RGCs do not exhibit homoplasy has even prompted conclusions based on single-TE insertions. However, some inferences supported by individual TEs, such as the phylogenetic position of the enigmatic rockfowl, Picathartes spp. (Treplin and Tiedemann 2007), and the phylogenetic position of the Japanese quail, Coturnix japonica (Kaiser et al. 2007; Kriegs et al. 2007), conflict with large-scale nucleotide and total evidence phylogenies (Barker et al. 2004; Crowe et al. 2006; Cox et al. 2007; Hackett et al. 2008; Kimball and Braun 2008). Even phylogenetic hypotheses based upon more than one TE insertion (e.g., Kriegs et al. 2006) can show conflict with large-scale studies of nucleotides or other RGCs (e.g., Kriegs et al. 2006 compared with Murphy et al. 2007; Wildman et al. 2007; Prasad et al. 2008). Several patterns of TE distribution are possible (Fig. 1). Although conflicts with the species tree are one potential pattern (Fig. 1a), other potential patterns of TE distribution can also lead to conflict (e.g., Fig. 1b,c). It is unclear how much of the conflict observed in published studies can be explained by conflicts among gene trees (hemiplasy) rather than homoplasy. The argument that TE insertions exhibit little or no homoplasy is ultimately based upon assumptions about their biology. TEs are divided into two major classes that exhibit fundamental mechanistic differences: retrotransposons (Class I elements) use a “copy-and-paste” mechanism with an RNA intermediate, whereas DNA transposons (Class II elements) typically use a “cut-andpaste” mechanism with a DNA intermediate (Finnegan 1989; Wicker et al. 2007). Retrotransposons are generally more common than DNA transposons in eukaryotes and they are less likely to undergo precise (or nearly precise) excision (Labrador and Corces 1997; Wicker et al. 2007). Most TEs used in vertebrate phylogenetics such as L1 elements (e.g., Nishihara et al. 2006a, 2009) and chicken repeat 1 (CR1) elements (e.g., Kaiser et al. 2007; Kriegs et al. 2007), are retrotransposons that share an insertion mechanism called target-primed reverse transcription (Luan et al. 1993; Ichiyanagi and Okada 2008). Briefly, an endonuclease nicks the target DNA to generate a DNA strand with a free 30 -hydroxyl that is able to act as a primer for reverse transcription of the retrotransposon RNA. This mechanism has the potential to result in a bias toward specific insertion sites depending on the degree of endonuclease specificity,
Downloaded from sysbio.oxfordjournals.org at UNM Health Sciences Library and Informatics Center on February 11, 2011
FIGURE 1. Potential complex TE insertion patterns. Solid bars indicate homoplasy-free insertions (those exhibiting a retention index of 1.0). Open bars represent the insertions that were subsequently deleted (with the deletion represented by a X over an open bar). Diamonds represent independent insertions in distinct lineages. a) A TE insertion associated with a gene tree (right) that is inconsistent with the species tree (left) will appear homoplastic due to lineage sorting. This situation was recently designated “hemiplasy” to distinguish it from true homoplasy due to multiple origins of a genomic feature (Avise and Robinson 2008). b) Multiple insertions at the same site in divergent taxa, shown is a case where there is an insertion at identical sites in two different taxa, but the strong phylogenetic support for placing these taxa in different clades suggests that these insertions are independent. c) Insertion and subsequent complete deletion of the TE in some taxa; shown is a case where an insertion appears in all but one taxon within a clade suggesting excision of the entire insertion from this taxon. d) Multiple insertions at the same site in some but not all taxa, shown here by a single insertion in the ancestor to Species 1–4, with a second insertion at the same site in Species 1. The insertions in Species 1 can be of the same type or of different types. Unlike the other scenarios shown here, this pattern of insertions does not have the potential to be misleading, although it does suggest the existence of hot spots for TE insertions and/or fixations. Duplications and other types of sequence changes (e.g., inversions) also have the potential to create complex insertion patterns similar to the examples presented here, so their interpretation can be difficult.
VOL. 60
2011
POINT OF VIEW
M ATERIALS AND M ETHODS Sequencing and Alignment Because most TEs in coding regions are selected against, we focused on screening noncoding DNA. We screened the data available from recent studies that examined avian phylogeny using noncoding sequences (Chojnowski et al. 2008; Hackett et al. 2008; Harshman et al. 2008). One locus, HMGN2, was poorly sampled in the previous studies, so we collected additional data from some of the same taxa used in those studies (deposited in GenBank with accession numbers HM439436HM439451). Introns, coding exons, and untranslated regions (UTRs; noncoding exon regions) were identified using the annotation of the chicken genome (International Chicken Genome Sequencing Consortium 2004)
and other vertebrate genomes (Hubbard et al. 2007). Sequences were aligned as described in previous publications (Chojnowski et al. 2008; Hackett et al. 2008; Harshman et al. 2008). TE Identification We used individual introns or UTRs as queries to search for homology to TEs from all organisms in Repbase (Jurka et al. 2005) using the CENSOR software tool (Kohany et al. 2006). To allow careful comparison of TE insertion boundaries, TE insertion positions identified using CENSOR were mapped onto the multiple sequence alignments using a C++ program written by E.L.B. In some cases, we modified alignments to better match the novel information about TE boundaries. Upon further examination of the alignments, some insertions were found in additional taxa not identified by CENSOR, though in all these cases, these taxa had short sequences (40 bp in length in the original alignments were identified and examined to determine whether any could be identified as TEs. The cut off of 40 bp was used because all TE insertions identified by CENSOR were longer than 40 bp, suggesting that it is difficult to reliably identify TEs shorter than these sequences. All insertions that were not identified as TEs in the initial CENSOR or RepeatMasker searches were rerun through CENSOR using just the inserted region rather than the entire intron. Length differences between paleognaths and neognaths cannot be classified as insertions or deletions because the basal split in birds is between paleognaths and neognaths (e.g., Groth and Barrowclough 1999; Harshman et al. 2008) so they were excluded from consideration (none of these length differences appeared to be due to TEs). Examining Homoplasy and Gene-Tree Topologies Each TE insertion, including those that appeared to be homologous but were too short (e.g., those that were 40 bp) insertions in the alignments, 73% were identified as TEs. Not only were most insertions attributable to TEs but also the TE insertions were
larger on average (∼300 bp) than other large insertions (∼125 bp). This suggests that TE insertions explain much of the large-scale size variation in the intron data sets (Chojnowski et al. 2008; Hackett et al. 2008; Harshman et al. 2008). TE insertions were more common in some loci than in others, even after correcting for the amount of noncoding DNA sequenced (Table 1). In fact, we could reject the equal-rate Poisson model in favor of the NB model using the likelihood ratio test (2δ = 16.55, P < 0.0001, df = 1), indicating that the rate of TE insertion/fixation varied across loci. The 2 loci with the largest number of TE insertions were EEF2 (17 TEs; with ∼1140 bp of intronic sequence per species) and GH1 (9 TEs with ∼740 bp of intronic sequence per species). Some clades experienced more TE insertions than others (Fig. 2). For example, a superordinal clade comprising the paraphyletic Coraciiformes (kingfishers, rollers, bee-eaters, hoopoes, and hornbills) and the Piciformes (woodpeckers, barbets, jacamars, and puffbirds) had 19 TE insertions, almost 30% of the TE insertions identified. Most (11) of these 19 insertions were specific to the Piciformes. Other clades with numerous insertions include the Cuculiformes (cuckoos and anis) with 9, four of which were unique to the Yellow-billed cuckoo (Coccyzus americanus), and the Charadriiformes (shorebirds and their allies) with 6 insertion events in the Lari (gulls) and Scolopaci (sandpipers) (Fig. 2). In other orders, such as Anseriformes (ducks and geese), we found no TE insertions. Although the number of ERVs was quite small, the distribution was also skewed, with two (of three) ERV insertions found in a single order, the Galliformes (chickens, turkeys, pheasants, and their allies). CR1 elements, like other types of TEs (e.g., Boissinot et al. 2000), are divided into subtypes that can be distinguished based upon their sequence (Vandergon and Reitman 1994). There is typically a small number of complete and actively transcribed retrotransposons in genomes. These intact TEs, often referred to as “master genes,” give rise to many copies inserted throughout the genome and the subtype of all insertions will correspond to the subtype of the master gene. Because the master gene for a specific subtype can remain active for a relatively long time period, one or two subtypes may dominate in a clade (Kriegs et al. 2007). Consistent with this, we found that clades with large numbers of TE insertions generally had multiple insertions of a single subtype. For example, the most common CR1 subtype in the Coraciiformes and Piciformes clade and the Cuculiformes was F2, whereas the most common subtype in Charadriiformes was Y4. Subtype identification, however, was problematic in some cases. For example, what appeared to be a homologous insertion was identified as a different CR1 subtype in closely related species (e.g., in EEF2 intron 8, a TE insertion shared by all 22 passerines sampled was identified as five different subtypes). Furthermore, in some cases, RepeatMasker identified different subtypes than CENSOR for the same insertion (not shown). Given this, three important factors should be considered before
Downloaded from sysbio.oxfordjournals.org at UNM Health Sciences Library and Informatics Center on February 11, 2011
ALDOB Intron 3 Intron 4 Intron 5 Intron 6 Intron 7 CLTC Intron 6 Intron 7 CLTCL1 Intron 7 CRYAA Intron 1 EEF2 Intron 5 Intron 6 Intron 7 Intron 8 FGB Intron 4 Intron 5 Intron 6 Intron 7 GH1 Intron 2 Intron 3 HMGN2 Intron 2 Intron 3 Intron 4 Intron 5 IRF2 Intron 2 MB Intron 2 MUSK Intron 3 MYC Intron 2 PCBD1 Intron 2 Intron 3 RHO Intron 1 Intron 2 Intron 3 TGFB2 Intron 5 TPM1 Intron 6
Chr.a
5
6
VOL. 60
SYSTEMATIC BIOLOGY TABLE 2. TE types and insertion patterns
Type CR1 ERV SINE Polinton
Number of autapomorphic insertions
TE insertion Pattern 1ba (Fig. 1b)
TE insertion Pattern 1c (Fig. 1)
60 3 2 1
34 2 2 0
4 (2 unique sites) 0 0 0
2 0 0 0
TE insertion Pattern 1da (Fig. 1) 7 (4 taxa) 0 1 (with a CR1) 0
2 independent insertions are hypothesized to occur at the same site (e.g., Fig. 1b,d), we counted each independently.
using subtype identification: 1) the length of the insertion, because short insertions will have retained less information about subtypes than longer insertions; 2) the age of the insertion, because older insertions have undergone more mutation and may be harder to identify; and 3) the database used to identify subtypes. Most TE insertions could be mapped onto the Hackett et al. (2008) tree (and even very divergent phylogenies such as those in Sibley and Ahlquist 1990 and Livezey and Zusi 2007) without homoplasy (Fig. 2). Indeed, the majority of TE insertions (38 insertions) were autapomorphic given our taxon sample (Table 2). The synapomorphic insertions occurred on relatively long branches on the phylogeny (see Fig. 3 in Hackett et al. 2008) and generally defined clades that were already well supported by analyses of nucleotide substitutions (Hackett et al. 2008), and thus provided no new phylogenetic information. Most of these united families or more derived groupings (Fig. 2), with only 11 insertions uniting orders or deeper-level clades. Ten of these 11 insertions united well accepted, monophyletic orders (Passeriformes [perching birds], Psittaciformes [parrots], Piciformes, Trogoniformes [trogons], Cuculiformes, and Columbiformes [doves]; some of these orders were united by two insertions). The remaining deeper-level insertion united Coraciiformes and Piciformes, which is a well-supported superordinal group in Hackett et al. (2008). After careful examination of all the alignments, we identified a small number of sites that exhibited more complex patterns of TE insertion (Fig. 1; Table 2). We split these into two categories. The first category appeared to reflect insertion “hot spots” in the genome, whereas the second category appeared to reflect homoplasy in that the TEs were within a single clade, but the insertion did not map onto well-supported nodes without homoplasy (Fig. 1c). TEs in the hotspot category appeared to be independent insertions at identical or nearly identical (within a few nucleotides) sites. We found six potential hot spots that were characterized by two patterns of insertion at these sites (Fig. 1b,d). At four of these sites, it appeared that two independent insertions had occurred at the same site in the same taxon (Fig. 1d, Species 1); for these, we scored each insertion event independently. Of these four cases, one was identified because the insertions were in different directions. The second was identified because the same region of the CR1 was included in each
insertion event. In the third case, the two insertions represented different segments of a CR1 and did not align well to a single subtype. In the last case, there were different types (SINE and CR1). Some of these cases could be explained without invoking a hotspot model. The first two of these double-TE insertions (those that involve the same region of a specific element) could reflect duplication of the insertion (combined with an inversion for the TE insertion in different directions), whereas the third could involve a deletion event in the middle of an insertion combined with a high mutation rate (necessary to explain our observation that the two regions do not align to the same subtype with a high degree of identity). However, the insertion of distinct TE types (e.g., the SINE and CR1) at the same site must reflect independent insertions. Regardless of the specific mechanism(s) responsible for each of these insertions, it is clear that hot spots can be detected using a data set of the size we examined here and that determining whether specific TE insertions are homologous has the potential to be difficult. Two sites with insertions at essentially the same site in different orders (i.e., similar to Species 1 and 5 in Fig. 1b) were also identified, suggesting the observed TE insertions had independent origins in each of the lineages, and providing additional evidence for the existence of hot spots in avian genomes. The first example of an independent insertion was identified because there was a large phylogenetic distance between clades with the TE insertions (Fig. 2 open diamonds). Uniting the clades with the insertions would require rearranging multiple strongly supported branches in the Hackett et al. (2008) phylogeny that are congruent with other estimates of avian phylogeny (e.g., Livezey and Zusi 2007). Furthermore, assuming that these insertions (TE insertions 24 and 25 in Table S1) have a single origin would render another TE (TE insertion 36 in Table S1) homoplastic and increase the number of changes necessary to explain the distribution of a second TE insertion (TE insertion 50 in Table S1; also see below for more information about this insertion). The second example was identified because the TE insertions were in different directions (Fig. 2 filled diamonds), although it remains possible that this pattern reflects a single insertion followed by a precise inversion of the TE region. Neither of these TE insertions were phylogenetically misleading (presuming independent insertion can be identified through the patterns we observed), but they do provide evidence for the
Downloaded from sysbio.oxfordjournals.org at UNM Health Sciences Library and Informatics Center on February 11, 2011
a When
Number of insertions
2011
POINT OF VIEW
7
Downloaded from sysbio.oxfordjournals.org at UNM Health Sciences Library and Informatics Center on February 11, 2011
FIGURE 2. Phylogeny from Hackett et al. (2008) showing hypothesized TE insertions. Clades with no insertion events are collapsed for simplicity, and the number of taxa included in that clade is noted in parentheses. Symbols used are identical to Figure 1. There are 2 pairs of independent insertions with one pair represented by an open diamond and the other pair by a closed diamond.
8
SYSTEMATIC BIOLOGY
VOL. 60
existence of hot spots for TE insertion and/or fixation in the genome. In these situations, careful examination of the sequences (examining directionality, the segments of the TE present in the insertion, and whether the TE insertions are divergent types), as well as phylogenetic structure, helped identify insertions that were likely to be independent. We identified two insertions in the homoplasy category (Fig. 1b). In HMGN2 intron 4, a CR1 insertion uniting the Piciformes and Coraciiformes was absent in a single clade within the Piciformes (Fig. 3a). Specifically, this insertion (TE insertion 50 in Table S1) was absent in the suborder Galbulae, represented by Bucco and Galbula in Hackett et al. (2008) but present in other Piciformes and the outgroup (Coraciiformes). In GH1 intron 2, an insertion (TE insertion 38 in Table S1) was found in all Cuculiformes for which we had sequence data in this region except Geococcyx (Fig. 3b). This TE insertion was present in Crotophaga, the sister taxon of Geococcyx. Thus, both of these TE inserts are homoplastic given the Hackett et al. (2008) tree.
The apparent homoplasy associated with the TE insertions in the HMGN2 and GH1 loci has several potential explanations. Errors in the Hackett et al. (2008) tree are an unlikely explanation because the relevant branches are well supported by many lines of evidence, including morphology (Livezey and Zusi 2007) and other molecular studies (e.g., Ericson et al. 2006). Additionally, both of the insertions that appear homoplastic conflict with other TEs; the HMGN2 insertion conflicts with an insertion in another locus (GH1; TE insertion 36 in Table S1), whereas the GH1 insertion conflicts with a second insertion in the same locus (TE insertion 39 in Table S1) and an insertion in another locus, EEF2 (TE insertion 26 in Table S1). Therefore, the conclusion of TE insertion homoplasy is independent of the Hackett et al. (2008) topology. Although lineage sorting is a possible explanation for the taxonomic distribution of the TE insertions in HMGN2 and GH1 because gene tree–species tree conflicts are known to occur (Degnan and Rosenberg 2009), several lines of evidence indicate that TE homoplasy
Downloaded from sysbio.oxfordjournals.org at UNM Health Sciences Library and Informatics Center on February 11, 2011
FIGURE 3. ML bootstrap analysis and alignments of loci that include insertions that appear homoplastic. ML bootstrap support >50% are shown. Analyses were run with all taxa for which we had data, although only the clades of interest are shown for each gene tree. Alignments are for the same taxa, with several related taxa shown for comparison. a) HMGN2, showing the absence of the insertion in Bucco and Galbula sequences. b) GH1, showing the absence of the insertion in Geococcyx. For this locus, Coua had a large deletion spanning the entire region (including much of the flanking intron). Sequences for one cuculiform, Centropus, could not be obtained for GH1 and so it is not included in this figure.
2011
POINT OF VIEW
D ISCUSSION We found TE insertions in the intron partitions of most genes that we examined, consistent with the expectation that they are located throughout avian genomes. Almost all large insertions in our alignments were TEs, suggesting that TEs explain much of the observed variation in intron length. In agreement with recent studies that have used TE insertions for phylogenetic estimation, we found many insertions that defined widely accepted clades. However, we also found evidence of homoplasy. Although concern about homoplasy in TE data is not novel (e.g., Hillis 1999; Miyamoto 1999; Ray et al. 2006), many authors have suggested that apparent homoplasy of TEs with respect to the species tree can be explained by hemiplasy (e.g., Shedlock and Okada 2000; Kriegs et al. 2006; Nishihara et al. 2006a; Ray et al. 2006; Kaiser et al. 2007; Kriegs et al. 2007; Treplin and Tiedemann 2007). Nevertheless, lineage sorting is an unlikely explanation for the two cases of homoplasy we identified. Instead our data suggest that hot spots for TE insertions (and/or the fixation of TE insertions) reduce state space for this type of RGC, that precise deletion of these TEs can occur or that both phenomena contribute to homoplasy in avian TEs. Insertion Sites, Hot spots, and Deletions Regions of the genome can be TE-free (Simons et al. 2007), and when those observations are combined with our study, it seems clear that rates of TE insertion
and/or fixation exhibit substantial variation across the avian genome. An exceptionally large number of TE insertions were found in specific introns, suggesting that they are hot spots for TE insertion or fixation. In fact, we identified four sites with multiple insertions (e.g. Fig. 1d) and two sites in which insertions occurred independently in divergent taxa (e.g., Fig. 1b). St. John and Quinn (2008) noted that recent CR1 insertions frequently had a TTCT sequence flanking the 3 0 end of the insertion, suggesting a bias toward insertion at sites with this specific motif. This observation is consistent with the target-primed reverse transcription mechanism of retrotransposon insertion (see above), which involves endonuclease-mediated nicking of the target DNA followed by base pairing between conserved elements at the end of the TE (e.g., TTCT for CR1 elements) and the target sequence. We did not find the TTCT sequence flanking any of the CR1 insertions we identified, though St. John and Quinn (2008) reported that the motifs degraded and were mostly associated with very recent insertions. Thus, our failure to identify conserved TTCT motifs suggests that the insertions we identified are too ancient for preservation of the motif, although it is also possible that the elements we identified inserted through a variation of this mechanism. Excision of TEs also has the potential to contribute to the observed phylogenetic distribution of insertions (for another possible example, see Murphy et al. 2007). In fact, the most parsimonious explanation for the homoplasy in HMGN2, assuming that insertions and deletions are weighted equally, would be insertion followed by a precise deletion of the entire insertion in some taxa within a clade. The alternative hypothesis, which is less parsimonious given equal weighting of insertions and deletions, would require three independent insertions given the Hackett et al. (2008) topology. Although the degree to which natural selection favors deletion of TEs is not known, selection may favor deletion for at least some TE classes (Petrov et al. 2003) and the potential for homoplasy due to TE deletions should not be ignored.
Phylogenetic Considerations TE insertions retain a strong phylogenetic signal and have substantial potential for phylogenetic analyses. They exhibit very little homoplasy (Fig. 2); the retention index (RI) of TE insertions on the Hackett et al. (2008) tree is 0.97, much greater than that of Hackett et al. (2008) sequence data on the same tree (RIintron = 0.52, RIcoding exons = 0.54, RIUTR = 0.58). However, most of the TE insertions identified here were autapomorphic or united more recently diverged clades (e.g., they united families) that were already well supported by sequence data. A major reason for this may be the structure of the avian tree in which many clades arose during a short period (Chojnowski et al. 2008; Hackett et al. 2008). This means that many of the deep branches in the avian tree of life are very short, making the probability of accumulating a synapomorphic insertion on these internodes
Downloaded from sysbio.oxfordjournals.org at UNM Health Sciences Library and Informatics Center on February 11, 2011
(e.g., Fig. 1c) is more likely than hemiplasy (i.e., Fig. 1a) for the distribution of TE insertions in HMGN2 and GH1. Examination of the gene trees for HMGN2 and GH1 (excluding the insertion) indicates that the insertions occur on relatively long branches (see online Fig. S1, available from http://www.sysbio.oxfordjournals.org/) and there is strong support for a gene-tree topology in conflict with the insertion. In principle, lineage sorting could be reconciled with both the distribution of TE insertions and the estimates of gene trees we obtained (Fig. 3) by invoking recombination or gene conversion. These phenomena predict that sites supporting an alternative topology (a topology consistent with the distribution of the TE insertion) would be found near the insertion; however, a pattern of sites supporting a topology congruent with the TE was not evident (data not shown), suggesting neither recombination nor gene conversion is likely. Instead, the distribution we observed was most consistent with either a precise deletion of the CR1 in the ancestor to these taxa (without leaving a molecular signature of the insertion as occurs with some TE types; cf. Shedlock et al. 2004) or independent insertions of the identical portion of a CR1 in multiple ancestors within the clade. Further research on the mechanisms of insertion and deletion for these TEs may reveal the most plausible pathway but either alternative could lead to incorrect phylogenetic conclusions.
9
10
VOL. 60
SYSTEMATIC BIOLOGY
C ONCLUSIONS The TE insertions identified here provide support for a number of branches in the avian tree of life (Fig. 2). It is clear that TEs have the potential to provide ad-
ditional evidence regarding relationships when nucleotides provide surprising or conflicting results. We found that having sequence data helped to clarify the independence of insertions, emphasizing the importance of sequencing TE insertions. Our results also suggest that TEs should not be viewed as perfect characters exempt from homoplasy. Instead, TE insertions present many of the same challenges for phylogenetic analyses as other types of data, such as nucleotide sequences. Available statistical methods for the analysis of TEs assume that any apparent homoplasy is due to differences between gene trees and species trees (Waddell et al. 2001). However, hemiplasy due to gene tree–species tree conflicts were not consistent with the homoplasy evident in our study. Ultimately, analytical methods for RGCs that can accommodate both hemiplasy and homoplasy are likely to prove more useful. An even more productive approach may be to develop methods that can integrate data from TE insertions into large-scale analyses of nucleotide sequences, potentially along with information about other types of RGCs. Integrated approaches of this type will ultimately allow analyses that can recover accurate phylogenomic estimates using all available information. S UPPLEMENTARY M ATERIAL Supplementary material, including data files and/or online-only appendices, can be found at http://www .sysbio.oxfordjournals.org/. F UNDING This work was supported by the U.S. National Science Foundation Assembling the Tree of Life Program (DEB0228682 to R.T.K., E.L.B., and D.W.S., DEB-0228675 to S.J.H., DEB-0228688 to F.H.S., and DEB-0228617 to W.S.M.). A CKNOWLEDGMENTS This manuscript was improved by comments from J. Gordon Burleigh, Carol L. Chaffee, Julie M. Allen as well as two anonymous reviewers and our editors. Naomi R. Iahusz-Valez helped test insertion rate heterogeneity. R EFERENCES Abrus´an G., Krambeck H.J., Junier T., Giordano J., Warburton P.E. 2008. Biased distributions and decay of long interspersed nuclear elements in the chicken genome. Genetics. 178:573–581. Avise J.C., Robinson T.J. 2008. Hemiplasy: a new term in the lexicon of phylogenetics. Syst. Biol. 57:503–507. Barker F.K., Cibois A., Schikler P., Feinstein J., Cracraft J. 2004. Phylogeny and diversification of the largest avian radiation. Proc. Natl. Acad. Sci. U.S.A. 101:11040–11045. Boissinot S., Chevret P., Furano A.V. 2000. L1 (LINE-1) retrotransposon evolution and amplification in recent human history. Mol. Biol. Evol. 17:915–928.
Downloaded from sysbio.oxfordjournals.org at UNM Health Sciences Library and Informatics Center on February 11, 2011
quite low (see Braun and Kimball 2001) and inflating the probability of hemiplasy. Consistent with the low probability of observing insertions that occurred along these short branches, all the synapomorphic insertions we observed occurred upon the longer internodes in the Hackett et al. (2008) tree that are well supported in nucleotide analyses. Another potential reason for the absence of TE insertions that unite groups defined by these short branches deep in the avian tree of life is that older insertions may be difficult to identify due to a bias toward deletion of these elements or the accumulation of other mutations over time that can obscure TE identification. Regardless of the basis for the pattern we observe, our results suggest that TE insertions may have the greatest potential to be phylogenetically informative within orders and families in birds where insertion events are easier to identify and characterize. The observation that independent TE insertions can occur at the exact same site in the same or different taxa, or can be precisely deleted, suggests that care needs to be taken in assigning character states for phylogenetic analyses. Although subtype identification could help to clarify complex patterns of TE insertion, subtype identification is also complicated by the accumulation of both point mutations and indels after the insertions occur. Indeed, the bias toward deletion at the 50 end (Abrus´an et al. 2008) has the potential to result in short remnants of CR1s that cannot be reliably identified by subtype. In addition, the master gene model for retrotransposons predicts that many insertions within a specific lineage are likely to be the same subtype (Watanabe et al. 2006; Kriegs et al. 2007), further limiting the ability of subtype identification in teasing out more complex situations. In all cases, however, careful examination of the sequences and the alignment will help establish boundaries and aid in determining whether specific TE insertions are likely to be independent or shared. Our results are consistent with analyses of the chicken genome (Wicker et al. 2005) and suggest that it might be most profitable to continue targeting CR1s for avian phylogenetics (e.g., Watanabe et al. 2006; Kaiser et al. 2007; Kriegs et al. 2007; Treplin and Tiedemann 2007) rather than the less common ERVs and SINEs. The ERVs we identified occurred at a lower frequency (∼5% of insertions) in our data than in the chicken genome (∼15% of insertions) (Huda et al. 2008). This may either reflect our more limited genomic sampling, or it may indicate that the chicken (or Galliformes as a whole) may have more ERV insertions than other birds. The latter hypothesis is consistent with the observation that two of the three ERVs we identified were in members of the Galliformes, although the small number of ERVs identified does not allow us to draw firm conclusions.
2011
POINT OF VIEW
Hudson R.R. 1992. Gene trees, species trees and the segregation of ancestral alleles. Genetics. 131:509–512. Ichiyanagi K., Okada N. 2008. Mobility pathways for vertebrate L1, L2, CR1, and RTE clade retrotransposons. Mol. Biol. Evol. 25: 1148–1157. International Chicken Genome Sequencing Consortium 2004. Sequence and comparative analysis of the chicken genome provide unique perspectives on vertebrate evolution. Nature. 432:695–716. Jurka J. 1997. Sequence patterns indicate an enzymatic involvement in integration of mammalian retroposons Proc. Natl. Acad. Sci. U.S.A. 94:1872–1877. Jurka J. 1998. Repeats in genomic DNA: mining and meaning. Curr. Opin. Struct. Biol. 8:333–337. Jurka J. 2008. RTE-related SINE family from a horse. Repbase Rep. 8:378. Jurka J., Kapitonov V.V., Pavlicek A., Klonowski P., Kohany O., Walichiewicz J. 2005. Repbase update, a database of eukaryotic repetitive elements. Cytogenet. Genome Res. 110:462–467. Kaiser V.B., van Tuinen M., Ellegren H. 2007. Insertion events of CR1 retrotransposable elements elucidate the phylogenetic branching order in galliform birds. Mol. Biol. Evol. 24:338–347. Kapitonov V.V., Jurka J. 2006. Self-synthesizing DNA transposons in eukaryotes. Proc. Natl. Acad. Sci. U.S.A. 103:4540–4545. Keeling P.J., Doolittle W.F. 1997. Widespread and ancient distribution of a noncanonical genetic code in diplomonads. Mol. Biol. Evol. 14:895–901. Kimball R.T., Braun E.L. 2008. A multigene phylogeny of Galliformes supports a single origin of erectile ability in non-feathered facial traits. J. Avian Biol. 39:438–445. Kohany O., Gentles A.J., Hankus L., Jurka J. 2006. Annotation, submission and screening of repetitive elements in Repbase: RepbaseSubmitter and Censor. BMC Bioinformatics. 7:474. Kriegs J.O., Churakov G., Kiefmann M., Jordan U., Brosius J., Schmitz J. 2006. Retroposed elements as archives for the evolutionary history of placental mammals. PLoS Biol. 4:e91. Kriegs J.O., Matzke A., Churakov G., Kuritzin A., Mayr G., Brosius J., Schmitz J. 2007. Waves of genomic hitchhikers shed light on the evolution of gamebirds (Aves: Galliformes). BMC Evol. Biol. 7:190. Labrador M., Corces V.G. 1997. Transposable element-host interactions: regulation of insertion and excision. Annu. Rev. Genet. 31:381–404. Livezey B.C., Zusi R.L. 2007. Higher-order phylogeny of modern birds (Theropoda, Aves: Neornithes) based on comparative anatomy. II. Analysis and discussion. Zool. J. Linn. Soc. 149:1–95. Luan D.D., Korman M.H., Jakubczak J.L., Eickbush T.H. 1993. Reverse transcription of R2Bm RNA is primed by a nick at the chromosomal target site: a mechanism for non-LTR retrotransposition. Cell. 72:595–605. Miyamoto M.M. 1999. Molecular systematics: perfect SINEs of evolutionary history? Curr. Biol. 9:R816–R819. Murphy W.J., Pringle T.H., Crider T.A., Springer M.S., Miller W. 2007. Using genomic data to unravel the root of the placental mammal phylogeny. Genome Res. 17:413–421. Nishihara H., Hasegawa M., Okada N. 2006a. Pegasoferae, an unexpected mammalian clade revealed by tracking ancient retroposon insertions. Proc. Natl. Acad. Sci. U.S.A. 103:9929–9934. Nishihara H., Maruyama S., Okada N. 2009. Retroposon analysis and recent geological data suggest near-simultaneous divergence of the three superorders of mammals. Proc. Natl. Acad. Sci. U.S.A. 106:5235–5240. Nishihara H., Smit A.F.A., Okada N. 2006b. Functional noncoding sequences derived from SINEs in the mammalian genome. Genome Res. 16:864–874. Pamilo P., Nei M. 1988. Relationships between gene trees and species trees. Mol. Biol. Evol. 5:568–583. Petrov D.A., Aminetzach Y.T., Davis J.C., Bensasson D., Hirsh A.E. 2003. Size matters: non-LTR retrotransposable elements and ectopic recombination in Drosophila. Mol. Biol. Evol. 20:880–892. Prasad A.B., Allard M.W., NISC Comparative Sequencing Program, Green E.D. 2008. Confirming the phylogeny of mammals by use of large comparative sequence data sets. Mol. Biol. Evol. 25:1795–1808. Ray D.A., Xing J., Salem A.H., Batzer M.A. 2006. SINEs of a nearly perfect character. Syst. Biol. 55:928–935.
Downloaded from sysbio.oxfordjournals.org at UNM Health Sciences Library and Informatics Center on February 11, 2011
Braun E.L. 2003. Innovation from reduction: gene loss, domain loss and sequence divergence in genome evolution. Appl. Bioinformatics. 2:13–34. Braun E.L., Grotewold E. 2001. Fungal zuotin proteins evolved from MIDA1-like factors by lineage-specific loss of MYB domains. Mol. Biol. Evol. 18:1401–1412. Braun E.L., Kimball R.T. 2001. Polytomies, the power of phylogenetic inference, and the stochastic nature of molecular evolution: a comment on Walsh et al. (1999). Evolution. 55:1261–1263. Chojnowski J.L., Kimball R.T., Braun E.L. 2008. Introns outperform exons in analyses of basal avian phylogeny using clathrin heavy chain genes. Gene. 410:89–96. Cox W.A., Kimball R.T., Braun E.L. 2007. Phylogenetic position of the New World quail (Odontophoridae: eight nuclear loci and three mitochondrial regions contradict morphology and the Sibley-Ahlquist tapestry. Auk. 124:71–84. Crowe T.M., Bowie R.C.K., Bloomer P., Mandiwana T.G., Hedderson T.A.J., Randi E., Pereira S.L., Wakeling J. 2006. Phylogenetics, biogeography and classification of, and character evolution in, gamebirds (Aves: Galliformes): effects of character exclusion, data partitioning and missing data. Cladistics. 22:495–532. Degnan J.H., Rosenberg N.A. 2009. Gene tree discordance, phylogenetic inference and the multispecies coalescent. Trends Ecol. Evol. 24:332–340. Ericson P.G.P., Anderson C.L., Britton T., Elzanowski A., Johansson U.S., K¨allersjo¨ M., Ohlson J.I., Parsons T.J., Zuccon D., Mayr G. 2006. Diversification of Neoaves: integration of molecular sequence data and fossils. Biol. Lett. 2:543–547. Feng Q., Schumann G., Boeke J.D. 1998. Retrotransposons R1Bm endonuclease cleaves the target sequence. Proc. Natl. Acad. Sci. U.S.A. 95:2083–2088. Finnegan D.J. 1989. Eukaryotic transposable elements and genome evolution. Trends Genet. 5:103–107. Gibb G.C., Kardailsky O., Kimball R.T., Braun E.L., Penny D. 2007. Mitochondrial genomes and avian phylogeny: complex characters and resolvability without explosive radiations. Mol. Biol. Evol. 24: 269–280. Groth J.G., Barrowclough G.F. 1999. Basal divergences in birds and the phylogenetic utility of the nuclear RAG-1 gene. Mol. Phylogenet. Evol. 12:115–123. Haas N.B., Grabowski J.M., Sivitz A.B., Burch J.B.E. 1997. Chicken repeat 1 (CR1) elements, which define an ancient family of vertebrate non-LTR retrotransposons, contain two closely spaced open reading frames. Gene. 197:305–309. Hackett S.J., Kimball R.T., Reddy S., Bowie R.C.K., Braun E.L., Braun M.J., Chojnowski J.L., Cox W.A., Han K.-L., Harshman J., Huddleston C.J., Marks B.D., Miglia K.J., Moore W.S., Sheldon F.H., Steadman D.W., Witt C.C., Yuri T. 2008. A phylogenomic study of birds reveals their evolutionary history. Science. 320:1763–1768. Harshman J., Braun E.L., Braun M.J., Huddleston C.J., Bowie R.C.K, Chojnowski J.L., Hackett S.J., Han K.-L., Kimball R.T., Marks B.D., Miglia K.J., Moore W.S., Reddy S., Sheldon F.H., Steadman D.W., Steppan S.J., Witt C.C., Yuri T. 2008. Phylogenomic evidence for multiple losses of flight in ratite birds. Proc. Natl. Acad. Sci. U.S.A. 105:13462–13467. Hedges S.B., Dudley J., Kumar S. 2006. TimeTree: a public knowledgebase of divergence times among organisms. Bioinformatics. 22: 2971–2972. Hillis D.M. 1999. SINEs of the perfect character. Proc. Natl. Acad. Sci. U.S.A. 96:9979–9981. Hubbard T.J.P., Aken B.L., Beal K., Ballester B., Caccamo M., Chen Y., Clarke L., Coates G., Cunningham F., Cutts T., Down T., Dyer S.C., Fitzgerald S., Fernandez-Banet J., Graf S., Haider S., Hammond M., Herrero J., Holland R., Howe K., Howe K., Johnson N., Kahari A., Keefe D., Kokocinski F., Kulesha E., Lawson D., Longden I., Melsopp C., Megy K., Meidl P., Ouverdin B., Parker A., Prlic A., Rice S., Rios D., Schuster M., Sealy I., Severin J., Slater G., Smedley D., Spudich G., Trevanion S., Vilella A., Vogel J., White S., Wood M., Cox T., Curwen V., Durbin R., Fernandez-Suarez X.M., Flicek P., Kasprzyk A., Proctor G., Searle S., Smith J., Ureta-Vidal A., Birney E. 2007. Ensembl 2007. Nucleic Acids Res. 35:D610–D617. Huda A., Polavarapu N., Jordan I.K., McDonald J.F. 2008. Endogenous retroviruses of the chicken genome. Biol. Direct. 3:9.
11
12
SYSTEMATIC BIOLOGY
Treplin S., Tiedemann R. 2007. Specific chicken repeat 1 (CR1) retrotransposon insertion suggests phylogenetic affinity of rockfowls (genus Picathartes) to crows and ravens (Corvidae). Mol. Phylogenet. Evol. 43:328–337. Vandergon T.L., Reitman M. 1994. Evolution of chicken repeat 1 (CR1) elements: evidence for ancient subfamilies and multiple progenitors. Mol. Biol. Evol. 11:886–898. Waddell P.J., Kishino H., Ota R. 2001. A phylogenetic foundation for comparative mammalian genomics. Genome Inform. 12: 141–154. Watanabe M., Nikaido M., Tsuda T.T., Inoko H., Mindell D.P., Murata K., Okada N. 2006. The rise and fall of the CR1 subfamily in the lineage leading to penguins. Gene. 365:57–66. Weiss R.A. 2006. The discovery of endogenous retroviruses. Retrovirology. 3:67. Wicker T., Robertson J.S., Schulze S.R., Feltus F.A., Magrini V., Morrison J.A., Mardis E.R., Wilson R.K., Peterson D.G., Paterson A.H., Ivarie R. 2005. The repetitive landscape of the chicken genome. Genome Res. 15:126–136. Wicker T., Sabot F., Hua-Van A., Bennetzen J.L., Capy P., Chalhoub B., Flavell A., Leroy P., Morgante M., Panaud O., Paux E., SanMiguel P., Schulman A.H. 2007. A unified classification system for eukaryotic transposable elements. Nat. Rev. Genet. 8:973– 982. Wildman D.E., Uddin M., Opazo J.C., Liu G., Lefort V., Guindon S., Gascuel O., Grossman L.I., Romero R., Goodman M. 2007. Genomics, biogeography, and the diversification of placental mammals. Proc. Natl. Acad. Sci. U.S.A. 104:14395–14400. Xiong Y., Eickbush T.H. 1988. The site-specific ribosomal DNA insertion element R1Bm belongs to a class of non-long-terminal-repeat retrotransposons. Mol. Cell. Biol. 8:114–123. Yuri T., Kimball R.T., Braun E.L., Braun M.J. 2008. Duplication and accelerated evolution of growth hormone gene in passerine birds. Mol. Biol. Evol. 25:352–361. Zwickl D.J. 2006. Genetic algorithm approaches for the phylogenetic analysis of large biological sequence datasets under the maximum likelihood criterion [Ph.D. dissertation]. Austin (TX): University of Texas at Austin.
Downloaded from sysbio.oxfordjournals.org at UNM Health Sciences Library and Informatics Center on February 11, 2011
Rokas A., Holland P.W.H. 2000. Rare genomic changes as a tool for phylogenetics. Trends Ecol. Evol. 15:454–459. Sanderson M.J. 1997. A nonparametric approach to estimating divergence times in the absence of rate constancy. Mol. Biol. Evol. 14:1218–1231. Sasaki T., Takahashi K., Nikaido M., Miura S., Yasukawa Y., Okada N. 2004. First application of the SINE (short interspersed repetitive element) method to infer phylogenetic relationships in reptiles: an example from the turtle superfamily Testudinoidea. Mol. Biol. Evol. 21:705–715. Sasaki T., Yasukawa Y., Takahashi K., Miura S., Shedlock A.M., Okada N. 2006. Extensive morphological convergence and rapid radiation in the evolutionary history of the Geoemydidae (Old World pond turtles) revealed by SINE insertion analysis. Syst. Biol. 55: 912–927. Shedlock A.M., Okada N. 2000. SINE insertions: powerful tools for molecular systematics. Bioessays. 22:148–160. Shedlock A.M., Takahashi K., Okada N. 2004. SINEs of speciation: tracking lineages with retroposons. Trends Ecol. Evol. 19:545–553. Sibley C.G., Ahlquist J.E. 1990. Phylogeny and classification of birds: a study in molecular evolution. New Haven (CT): Yale University Press. Simons C., Makunin I.V., Pheasant M., Mattick J.S. 2007. Maintenance of transposon-free regions throughout vertebrate evolution. BMC Genomics. 8:470. Smit A.F.A., Hubley R., Green P. 2004. RepeatMasker Open-3.0 [Internet]. Available from: http://www.repeatmasker.org. (Accessed July 15, 2009). St. John J., Quinn T.W. 2008. Recent CR1 non-LTR retrotransposon activity in coscoroba reveals an insertion site preference. BMC Genomics. 9:567. Stechmann A., Cavalier-Smith T. 2002. Rooting the eukaryote tree by using a derived gene fusion. Science. 297:89–91. Steel M., Penny D. 2000. Parsimony, likelihood, and the role of models in molecular phylogenetics. Mol. Biol. Evol. 17:839–850. Swofford D.L. 2003. PAUP*: phylogenetic analysis using parsimony (*and other methods). Version 4.0b10. Sunderland (MA): Sinauer Associates.
VOL. 60