RESEARCH ARTICLE
Pollination Mode and Mating System Explain Patterns in Genetic Differentiation in Neotropical Plants Liliana Ballesteros-Mejia1, Natácia E. Lima1, Matheus S. Lima-Ribeiro2, Rosane G. Collevatti1*
a11111
1 Laboratório de Genética & Biodiversidade, Instituto de Ciências Biológicas, Universidade Federal de Goiás, Cx.P. 131, 74001–970, Goiânia, GO, Brazil, 2 Laboratório de Macroecologia, Universidade Federal de Goiás, Campus Jataí, Cx.P. 03, 75801–615, Jataí, GO, Brazil *
[email protected]
Abstract OPEN ACCESS Citation: Ballesteros-Mejia L, Lima NE, Lima-Ribeiro MS, Collevatti RG (2016) Pollination Mode and Mating System Explain Patterns in Genetic Differentiation in Neotropical Plants. PLoS ONE 11 (7): e0158660. doi:10.1371/journal.pone.0158660 Editor: Jeff Ollerton, University of Northampton, UNITED KINGDOM Received: July 27, 2015 Accepted: June 20, 2016 Published: July 29, 2016 Copyright: © 2016 Ballesteros-Mejia et al. This is an open access article distributed under the terms of the Creative Commons Attribution License, which permits unrestricted use, distribution, and reproduction in any medium, provided the original author and source are credited. Data Availability Statement: All relevant data are within the paper and its Supporting Information files. Funding: RGC received grants from the following sources: Conselho Nacional de Pesquisa (CNPq) supported the research network GENPAC (Geographical Genetics and Regional Planning for natural resources in Brazilian Cerrado, project no. 563624/2010-8), and the network Rede Cerrado CNPq/PPBio project no. 457406/2012-7. LBM received a fellowship from Conselho de Aperfeiçoamento de Pessoal em Ensino (CAPES) Project Ciências sem Fronteira CSF-PAJT/CAPES no. 88881.030318/2013-01.
We studied genetic diversity and differentiation patterns in Neotropical plants to address effects of life history traits (LHT) and ecological attributes based on an exhaustive literature survey. We used generalized linear mixed models (GLMMs) to test the effects as fixed and random factors of growth form, pollination and dispersal modes, mating and breeding systems, geographical range and habitat on patterns of genetic diversity (HS, HeS, π and h), inbreeding coefficient (FIS), allelic richness (AR) and differentiation among populations (FST) for both nuclear and chloroplast genomes. In addition, we used phylogenetic generalized least squares (pGLS) to account for phylogenetic independence on predictor variables and verify the robustness of the results from significant GLMMs. In general, GLMM revealed more significant relationships among LHTs and genetic patterns than pGLS. After accounting for phylogenetic independence (i.e., using pGLS), FST for nuclear microsatellites was significantly related to pollination mode, mating system and habitat. Plants specifically with outcrossing mating system had lower FST. Moreover, AR was significantly related to pollination mode and geographical range and HeS for nuclear dominant markers was significantly related to habitat. Our findings showed that different results might be retrieved when phylogenetic non-independence is taken into account and that LHTs and ecological attributes affect substantially the genetic pattern in Neotropical plants, hence may drive key evolutionary processes in plants.
Introduction The search for patterns in evolutionary ecology has been extensively discussed in literature as a central problem in ecology (see [1,2] for recent reviews). Lawton ([3] p 145) stated, “Without bold, regular patterns in nature, ecologists do not have anything very interesting to explain”. However, the observed variables and the ecological and evolutionary mechanisms affecting the patterns operate at different scales across space, time and ecological organization, challenging the finding of such patterns and their ecological and evolutionary causes [4]. In population
PLOS ONE | DOI:10.1371/journal.pone.0158660 July 29, 2016
1 / 24
Genetic Differentiation in Neotropical Plants
Competing Interests: The authors have declared that no competing interests exist.
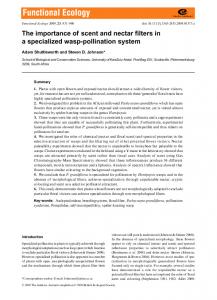
genetics, genetic diversity and its distribution both within and among populations may be determined by microevolutionary processes such as demographic history, selection and gene flow which in turn may operate at different scales of space, time and ecological organization (see [5] for a review). Studying this feature should then be the first step to understand the evolutionary path that a species undertake. Plant life-history traits (hereafter LHT) such as growth form, pollen and seed dispersal modes and breeding system, as well as geographical distribution and other ecological attributes may also influence genetic structure, gene flow and effective population size. As a consequence, life-history may determine the relative importance of microevolutionary processes, thus affecting population genetic structure [6]. Previous reviews in population genetics aiming to find patterns in genetic diversity and population structure in plants have shown relationship between LHT and population differentiation for isozyme/allozyme loci and dominantly inherited nuclear DNA markers such as RAPD, ISSR and AFLP [6–12]. These studies indicate that either long-lived woody or outcrossing species have higher genetic diversity within than among populations, contrary to annual selfing species. Long-lived outcrossing species may have larger effective population sizes preventing the loss of genetic diversity and population differentiation due to genetic drift [6]. Genetic diversity is significantly higher in larger populations, mainly in self-incompatible species, but the level of inbreeding FIS is independent of population size [13]. In addition, due to low population density, significant rates of self-fertilization and biparental inbreeding (outcross between related individuals), tropical trees have significantly higher genetic differentiation than temperate forest trees [14]. Patterns in plant genetic diversity are also related to habitat fragmentation, still LHT such as pollination and seed dispersal modes are not related to the susceptibility to the loss of genetic diversity [15]. In general, the findings from these reviews reveal important patterns and their causes. However, they suffer serious statistical flaws. In this type of reviews, data is often non-normal distributed and researchers usually transform data to achieve normality and homogeneity of variance and rely on the robustness of ANOVA or use Generalized Linear Models (GLM) [8,9,16–18], (Fig 1, arrow “a”). These approaches may lead to errors since they ignore random effects from different LHT and treat all of them as fixed factors committing pseudoreplication (see [19,20] for a review). A more appropriate method to analyze such data would be generalized linear mixed models (GLMMs) because it combines desirable properties of two statistical frameworks; i.e. linear mixed models, incorporating random effects, and GLM, which handles non-normal data [21]. GLMM could thus match better the structure of the data (Fig 1, arrow “b”). Besides the mixed structure of the data, traditional reviews have also ignored the phylogenetic relationship among the species (but see [16,17]). Conventional methods and GLMMs do not account for phylogenetic dependence on the predictors such as LHT. Related species tend to resemble each other more than species randomly chosen from a phylogenetic tree, as a consequence of stochastic character evolution (Brownian motion) along a phylogeny (phylogenetic signal [22]). Thus, the phenotypes of a set of species may not represent independent samples from populations or lineages therefore such statistical methods may not be appropriate for comparative analysis and hypotheses testing about trait correlation across species [23] due to risk of inflating type I error. Thus GLMMs should be applied only if mixed factors (predictors) do not show phylogenetic signal (Fig 1, arrow “b”). Actually, it is necessary to first test for phylogenetic signal in the studied traits and if they are statistically significant then apply phylogenetically based methods for comparisons and hypotheses testing [24,25] (Fig 1, arrow “c”). When phylogenetic relationships are accounted for, related species tend to have similar levels of genetic diversity and differentiation for nuclear [17] and chloroplast molecular markers [16]. For example, in European Temperate and
PLOS ONE | DOI:10.1371/journal.pone.0158660 July 29, 2016
2 / 24
Genetic Differentiation in Neotropical Plants
Fig 1. Conceptual framework summarizing the traditional analyses and the advanced approach proposed here to account for random factors and phylogenetic signal across predictors. doi:10.1371/journal.pone.0158660.g001
Boreal-Temperate angiosperms were found significant effects of reproduction system, pollination and dispersal modes, successional status and geographical distribution on population differentiation. [16]. However, when phylogenetic non-independence was considered using Phylogenetic Independent Contrast [23], only seed mass and geographical distribution remained significant [16]. Similarly, significant relationships were found for growth form, plant size, perenniality, seed dispersal mode, seed mass, pollination mode and mating system with genetic differentiation [17]. Yet, only perenniality, breeding and mating systems showed significant relationship with genetic differentiation at nuclear genome when phylogenetic nonindependence was considered [17]. It is fundamental that phylogenetic relationships are previously considered in such reviews and analyses. However, reliable estimates of phylogenetic signal depend on enough sample size, which is not always available throughout reviews. Small samples might bias such estimates by overspread or clumping species throughout phylogenies and undesirably reveal weak or strong phylogenetic signals, respectively. To solve the problem of small sample size, the effect of phylogenetic signal could be directly inferred from GLMM analyses. Because phylogenetic non-independence inflate type I error (i.e., reject null hypotheses more times than expected by chance), only the significant relationships from GLMMs could suffer phylogenetic effects. Then, the robustness of significant GLMM relationships (and not non-significant ones) should be tested in the light of phylogenetic methods as pGLS (Fig 1, arrow “d”).
PLOS ONE | DOI:10.1371/journal.pone.0158660 July 29, 2016
3 / 24
Genetic Differentiation in Neotropical Plants
The Neotropics is one of the most diverse ecozones in the world; this vast biodiversity is a large repository of genetic information and has been defined as an active center of evolution [26]. Around 37% of seed plant species in the world occur in the Neotropics [27]. It includes eight of the 25 megadiverse hotspots, and some of the most threatened hotspots [28]. Hence, detection of genetic diversity and differentiation patterns is essential to address future research and conservation strategies in the Neotropics. For instance, geographical restricted species (i.e., presenting small effective population sizes) might experience rapid evolutionary changes due to rapid changes in allelic frequencies (genetic drift and founder effect [6,28]). In addition, previous works have showed that long-lived woody species may have higher genetic diversity and lower differentiation among populations due to larger effective populations sizes [6], however, in Neotropical rainforest, canopy trees usually occur at low density raising the question whether this expectation would hold in the Neotropics. Furthermore, in Angiospermae, organelle DNA is usually inherited maternally but nuclear DNA is biparentally inherited. As a result, nuclear markers are transmitted via pollen and seeds whereas maternally inherited markers are transmitted via seeds only. Additionally, because of the haploid nature and mode of inheritance, the effective population size of the nuclear genome is four times the size of the chloroplast genome, leading to a stronger effect of genetic drift on population genetic structure based on chloroplast data [29]. Thus, the comparative analysis of nuclear and organelle genomes, with different modes of inheritance, and mutation and evolutionary rates, may provide different patterns of genetic diversity and differentiation and still clarify the relative importance of pollen and seed flow on population differentiation [30]. Because of their underrepresentation in most review studies and their importance for conservation, here, we focused on Neotropical plants addressing the effects of life-history traits, geographical range and habitat on patterns in genetic diversity and differentiation based on a literature survey. We used GLMMs to test the effects of growth form, pollination and dispersal mode, mating system (mixed, outcrossing or selfing), breeding system (monoecious, dioecious, hermaphrodite), geographical range and habitat on patterns of genetic diversity (HeS, He, π and h), inbreeding (FIS), allelic richness (AR) and differentiation among populations (FST), for both nuclear and chloroplast genomes in Neotropical plants. In addition, we used phylogenetic generalized least squares (pGLS) to account for phylogenetic relationships and verify the robustness of the results found by significant GLMMs. Many Neotropical trees are widespread and have outcrossing mating system [6,9], in addition, long-lived woody species have typically larger effective population sizes [6], therefore we hypothesized that this growth form (i.e. trees) will have significant higher genetic diversity and allelic richness, and lower FST and FIS than the other growth forms. Similarly, we expect that species with long distance dispersal modes might have lower FST and FIS, as well as species with long distance pollination modes.
Material and Methods Database survey We surveyed publications of ‘population genetics of Neotropical plants’ from the Thomson Reuters Web of Science database (http://apps.webofknowledge.com), using Web of Science platform (ISI hereafter), and Scopus Search (http://www.elsevier.com/online-tools/scopus). The survey was performed considering the availability of publications in both databases from 1945 (first register in ISI) to December 2013. We used the most frequent keywords in the area: "population genetics", "phylogeography", "mating system", "reproductive system", “breeding system”, and "genetic structure", combined with (AND) "Neotropical trees" and "Neotropical
PLOS ONE | DOI:10.1371/journal.pone.0158660 July 29, 2016
4 / 24
Genetic Differentiation in Neotropical Plants
plants". Additional keywords such as “pollen dispersal” and “gene flow” retrieved no additional articles. We excluded phylogenetic studies, reviews and development of molecular markers such as microsatellite primer development or SNPs discovery. We included only Angiospermae due to the low number of Gymnospermae species in the Neotropics (they occur mostly in Patagonia, across southern Argentina and Chile, as well as in highlands across Andes and Mesoamerica). We considered as Neotropics the region comprising the Neotropical Floristic Kingdom [31], which includes southern Florida, lowlands in Mexico, Central America, Caribe and South America, excluding southernmost South America (south Argentina and Chile, mainly Patagonia) and Andean highlands.
Life-history traits and ecological attributes From each article we compiled information related to the studied species, number of individuals and populations, species life-history traits (i.e. dispersal and pollination modes, mating system, breeding system and growth form) and ecological attributes (i.e. geographical range and habitat). Data on LHT and attributes were obtained from the original articles or from articles about pollination system, seed dispersal or botanical reviews. We avoided creating many categories (for example mammalian seed dispersal by scatter-hoarding or endozoocory) due to the low sample size per category. We categorized species growth form as epiphytes, herbs, non-woody scandent vines, palms, shrubs, trees and woody long-lived vines. For seed dispersal mode we found species dispersed by autochory, bats (predominantly dispersed by bats), birds, water (hydrocory), terrestrial mammals, mixed (birds and mammals including bats) and wind. For pollination mode, we classified species pollinated by bats, beetles, butterflies, flies, hummingbirds, large bees, moths, small bees, wasps and wind (S1 Table). For breeding system we found monoecious, dioecious and hermaphrodite species. For mating system we found species with outcrossing and mixed systems. Due to the low number of studies for some LHT, we joined the categories: herbs and non-woody scandent vines (herbs hereafter); trees and woody long-lived vines (trees); autochory and wind dispersal (wind); butterfly and moth pollination (Lepidoptera); large and small bees and wasps (Hymenoptera). For ecological attributes, species geographical range was classified in two categories, narrow (species endemic to a specific habitat or species with restrict geographical range that occur in twenty or fewer localities) and widespread (S2 Table). Because this information is ambiguous in many studies we also checked geographical range using GBIF database (www.gbif.org). For habitat, we found species from deserts, grasslands, mangroves, mixed forests (i.e. species occurring in both rainforests and seasonally dry forests), savannas, seasonally dry forests (SDTFs hereafter), rainforests, rocky fields, rocky savannas and wetlands (S2 Table).
Genetic data To compile genetic data we first classified the studies according to the molecular marker (S3 Table): dominant nuclear markers (AFLP, ISSR, RAPD); nuclear microsatellites; isozyme/allozyme (isozyme hereafter); nuclear sequences (mainly nrDNA ITS); chloroplast sequences (intergenic spacers); chloroplast microsatellites. For chloroplast, those studies using CAPs (cleaved amplified polymorphism) and similar markers (such as chloroplast RFLP and AFLP) were grouped (CAPs hereafter) due to the similar genetic information provided. For chloroplast microsatellites and CAPs we compiled only genetic differentiation (FST). For nuclear dominant markers (AFLP, ISSR, RAPD); nuclear microsatellites and isozymes we obtained FST, genetic diversity within population (i.e. He for articles that studied only one population), overall population genetic diversity (i.e. HeS for articles that included more than one
PLOS ONE | DOI:10.1371/journal.pone.0158660 July 29, 2016
5 / 24
Genetic Differentiation in Neotropical Plants
population), defined by [32] as genetic diversity at species level. For nuclear microsatellites and isozymes we also obtained inbreeding coefficient (FIS) and allelic richness based on rarefaction (AR). For chloroplast and nuclear sequences we obtained FST and nucleotide (π) and haplotype (h) diversities. However FST for nuclear sequences could not be analyzed due to the low sample size. Number of alleles and haplotypes were not analyzed due to the effect of sample size. Since articles not always reported the same genetic parameters, data set could vary among parameters (see Tables 1, 2 and 3).
Data Analysis We fitted Generalized Linear Mixed Models (GLMMs) to investigate the effects of species LHT and ecological attributes on genetic diversity and differentiation. LHT (i.e. growth form, dispersal and pollination modes and breeding systems), and habitat type were treated as multistate categorical variables, whereas geographical range (i.e. narrow or widespread) and mating system (i.e. mixed or outcrossing) were treated as binary variable. Models were fitted for each genetic parameter. Species LHT and ecological attributes were fitted as fixed factors, and species identity was considered a random factor as multiple variables were measured per species. Analyses were performed using MCMCglmm package [33] implemented in R version 3.2.1 (R core team 2014). MCMCglmm uses a Bayesian framework with Markov Chain Monte Carlo algorithm in which a total of 80,000 iterations chains were used with 2,000 chains of burn-in with a Gaussian distribution. The effect of molecular markers on genetic parameters, was analyzed by fitting separate models for (1) nuclear dominant markers (i.e. AFLP, ISSR and RAPD); (2) isozymes; (3) nuclear microsatellites; (4) chloroplast markers (i.e. CAPs, chloroplast microsatellite and sequences). Due to the inheritance mode, chloroplast genome (uniparental) has 1/4 the effective population size of nuclear genome (biparental), which may affect the estimation of genetic variability and differentiation parameters, introducing noises in analyses precluding the detection of any pattern due to life-history traits or ecological attributes. When a species was studied more than once with the same molecular marker, the mean of the genetic parameters was used (40 cases in 186 species).
Accounting for phylogenetic relationships To account for phylogenetic non-independence on the effects of LHT and ecological attributes on genetic diversity and differentiation, we first obtained the reference phylogenetic hypothesis of the species included in each analysis. We used the internal master tree Phylomatic tree R20120829 from the platform Phylomatic [34] to built the phylogenetic hypothesis. Since we had no information on branch length for inclusion in the comparative analyses, all branch lengths were assigned a value of 1, which may not significantly bias the results [35]. Even the exact phylogeny of some taxa is still in debate, improvements on the phylogeny would not modify dramatically the results because polytomies are mainly at terminal nodes and most of phylogenetic relationships are well resolved at deeper levels [36]. To account for phylogenetic relationships we first tested whether the studied life-history traits and ecological attributes have phylogenetic signal (i.e. phylogenetically related species tend to be more similar than distantly related species [22]). We used Abouheif’s proximity test of serial independence [37,38] using the function abouheif.moran from the R-package adephylo [39] Then, we fitted Phylogenetic Generalized Least Square Models (pGLS [40]) to the genetic parameters verifying whether GLMM had resulted in robust inferences and hence the pattern persisted when phylogenetic relationships were accounted for. pGLS is a comparative method
PLOS ONE | DOI:10.1371/journal.pone.0158660 July 29, 2016
6 / 24
Genetic Differentiation in Neotropical Plants
Table 1. Mean values of genetic diversity and differentiation in Neotropical plants per life-history trait (LHT) and ecological attribute, across all the studies included in the analyses, for nuclear molecular markers. N, number of species analyzed; FST, genetic differentiation among populations; HeS, overall population genetic diversity, He, genetic diversity within population; SD, standard deviation; n, sample size (number of species with available data in the regression analysis). Life-history trait and ecological attribute
N
Dominant FST ± SD(n)
Microsatellites FST ± SD(n)
Isozymes FST ± SD(n)
Dominant Isozymes HeS ± SD(n) HeS ± SD(n)
Microsatellites He ± SD(n)
Isozymes He ± SD(n)
Growth form
Epiphytes
17
0.177±0.023 (4)
0.307±0.239(7)
0.45±0.310 (2)
0.157±0.024 0.183±0.005 (4) (2)
-
-
Herbs
25
0.141±0.117 (6)
0.015±0.000(1)
0.28±0.000 (1)
0.520±0.255 0.056±0.000 (2) (1)
-
-
Palms
14
0.147±0.143 (7)
0.170±0.248(4)
0.08±0.070 (4)
0.552±0.286 0.385±0.044 (6) (4)
-
0.371±0.000 (1)
Shrubs
21
0.383±0.226 (5)
-
0.07±0.030 (4)
0.300±0.053 0.312±0.128 (3) (4)
-
0.141±0.000 (1)
0.220±0.189(29)
0.15±0.110 (20)
0.248±0.052 0.413±0.172 (2) (12)
0.752±0.131(7)
0.325±0.168 (2)
-
0.205±0.000 (1)
0.209±0.109 0.361±0.097 (5) (11)
-
0.256±0.163 (2)
0.248±0.052 (2)
-
-
0.683±0.134(4)
0.444±0.000 (1)
-
-
0.845±0.039(3)
-
Trees Dispersal mode
Pollination mode
Bats
2
-
-
Birds
34
0.217±0.219 (9)
0.311±0.291(7)
0.14±0.190 (10)
Hydrochory
7
0.073±0.064 (2)
0.453±0.057(5)
-
Mammals
60
0.198±0.138 (25)
0.171±0.152(14)
0.19±0.130 (11)
Mixed
3
0.062±0.000 (1)
-
0.12±0.000 (1)
Wind
72
0.222±0.160 (20)
0.159±0.168(15)
0.13±0.090 (9)
Bats
18
0.090±0.000 (1)
0.060±0.047(4)
0.17±0.070 (2)
-
0.806±0.000 (1)
0.627±0.119(2)
-
Beetles
2
-
0.239±0.000(1)
0.13±0.000 (1)
-
0.357±0.000 (1)
-
-
Flies
2
0.158±0.001 (2)
-
0.137±0.001 (2)
-
-
-
Hymenoptera
Mating system
-
-
0.530±0.258 0.515±0.210 (7) (4) -
0.443±0.000 (1)
0.374±0.285 0.241±0.160 (3) (7)
0.235±0.201(28)
0.13±0.110 (24)
0.419±0.259 0.360±0.117 (11) (17)
0.803±0.105(5)
0.290±0.141 (4)
Hummingbirds
18
0.082±0.101 (4)
0.068±0.075(2)
0.45±0.310 (2)
0.254±0.060 0.140±0.073 (2) (3)
-
-
Lepidoptera
14
0.139±0.030 (2)
0.340±0.244(6)
0.06±0.000 (1)
0.284±0.000 0.448±0.000 (1) (1)
-
-
Wind
4
0.020±0.000 (1)
-
0.28±0.000 (1)
0.700±0.000 (1)
-
-
Mixed
62
0.243±0.123 (19)
0.339±0.216(16)
0.33±0.150 (8)
0.281±0.179 0.294±0.182 (6) (6)
0.733±0.167(3)
-
124 0.195±0.179 (33)
0.152±0.157(25)
0.09±0.070 (21)
0.448±0.271 0.367±0.162 (10) (15)
0.767±0.122(4)
0.290±0.141 (4)
Dioecious
19
0.132±0.111 (5)
0.141±0.090(2)
0.09±0.060 (5)
0.622±0.000(1)
0.205±0.000 (1)
Monoecious
25
0.190±0.175 (11)
0.195±0.180(8)
0.03±0.020 (2)
0.552±0.286 0.389±0.000 (6) (1)
-
0.371±0.000 (1)
142 0.215±0.159 (41)
0.239±0.214(31)
0.18±0.150 (23)
0.278±0.159 0.334±0.191 (11) (16)
0.774±0.128(6)
0.292±0.214 (2)
Hermaphrodite Habitat
-
130 0.224±0.163 (47)
Outcrossing Breeding system
109 0.202±0.152 (35)
-
-
0.405±0.048 (5)
Deserts
3
-
0.015±0.000(1)
-
-
-
-
Grasslands
8
0.060±0.000 (3)
-
0.770±0.000 (3)
-
-
(Continued)
PLOS ONE | DOI:10.1371/journal.pone.0158660 July 29, 2016
7 / 24
Genetic Differentiation in Neotropical Plants
Table 1. (Continued) N
Dominant FST ± SD(n)
Microsatellites FST ± SD(n)
Mangroves
6
0.027±0.000 (1)
0.453±0.057(5)
Mixed
10
0.358±0.109 (7)
0.042±0.000(1)
0.23±0.12 (6)
Rainforests
71
0.120±0.140 (15)
0.163±0.136(18)
Rocky fields
8
0.559±0.000 (1)
0.650±0.000(2)
Rocky savannas
4
0.344±0.000 (1)
0.712±0.000(1)
Savannas
16
0.194±0.054 (10)
0.190±0.198(6)
0.17±0.09 (3)
Seasonally dry forests
57
0.228±0.181 (16)
0.118±0.051(7)
0.10±0.080 (9)
Wetlands
3
0.184±0.056 (3)
-
Narrow
71
0.177±0.177 (20)
0.277±0.277(12)
0.23±0.18 (12)
115 0.217±0.147 (37)
0.204±0.163(29)
0.11±0.090 (19)
Life-history trait and ecological attribute
Geographical range
Widespread
Isozymes FST ± SD(n)
Dominant Isozymes HeS ± SD(n) HeS ± SD(n)
Microsatellites He ± SD(n)
Isozymes He ± SD(n)
-
-
0.119±0.000 0.395±0.008 (1) (2)
0.856±0.000(1)
0.371±0.000 (1)
0.17±0.190 (11)
0.203±0.072 0.354±0.135 (5) (10)
0.739±0.165(2)
0.325±0.169 (2)
0.06±0.050 (2)
0.250±0.000 0.223±0.169 (1) (3)
-
-
-
-
0.296±0.000 0.581±0.317 (1) (2)
0.543±0.000(1)
-
0.500±0.180 0.332±0.139 (4) (6)
0.797±0.084(3)
0.141±0.000 (1)
-
-
0.535±0.273 0.272±0.149 (7) (7)
-
-
0.263±0.149 0.391±0.159 (10) (16)
0.752±0.131(7)
0.290±0.141 (4)
0.211±0.000 (1)
-
0.171±0.000 (1)
-
-
-
doi:10.1371/journal.pone.0158660.t001
in which the covariance among species resulting from the phylogeny is expressed in the regression error term. It is easily extended to multivariate data and can be used unambiguously when polytomies are found in the phylogeny as in our case. The analyses were carried out using the package caper [41] implemented in R version 3.2.1.
Results Data description Our survey retrieved 358 articles comprising studies from 186 species, belonging to 45 families and 116 genera (S4 Table). Tree species were the most studied in Neotropics (109 species, S2 Table), followed by herbs (25 species), shrubs (21), epiphytes (17) and palms (14). Wind- and mammal-dispersed species were the most studied (81 and 60 species, respectively) and only two studied species were bat-dispersed. Most studied species were pollinated by Hymenoptera (i.e. large and small bees and wasps, 130 species), followed by Lepidoptera (butterflies and moths, 14) and wind-, fly- and beetle-pollinated species were underrepresented in the studies performed so far in Neotropical plants (S2 Table). For breeding system, hermaphrodite plants were the most studied (142), followed by monoecious (25) and dioecious (19). For mating system, plants with an outcrossing system (124) were the most studied (S2 Table). Regarding the habitat and geographical range, most species studied up to now are widespread (115) across rainforests (71) and seasonally dry forests (57, S3 Table). The most used molecular marker (S4 Table) was nuclear microsatellites (61 species) followed by chloroplast sequences (51) and isozymes/allozymes (51). We found high mean values and variation of FST for all LHT and ecological attributes for both nuclear and chloroplast molecular markers (Table 1). However, plants from deserts and grasslands had low values of FST at nuclear genome and plants pollinated by flies had high FST at chloroplast genome. The surveyed data also showed high variation in genetic diversity for both nuclear and chloroplast genomes (Tables 1, 2 and 3).
PLOS ONE | DOI:10.1371/journal.pone.0158660 July 29, 2016
8 / 24
Genetic Differentiation in Neotropical Plants
Table 2. Mean values of genetic diversity and differentiation in Neotropical plants per life-history trait (LHT) and ecological attribute, across all the studies included in the analyses, for nuclear molecular markers. N, number of species analyzed; FIS, inbreeding coefficient; AR, allelic richness; h, haplotype diversity; π, nucleotide diversity; SD, standard deviation; n, sample size (number of species with available data in the regression analysis). Life-history trait and ecological attribute Growth form
Dispersal mode
Pollination mode
Mating system Breeding system
Habitat
Geographical range
N
Isozymes FIS ±
Microsatellites
Isozymes AR ±
Microsatellites
SD(n)
FIS ± SD(n)
SD(n)
AR ± SD(n)
h ± SD(n)
Nuclear sequences π ± SD(n)
Epiphytes
17
0.368±0.387(2)
0.101±0.091(10)
1.330±0.113(2)
5.243±2.695(6)
-
-
Herbs
25
0.127±0.000(1)
0.057±0.076(2)
-
3.060±0.000(1)
0.841±0.000(1)
0.005±0.000(3)
Palms
14
0.099±0.363(5)
0.229±0.152(3)
1.705±0.177(2)
2.350±0.000(1)
-
-
Shrubs
21
0.023±0.426(4)
0.125±0.000(1)
-
2.320±0.000(1)
0.764±0.050(2)
0.008±0.007(2)
Trees
109
0.021±0.145(21)
0.099±0.090(33)
1.659±0.541(7)
5.679±3.514(23)
0.894±0.050(6)
0.012±0.011(11)
Bats
2
0.240±0.000(1)
-
-
-
-
-
Birds
34
0.054±0.363(11)
0.148±0.126(7)
1.767±0.481(5)
4.973±3.021(5)
0.801±0.000(1)
0.008±0.006(2) 0.013±0.000(3)
Hydrochory
7
-
0.115±0.148(2)
-
1.680±0.000(2)
0.867±0.000(3)
Mammals
60
0.018±0.137(12)
0.097±0.083(18)
1.587±0.603(3)
6.240±4.242(11)
0.958±0.000(2)
0.010±0.010(5)
Mixed
3
0.133±0.000(1)
-
-
-
0.841±0.000(1)
0.006±0.000(1)
Wind
72
0.089±0.204(8)
0.100±0.095(22)
1.363±0.117(3)
5.210±2.493(14)
0.787±0.090(2)
0.010±0.015(5)
Bats
18
0.106±0.000(1)
0.094±0.086(10)
-
3.940±1.157(3)
-
0.004±0.003(2)
Beetles
2
0.017±0.000(1)
0.121±0.00(1)
-
14.330±0.000(1)
-
-
Flies
8
-
-
-
-
-
0.012±0.010(12)
Hymenoptera
130
0.066±0.210(25)
0.117±0.106(29)
1.669±0.473(9)
4.857±2.890(22)
0.880±0.058(7)
Hummingbirds
18
0.288±0.307(3)
0.064±0.087(2)
1.330±0.113(2)
10.590±0.000(1)
-
-
Lepidoptera
14
-0.251±0.305(3)
0.087±0.078(7)
-
5.241±3.013(5)
0.787±0.086(2)
0.002±0.001(2)
Wind
4
-
-
-
-
-
-
Mixed
62
0.163±0.249(7)
0.086±0.097(15)
1.757±0.608(5)
4.612±3.043(12)
0.874±0.085(6)
0.014±0.006(6)
Outcrossing
124
0.038±0.243(24)
0.115±0.095(34)
1.483±0.248(6)
5.723±3.423(20)
0.821±0.028(2)
0.008±0.011(9)
Dioecious
19
0.141±0.328(6)
0.154±0.217(3)
1.705±0.177(2)
4.178±2.146(2)
-
0.003±0.002(2)
Monoecious
25
0.013±0.126(3)
0.129±0.089(4)
1.240±0.085(2)
4.468±3.644(4)
0.958±0.000(2)
0.020±0.000(2)
Hermaphrodite
142
0.042±0.239(23)
0.100±0.087(41)
1.685±0.520(7)
5.522±3.363(26)
0.831±0.052(7)
0.009±0.010(12)
Deserts
3
0.057±0.080(3)
0.057±0.076(2)
-
3.060±0.000(1)
-
-
Grasslands
8
-
-
-
-
-
0.013±0.000(3)
Mangroves
6
0.115±0.150(3)
0.115±0.148(2)
-
1.680±0.000(2)
0.867±0.000(3)
Mixed
10
0.054±0.130(3)
0.162±0.117(2)
-
8.340±2.220(2)
-
-
Rainforests
71
0.088±0.210(17)
0.098±0.089(22)
1.579±0.388(7)
5.814±2.891(13)
0.958±0.000(1)
0.009±0.010(4)
Rocky fields
8
0.218±0.120(3)
0.175±0.093(2)
-
3.455±0.361(2)
-
-
Rocky savannas
4
-
-0.021±0.00(1)
-
1.800±0.00(1)
0.726±0.000(1)
0.003±0.00(1)
Savannas
16
0.106±0.090(2)
0.100±0.091(8)
-
6.578±5.482(5)
-
0.001±0.000(1)
Seasonally dry forests
57
0.053±0.160(8)
0.126±0.117(10)
1.658±0.598(4)
4.922±2.326(6)
0.862±0.067(4)
0.012±0.010(7)
Wetlands
3
-
-
-
-
-
-
Narrow
71
0.123±0.293(9)
0.083±0.095(15)
1.330±0.113(2)
3.761±1.881(10)
0.787±0.090(2)
0.003±0.007(2)
Widespread
115
0.033±0.223(24)
0.117±0.096(34)
1.669±0.473(9)
6.009±3.567(22)
0.880±0.060(7)
0.011±0.010(14)
doi:10.1371/journal.pone.0158660.t002
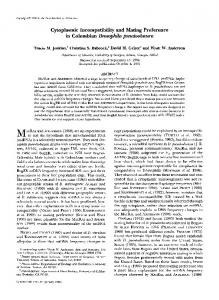
Genetic patterns General genetic patterns. Genetic differentiation among populations (FST) for nuclear microsatellite markers was significantly related to growth form, dispersal and pollination modes and breeding system (Fig 2, see also S5 Table). FST was significantly lower for trees and palms than for epiphytes, as well as lower for wind- and mammal-dispersed plants than for bird-dispersed (Fig 2A and 2B). In addition, FST values were significantly higher for plants pollinated by Hymenoptera and with monoecious and hermaphrodite breeding systems than for dioecious (Fig 2C and 2D, S5 Table). For chloroplast genome shrubs had higher FST than the other growth forms (S1 Fig, S6 Table).
PLOS ONE | DOI:10.1371/journal.pone.0158660 July 29, 2016
9 / 24
Genetic Differentiation in Neotropical Plants
Table 3. Mean values of genetic diversity and differentiation in Neotropical plants per life-history trait (LHT) and ecological attribute across all the studies included in the analyses, for chloroplast molecular markers. N, number of species analyzed; FST, genetic differentiation among populations; h, haplotype diversity; π, nucleotide diversity; SD, standard deviation; n, sample size (number of species with available data in the regression analysis). N
FST ± SD(n)
h ± SD(n)
Epiphytes
17
0.567±0.166(6)
0.589±0.066(2)
-
Herbs
25
0.710±0.326(7)
0.618±0.277(9)
0.001±0.0005(7)
Life-history trait and ecological attribute Growth form
Dispersal mode
Pollination mode
Mating system Breeding system
Habitat
Geographical range
π ± SD(n)
Palms
14
0.880±0.000(1)
0.786±0.000(1)
0.004±0.0000(1)
Shrubs
21
0.884±0.046(7)
0.603±0.248(4)
0.002±0.0020(3)
Trees
109
0.628±0.305(32)
0.452±0.333(5)
0.007±0.0150(24)
Bats
2
-
-
-
Birds
34
0.585±0.182(4)
0.535±0.116(2)
0.0019±0.0020(3)
Hydrochory
7
-
0.695±0.000(3)
0.005±0.0001(3)
Mammals
60
0.651±0.332(12)
0.867±0.114(2)
0.011±0.0220(10)
Mixed
3
-
-
-
Wind
72
0.686±0.279(37)
0.522±0.292(14)
0.003±0.0040(19)
Bats
18
0.530±0.389(6)
-
0.017±0.0320(5)
Beetles
2
-
-
-
Flies
8
-
-
-
Hymenoptera
130
0.805±0.227(31)
0.593±0.171(15)
0.001±0.0004(25)
Hummingbirds
18
0.670±0.297(8)
0.585±0.303(3)
0.004±0.0036(2)
Lepidoptera
14
0.642±0.138(8)
0.546±0.132(3)
0.005±0.0040(3)
Wind
4
-
-
-
Mixed
62
0.663±0.256(17)
0.656±0.166(7)
0.004±0.0010(7)
Outcrossing
124
0.669±0.297(31)
0.578±0.281(13)
0.006±0.0140(26)
Dioecious
19
0.610±0.382(2)
0.786±0.000(1)
0.006±0.0030(3)
Monoecious
25
0.680±0.286(8)
0.551±0.258(1)
0.0055±0.0130(1)
Hermaphrodite
142
0.634±0.284(43)
0.937±0.000(19)
0.004±0.0001(31)
Deserts
3
0.907±0.000(1)
0.095±0.000(1)
-
Grasslands
8
0.853±0.122(3)
0.673±0.164(5)
0.001±0.0005(5) 0.005±0.0001(3)
Mangroves
6
-
0.695±0.000(3)
Mixed
10
-
-
-
Rainforests
71
0.627±0.288(15)
0.528±0.356(4)
0.016±0.0330(5) 0.001±0.0006(2)
Rocky fields
8
0.663±0.092(3)
0.583±0.338(2)
Rocky savannas
4
0.399±0.403(2)
0.395±0.000(1)
0.004±0.0010(2)
Savannas
16
0.823±0.147(3)
0.947±0.000(1)
0.006±0.0030(3)
Seasonally dry forests
57
0.661±0.310(25)
0.416±0.286(3)
0.005±0.0040(14)
Wetlands
3
0.880±0.000(1)
0.786±0.000(1)
0.004±0.0000(1)
Narrow
71
0.673±0.283(21)
0.564±0.231(11)
0.002±0.00180(15)
Widespread
115
0.668±0.288(32)
0.600±0.306(10)
0.008±0.0160(20)
doi:10.1371/journal.pone.0158660.t003
Inbreeding coefficients (FIS) retrieved from isozymes were significantly higher for herbs than for the other growth forms (Fig 3A, S7 Table) and for plants inhabiting rocky fields than for plants from rainforests, mixed and SDTFs (Fig 3B, S7 Table). Plants inhabiting rainforests showed slightly higher genetic diversity overall populations (HeS, Fig 4A, S5 Table) for nuclear dominant markers. Furthermore, HeS values retrieved from nuclear microsatellite markers were higher in palms and trees than in epiphytes and shrubs, as well as in plants pollinated by Hymenoptera (Fig 5, S5 Table), while HeS retrieved from isozymes was not significantly related to any LHT or ecological attribute (S5 Table). Within population genetic diversity (He) was not significantly related to any LHT or ecological attribute studied (S6 Table), neither were haplotype (h) and nucleotide (π) diversities
PLOS ONE | DOI:10.1371/journal.pone.0158660 July 29, 2016
10 / 24
Genetic Differentiation in Neotropical Plants
Fig 2. Mean values and 95% confidence intervals in the posterior distribution of the GLMM and phylogenetic coefficients and standard errors of pGLS for FST for nuclear microsatellite markers. (a) Growth form. (b) Dispersal mode. (c) Pollination mode. (d) Breeding system. (e) Breeding system phylogenetic coefficients. (f) Mating system phylogenetic coefficients. (g) Habitat phylogenetic coefficients. Values highlighted by an asterisk are significant (* 0.05