There are numerous fac- tors that can have an impact on the popularity of multimedia ... advertisement, discussions in the social media or the partic- ipation of ...
POPULARITY INDEX THROUGH VIDEO SEMANTIC QUALITY ASSESSMENT Muhammad Shahid, Siamak Khatibi, and Yared Tuemay Blekinge Institute of Technology, SE-37179 Karlskrona, Sweden ABSTRACT Popularity of the streaming media content such as videos can be ascribed to the perceptual quality, to some extent, of the content. The traditional methods of audio/video quality assessment lack in provision of the input from higher cognitive of the human perception. Some studies have revealed that liking or disliking of a certain content can bias the human judgement towards video quality. In this paper, we have examined the impact of the use of semantic quality indicators namely audio content, audio quality, video content, and video quality in the assessment of quality of a video. Further, we have proposed a methodology to use these indicators for designing a prediction model for the popularity of streaming videos. Index Terms— Video Quality, Video Content, Semantic Quality 1. INTRODUCTION Video has become the major component of internet traffic and it’s percentage of usage is expected to rise even higher in the years to come [1]. One can access a variety of videos from the internet through many multimedia service providers. The popularity level of a certain video is a quantity of paramount importance for a service provider. There are numerous factors that can have an impact on the popularity of multimedia services. Such factors range from the external elements like advertisement, discussions in the social media or the participation of celebrities in the actual presented content as well as the perceptual quality of the media. The impact of the former type of factors such as advertisement, word of mouth (WOM) and rumors has been discussed in [2]. The presented model predicts popularity level of a particular movie in relation of its daily blog posts. Moreover, there are some other content-agnostic factors that are responsible for the popularity of some streaming videos. Videos uploaded by users with large networks, view count of the video and the online-age of a video are such examples [3]. For the assessment of perceptual quality of multimedia, subjective tests are performed. International Telecommunication Union (ITU) has standardized documents that offer recommendations on the methodologies of subjective testing for audio and video quality assessment. The subjective testing for audio and video quality evaluation using these methods mainly focuses on perceptual
quality and these methods have no explicit mechanism to assess the impact of content semantics towards user rating. In some cases, for example educational material streaming over the web [4], the importance of the content becomes comparable to the importance of the perceptual quality for the user satisfaction. Thus, the subjective tests that accomplish quality assessment of a multimedia signal only by focusing on the quality scales may lack in having input from the higher order cognitive processes of human perception. One of the hypotheses that explain the phenomenon of quality assessment biased by the content is given in [5]. According to this theory, critical evaluation of the degradations present in a video gets undermined while the user’s attention is focused on the storyline, plot and characters. The impact of the content on the user perception in relation to video quality assessment as described in [6] suggests a special subjective test in which the desirability of the video content was investigated. In this subjective test, a set of short length movie clips encoded at three coding rates was presented to 40 people to have their opinion on various aspects; including the content preference and the visual quality. The obtained results clearly highlighted that desirable content was rated significantly higher than the undesirable and neutral contents. So far, we have discussed three paradigms that can be associated to quality assessment of multimedia content with online availability. Firstly, the meta-content factors such as advertisement that can play a role towards its popularity. Secondly, the perceptual quality of audio and video services and lastly the impact of the content have been discussed to study their role towards the popularity of a service. In this article, we wish to investigate another aspect of the quality assessment that has been largely unexplored until now. Our idea is to use human computing for the extraction of semantics related features from a multimedia signal. We combine the perceptual quality with the semantics from content to explain the popularity of online video services. Out of all the traffic on the Internet, YouTube is reported to account for 20-35% as mentioned in [7]. Thus, YouTube is arguably the most popular online video streaming service in the world and we have performed our study using videos available on YouTube. In order to comprehend the user experience towards such services as YouTube, there can be different ways to look into the popularity statistics of the online videos. One contribution that deals with a data-driven analysis of the popularity of videos
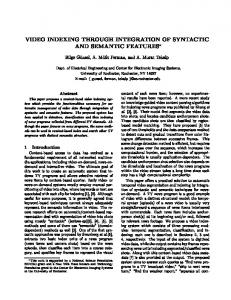
Automated Semantic Features Extraction
Multimedia Signal Subjective Assessment
Features: F1, F2, F3...
Features: F1, F2, F3...
Fig. 1: Extraction of semantic features using human computing (right) and mathematical modeling (left).
on YouTube and Daum is found in [8]. This analysis essentially deals with studying the popularity by investigating the distribution trends of the number of views. On a different dimension from just considering the count of the views of a video, we believe that a study based on the number of explicit Likes and Dislikes on a video is more relevant to probe popularity of online multimedia content. In this document, we have presented the results of our investigation of user’s ranking of a set of YouTube videos under the consideration of their popularity index (defined in the sequel). The rest of the paper is organized as described here. Section 2 presents a description of the research targets of this study. A description of the preparation of test set of videos and the subjective experiments of quality assessment has been provided in Section 3. Section 4 presents an analysis of the obtained user feedback. Some conclusive remarks and an outlook of the possible future work are given in Section 5. 2. RESEARCH TARGETS Semantic features that can impart ceratin kinds of information of the content in a multimedia signal can be extracted and used for the estimation of the popularity. For example, in the ScoreAHit model used for prediction of the popularity of a song [9], a variety of features such as the song duration, loudness, and danceability etc. are used. This popularity predictor has been trained using data of the hit songs from many years in the past. Whereas the resulted model is claimed to be correct in 60% of cases, it was also observed that the impact of different features varies from year to year and hence such model needs to be trained often for keeping it updated. We propose a subjective method of extracting semantic quality features from a multimedia signals in general and videos with audio tracks like YouTube videos in particular. We call these features as the video Semantic Quality Indicators (SQI) for a video. This human computing based extraction of the semantics features related to quality can be taken as an alternative of the computer based extraction, as indicated in Fig. 1. The main research target is to find a methodology that can estimate the popularity of a video on YouTube or any other user generated content (UGC) websites. Essentially, the goal is to generate a model that can build a relationship between
video semantic quality from user’s experience in a subjective test to the popularity index on YouTube. We define the popularity index (PI) as a ratio measure based on the total number of likes and dislikes given by the viewers. It is computed as: P I = x/(x + y). Where, the number of likes, represented by x, refers to the number of times a video has received thumbs up from the viewers and the number of dislikes, represented by y, refers to number of times a video has received thumbs down impression. The features (SQIs) considered as indicative of video semantic quality, in this work are subjective assessment on audio content, audio quality, video content, and video quality. A set of values of these four features would yield a prediction of the corresponding Popularity Index of videos. 3. TEST METHODOLOGY The test stimuli contains a variety of videos with audio tracks included and have been downloaded from YouTube. A variety in the content of test stimuli has been achieved by carefully selecting the videos that belong to various categories [10] including Education, Entertainment, and News & Reports. From these categories, fifteen of the first fifty highly viewed videos were selected and trimmed, to clips of less than one minute duration, with care to keep the sanctity of the message intact. Following are the YouTube video titles of the test data. • Education: 1. Rand Pausch last lecture: Achieving Your Childhood Dreams, 2. Sir Ken Robinson: Do schools kill creativity?, 3. The girl who silenced the world for 5 minutes, 4. Quantum Levitation, 5. RC/XD in Real Life!!! • Entertainment: 1. SIGNS, 2. The Black Hole, 3. Jeff Dunham - Achmed the Dead Terrorist, 4. LEAVE BRITNEY ALONE!, 5. T.I - Whatever You Like SPOOF! (OBAMA- whatever I Like). • News & Reports: 1. Leprechaun in Mobile, Alabama, 2. Clinton Kicks the Crap out of Fox News Part 2, 3. Matt Damon Rips Sarah Palin, 4. Dear Mr. Obama, 5. The Animal Odd Couple. Our aim has been to use the videos that have already been presented to public view where we can determine the viewers response as far as they are available online. One can associate it with a crowdsourcing based experiment of video quality [11]. Thus, unlike the standard lab setup recommendations such as BT.500 [12], we opted not to follow any standards for the display devices, room light and the distance between the viewer and the display monitor. This way, the viewers were free to choose any setting they would be pleased with. Nonetheless, the system used for displaying the videos was a high speed processor based computer with high definition display. Most of the subjects were students at the university and a special
4. ANALYSIS OF THE OBTAINED DATA This section deals with a description of the various aspects of the results obtained in our experiments. First, we present an overall view of the data to point out its validity that it can used for further analysis as shown in Section 4.1. Secondly, we observed an inconsistency from the subjects in ranking of a particular video in the two sessions. We call this inconsistency as gradient of ranking and it is discussed in Section 4.2. We show in Section 4.3 that there is a significant difference in the viewers ranking when the SQIs are used and not used. Finally, Section 4.4 presents the details on our proposed model for the prediction of popularity index of videos. 4.1. Ranking Distribution We estimated the probability density of the ranking values from the two setups based on a normal kernel function [13], the result is shown in Fig. 3. The figure shows that each ranking distribution has a normal distribution character which in 1 Thanks
to Subba Reddy for his assistance in the subjective tests.
0.6
0.35
Session 1 Session 2
Session 1 Session 2
0.3
0.5
0.25
0.4 0.2
0.3 0.15
0.2 0.1
0.1
0.05
0 −2
−1
0
1
2
3
4
5
6
7
8
0
0
1
(a) Setup-1
2
3
4
5
6
7
(b) Setup-2
Fig. 2: Ranking distribution for a video in Setup-1 (overall quality) and Setup-2 (Combined for the Four SQIs). 0.7 Audio Content Audio Quality Video Content Video Quality
Probbaility of Occurence
0.6
0.5
0.4
0.3
0.2
0.1
0
1
1.5
2
2.5 Gradient Degree
3
3.5
4
(a) Probability of Occurrence of a Gradient Degree for 4 SQIs. 0.7 Correlation with Gradient Degree of Overall Quality
care was taken to keep the ratio of males and female equal to make a total of 31 subjects1 . After briefing the subjects about the evaluation process verbally and in written form, a training session was conducted with dummy videos. The evaluation process has been automated through computer software with necessary buttons and accessories. The subjects were allowed to ask questions to make sure that the process was correctly understood. The test methodology adopted in this work consists of two setups, each used in two sessions. Each setup has the same set of videos but the subjective assessments were carried out in two different ways. For first setup, the given fives videos of each three categories were shown in an orderly fashion in the session one and then the fifteen videos were mixed randomly in the session two. By orderly, it is meant that videos were shown category wise one after the other and viewers were asked to give quality scores from 1-5 for the videos so that they can be arranged from top rated to the bottom in terms of the given quality score. In the random presentation of the videos, the videos from each category were mixed and viewers were asked again to give quality scores from 1-15 for the whole set. Afterwards, scores of the videos for each category were separated and arranged in the 1-5 order. Following this way in both of the sessions, no two videos within one category would have equal value of the score as the purpose of the assessment has been to rank them in an order of quality. In second setup the video presentation in the two sessions was the same as first setup. However unlike the first setup, viewers were asked to rank the videos in relation to four separated subjective assessments on audio content, audio quality, video content, and video quality. To assist with recollecting thoughts about a video, the viewers could see a representative image out of each video while ranking.
Audio Content Audio Quality Video Content Video Quality
0.6
0.5
0.4
0.3
0.2
0.1
0
1
1.5
2
2.5 Degree of Gradient
3
3.5
4
(b) Correlation Between Gradient Amplitudes in the Two Setups for 4 SQIs.
Fig. 3: Analysis of Gradient Methodology its turn indicates that we have an acceptable dynamic range of ranking values. Thus the number of subjects employed for our experiments and number of videos was enough and the obtained results can be used for further processing. Table 1: Computation of gradient amplitudes for various degrees. P1 P2 P3 P4 P5 g1 g2 g3 g4 Session 1 5 4 5 5 3 3 1 0 0 Session 2 5 5 4 3 2
4.2. Gradient of Ranking The subjects may rank a video differently in the two sessions which indicates the subject’s uncertainty. We called this dif-
Output ~= −0
Output ~= 0
0.4 0.2
0.2
0.4
0.6
0.8
Target
4.3. Significance of Semantic Quality Indicators By examining the results obtained in the two aforementioned test-setups presented in previous sections, we get some indications towards the importance of the features that we employed to describe the semantic quality of a video. If we assume a counter theory to our claims about the significance of these quality indicators, the gradient amplitudes obtained of our two setups should be be correlated. However, Fig. 3b depicts that it is actually not the case. Gradient amplitude of the overall quality has very low correlation with the gradients of the considered features and the highest value of correlation occurs in case of video quality. Nonetheless, the higher correlation in the case of video quality is just as one can expect though it is below 0.7 value and hence not significant. These observations lead us to use the gradient methodology as an indicative of popularity of YouTube videos. 4.4. Popularity Index Model In the following, we propose a model that can relate the gradient of ranking with the popularity index of videos on YouTube using a linear model. Following the same procedure as given in Table 1, the accumulated values for all videos have been computed using the four semantic quality indicators. The obtained data can be combined in a matrix form, similar to the
Output ~= 0.59*Target + 0.2
Test: R=0.76518 Data Fit Y=T
0.8 0.6 Output
ference in the ranking as gradient. The first (g1), second (g2), third (g3) and fourth (g4) gradient degree show a difference of the ranking of one, two, three and four respectively. The amplitude of a certain gradient for a video then is defined as the accumulation of occurrence of that certain gradient degree from all subjects. For example, table 1 shows these computations in a video assessment by five subjects. We denote the subject numbering by P. The gradient amplitude of g1 is three because there has been a difference of one in ranking between two sessions for three times. Similarly, the rest of the gradient amplitudes have been calculated. Following this method, gradient amplitudes for all the video sequences were computed for each of the SQIs using the rank values given by 31 subjects. The probability distribution of the gradients show the overall trend of the occurrence of the gradient values for the four SQIs as shown in 3a. One general observation is the exponential fall-off characteristics in the level of inconsistency with the increase of the degree of gradient. The level of inconsistency in ranking taken as gradient degree here is the key to comprehending the subjective behavior towards our assessment procedure. We understand that when a subject changes the rank value for a video between the two sessions, it should not be considered as a by chance happening. A small value of gradient can, sometimes, occur because a subject may not be able to recall the rank value given in the session one. We argue that a big change in ranking should occur only after a serious thought and it is not a by chance happening.
0.4 0.2 0 0
0.2
0.4 0.6 Target
0.8
Fig. 4: Prediction Regression.
following: X = {Xac , Xaq , Xvc , Xvq }
(1)
The short forms ’ac’ represents audio content, ’aq’ represents audio quality, ’vc’ represents video content and ’vq’ represents video quality. Moreover, these Xxx are composed of the four gradient amplitudes for each video. Xxx = {g1 , g2 , g3 , g4 }
(2)
Each of the gradient degree in equation 2 is a N × 1 vector of values for N videos. Finally, the columns in the normalized matrix for each SQI are summed separately (each Xxx is converted to xxx ) and we get a four column matrix for X. These vectors can be normalized by using the maximum value of gradient amplitude. The so obtained matrix contains four vectors corresponding to each indicator, denoted by xxx . Based on it, following is our proposed model of prediction of popularity index, with β0 , β1 , β2 , β3 , β4 as constants of regression. β0 + β1 × xac + β2 × xaq + β3 × xvc + β4 × xvq = P I (3) 5. DISCUSSION AND CONCLUSION We tested the prediction model using the available data as discussed before. It was found that the mean square error in the prediction goes down when more samples are used for test. Moreover, it has been observed that a non-linear model such as an artificial neural network with sigmoid functions in its hidden layer offers acceptable level of prediction accuracy. By using the test samples as 60% for training, 10% for validation and 30% for test, the result is shown in Fig. 4. A support vector based regression technique as used in [14] also proved the useability of our proposed method. Based on the obtained results, we claim that the performance of the proposed model would be robust with the increase in the training samples. Our future interests are to validate the proposed model using a larger set of test data with more categories of videos.
6. REFERENCES [1] Cisco Visual Networking Index, “Global mobile data traffic forecast update, 2012-2017,” Cisco white paper, 2013. [2] Akira Ishii, Hisashi Arakaki, Naoya Matsuda, Sanae Umemura, Tamiko Urushidani, Naoya Yamagata, and Narihiko Yoshida, “The hit phenomenon: a mathematical model of human dynamics interactions as a stochastic process,” New Journal of Physics, vol. 14, no. 6, pp. 063018, 2012. [3] Youmna Borghol, Sebastien Ardon, Niklas Carlsson, Derek Eager, and Anirban Mahanti, “The untold story of the clones: content-agnostic factors that impact youtube video popularity,” in Proceedings of the 18th ACM SIGKDD international conference on Knowledge discovery and data mining, 2012, pp. 1186–1194. [4] Gheorghita Ghinea and Sherry Y. Chen, “The impact of cognitive styles on perceptual distributed multimedia quality,” British Journal of Educational Technology, vol. 34, no. 4, pp. 393–406, 2003. [5] Francine V. Garlin and Robyn L. McGuiggan, “Sex,spies and celluloid: Movie content preference, choice and involvement,” Psychology and Marketing, vol. 19, no. 5, pp. 427–445, 2002. [6] Philip Kortum and Marc Sullivan, “The effect of content desirability on subjective video quality ratings,” Human Factors: The Journal of the Human Factors and Ergonomics Society, vol. 52, pp. 105–118, Feberuary. 2010. [7] Shaiful Alam Chowdhury and Dwight Makaroff, “Characterizing videos and users in youtube: A survey,” in Seventh International Conference on Broadband, Wireless Computing, Communication and Applications (BWCCA), 2012, pp. 244–251. [8] Meeyoung Cha, Haewoon Kwak, Pablo Rodriguez, YongYeol Ahn, and Sue Moon, “Analyzing the video popularity characteristics of large-scale user generated content systems,” IEEE/ACM Transactions on Networking, vol. 17, no. 5, pp. 1357–1370, 2009. [9] “The Hit Equation,” http://www.scoreahit.com/ TheHitEquation, [Online; accessed 04-November-2013]. [10] “YouTube Channel, Subscriber, & Video Statistics,” http:// vidstatsx.com, [Online; accessed 04-November-2013]. [11] Tobias Hofeld, Michael Seufert, Matthias Hirth, Thomas Zinner, Phuoc Tran-Gia, and Raimund Schatz, “Quantification of youtube qoe via crowdsourcing,” in Quality of ExperienceModeling, Evaluation, and Directions (MQoE), 2011, pp. 494– 499. [12] “Methodology for the subjective assessment of the quality of television pictures,” September 2009, ITU-R, Recommendation BT.500-12. [13] Adrian W. Bowman and Adelchi Azzalini, Applied Smoothing Techniques for Data Analysis, Oxford University Press, New York, 1997. [14] Muhammad Shahid, Andreas Rossholm, and Benny Lovstrom, “A no-reference machine learning based video quality predictor,” in Fifth International Workshop on Quality of Multimedia Experience (QoMEX), 2013, pp. 176–181.