Precise detection of memory leaks Jonas Maebe
Michiel Ronsse
Koen De Bosschere
Ghent University, ELIS Department Sint-Pietersnieuwstraat 41, 9000 Gent, Belgium jmaebe|ronsse|
[email protected] http://www.elis.UGent.be/diota
Abstract A memory leak occurs when a program allocates a block of memory, but does not release it after its last use. In case such a block is still referenced by one or more reachable pointers at the end of the execution, fixing the leak is often quite simple as long as it is known where the block was allocated. If, however, all references to the block are overwritten or lost during the program’s execution, only knowing the allocation site is not enough in most cases. This paper describes an approach based on dynamic instrumentation and garbage collection techniques, which enables us to also inform the user about where the last reference to a lost memory block was created and where it was lost, without the need for recompilation or relinking.
1
Introduction
A memory leak is a memory management problem which indicates a failure to release a previously allocated memory block. The term can be used in two contexts. The first is when indicating imperfections in garbage collectors as used in e.g. Java Virtual Machines, in case they missed the fact that a previously allocated block is not referenced anymore and thus is not added to the pool of free blocks. The second context is when the programmer himself is responsible for explicitly freeing all blocks of memory that he allocated. This is still the case in most run time environments today and also the situation which we will focus on in this paper. Leaking blocks of memory during a program execution has several negative consequences. It often results in said program acquiring more and more memory from the operating system during its execution. As such, overall system performance will degrade over time, as allocated but unused blocks of memory will have
to be swapped out once the system runs out of free physical memory. Eventually, a program may even exhaust its available virtual address space, which will cause it to terminate due to an out-of-memory error. Several packages that can perform memory leak detection already exist. The necessary instrumentation can happen at different levels. Insure++ [5] rewrites the source code of an application. Many leak detectors operate at the library level by intercepting calls to memory management routines, such as in case of LeakTracer [1], memdebug, memprof and the Boehm Garbage Collector [2]. Finally, it is possible to instrument at the machine code level. Purify [8] statically instruments the object code of an application and the libraries it uses. Dynamic instrumentors such as Valgrind [7] delay the instrumentation until run time. Except for Insure++, all of the mentioned debugging helpers only tell the programmer where the leaked block of memory was allocated, but not where it was lost. Insure++ does show where the last pointer to a block of memory was lost, but not where this pointer got its value. Additionally, since it is a source code instrumentation tool, it requires recompilation and cannot provide detailed information about leaks in third-party libraries of which the source code is unavailable. In this paper, we present a technique that uses dynamic instrumentation at the machine code level to track all pointers to allocated blocks of memory. It is completely language- and compiler-independent and can show where the leaked blocks were allocated, lost and where the last references to these blocks were created. In what follows, we first give a short overview of the instrumentation framework we use. Next, we discuss the kinds of memory leaks that exist and how they may occur. We then describe in great detail how we can detect these leaks, as well as some implementation details. Finally, we conclude after presenting a short evaluation and discussing our future plans.
2
Instrumentation overview
The inner workings of the instrumentation framework that we use, DIOTA (which stands for Dynamic Instrumentation, Optimization and Transformation of Applications), are explained extensively in [6]. The framework itself is quite generic, and specific instrumentation applications are realised through so-called backends. These are shared libraries that link to the DIOTA-framework and which specify how DIOTA should rewrite the code during the instrumentation. The techniques we will describe rely on only two features of DIOTA: the ability to intercept calls to dynamically linked routines and being notified of memory operations. The former enables us to track the memory allocations and deallocations performed by the program, the latter is used to track the pointers to the memory blocks as they are passed through the program.
3
Memory leaks
There are two kinds of memory leaks. ZeroFault Software [4] calls them logical and physical. A logical memory leak occurs when a block of memory is allocated and never freed afterwards, but at all times during the program execution a reachable pointer to this block of memory exists. A physical memory leak occurs when the last reachable pointer to a particular block of memory is lost. We mainly focus on physical memory leaks in this article, because finding out where exactly the last pointer to a block of memory is lost is crucial to fix such an error and this information is often hard to come by. The described techniques are however also applicable to solving logical memory leaks. In that case, at the end of the program our technique allows us to provide the developer with a list of references to all unfreed memory blocks, including the place where they were created. A physical memory leak can occur in three ways: • The last reference to a block of memory is overwritten with a new value, or some value is added to it. In the latter case, it is possible that the original value will be restored later by subtracting this same value again, so one should take this into account to avoid false positives. • The last reference to a block of memory goes out of scope. For example, it was stored in a local variable or a parameter and the function exits. • The block of memory containing the last reference to another block of memory is freed.
Note that the lost reference to a block of memory does not really have to be the last one for it to cause a physical memory leak. In case of cyclic structures, it is possible to be left with a group of blocks all referring each other, but no way to reach them anymore from global data pointers or local variables. In order to discover a physical memory leak, a way to track all pointers to a particular block of memory is required. In this sense, the problem is identical to the classic problem of garbage collection. One can therefore also choose from the wide variety of known algorithms to perform garbage collection in order to find memory leaks. There is however one important difference as far as finding physical memory leaks is concerned: one wants to know as exactly as possible where a block of memory was lost. Periodic garbage collection can only loosely pinpoint where the last reference to a block disappeared, and more exact techniques are required to improve accuracy. For this reason, we have chosen to use reference counting [9] as opposed to e.g. the more commonly used markand-sweep algorithm. Although this increases the overhead significantly and prevents us from detecting leaked cycles, we think that the added detailed information is worth it. Additionally, it is still possible to periodically perform a markand-sweep to detect leaked cycles.
4 4.1
Detection Memory blocks
In order to be able to track pointers to allocated memory blocks, one first has to know where those blocks are located. For this purpose, our DIOTA-backend intercepts all calls to malloc, calloc, realloc, free, new, delete and their variants. In case of allocations, the replacements call through to the original functions and then record their return values. This recording occurs in a hash table, with the blocks hashed on their start address. Since we only count the references to the start address of a block, this allows for enough flexibility as far as searching is concerned. The deallocation routines remove the block to be deallocated from this hash table before actually deallocating it. For each allocated block, quite a bit of information is recorded. First of all, the call stack at the time of allocation is stored. Next, we also give each allocated block a reference count, a unique identifier (called a block id), and a usecount. This last field keeps track of how many times a reference to said block has already been created and will allow us to detect stale references as explained in the next section.
block_info pool
block_info pool
block_info
reference_info a
block_info
address = 0x10 size = 0x20 id = 1 usecount = 1 refcount = 1 alloc_backtrace
address = 0xf4 block_id = 1 ref_backtrace
address = ? size = ? id = 2 usecount = ? refcount = ? alloc_backtrace
1
void *a
memory_block
= malloc(32);
2
block_info pool
reference_info a address = 0xf4 block_id = 1 ref_backtrace memory_block
free(b);
block_info address = ? size = ? id != 1 usecount = ? refcount = ? alloc_backtrace 3
reference_info a address = 0xf4 block_id = 1 ref_backtrace memory_block
b = NULL;
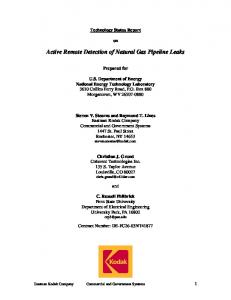
Figure 1. Reference and block bookkeeping
4.2
References
The second piece of the puzzle is keeping track of all references to these blocks of memory. For each reference we keep track of where it was created, its address, the memory block it refers to and the block id of the block when the reference was created. The information about these references is stored in structures residing in two trees, with one tree reserved for the references residing on the stack. A first reason to separate the stack items from the rest, is that measurements showed that many more references are created and removed on the stack than elsewhere, and at the same time the maximum number of references located on the stack at a single time is often a factor 1000 smaller than the maximum of references residing on the heap. It thus makes sense to keep the volatile but small group of references on the stack separate from the rest for performance reasons. Additionally, when the stack shrinks, we can keep removing the first item of the stack tree as long as this item’s address lies below the new stack pointer, simplifying stack shrinking management considerably. A final useful property of these trees is that when a memory region is copied (e.g. using memcpy), we can easily find all references lying inside this region in order to copy them as well, without having to scan the entire copied region or having to iterate over all recorded references. The bookkeeping of the references can be achieved by looking at the results of all store operations performed by the program. Load operations are largely irrelevant, as most of the time they only result in an extra reference when the value is stored back to memory. Register variables can be handled by looking at the contents of the registers when the reference count of a block drops to zero. When a value equal to the start address of an allocated block is stored, we increase the reference count of said block. When a previously recorded reference is overwritten with a different value, the reference count of the block it referred to is decreased again. After a block has been freed however, all of its references
become stale. There are two ways to solve the problem of stale references: one is to find (or keep track of) and remove all those references, another is to make sure the staleness can be detected the next time this reference is accessed. We use the latter technique to avoid the extra associated with the former. The staleness detection is implemented using the unique identifier that each block possesses: as mentioned before, creating a reference to a block results in the current block id of that block to be copied to the reference’s information structure. When a memory block is freed, its block id is set to the next available unique value. As such, when we afterwards encounter a stale reference to this block, we can immediately notice this due to the fact that the block ids do not match. This technique also allows us to immediately make a structure containing the information about a memory block available for reuse (through a dedicated pool of such structures) when its corresponding block is freed. Even though there may be stale references to such a block and thus this structure, the unique identifier makes sure this can be detected reliably when the referencing occurs. Figure 1 shows an example of how this works in practice. First, the program allocates a block of memory. After calling the real malloc, we allocate a memory block info structure from the previously mentioned dedicated pool and fill in the appropriate values. The fact that this info block is then stored in a hashtable, is not shown here. Still in statement 1, the program stores the pointer to this block in the variable a. At this point, we create a new reference info structure. The pointer to the memory block info structure is a pointer in the programming language sense: it is simply the address of this structure. The block is freed again in statement 2. As shown, the memory block information structure is freed at the same time, but the reference information structures are left intact. The block id of the memory block is increased though. When the program afterwards overwrites a with a new value, possibly after new blocks have been allocated, the situation will be as shown for statement 3. The memory
block_info
reference_info
block_info
leak_info
address = 0x10 size = 0x20 id = 1 usecount = 1 refcount = 1 alloc_backtrace
address = 0xf4 block_id = 1 ref_backtrace
address = 0x10 size = 0x20 id = 1 usecount = 1 refcount = 0 alloc_backtrace
blk_id = 1 blk_usecnt = 1 alloc_backtrace ref_backtrace lose_backtrace memory_block
1
void *a
memory_block
= malloc(32);
2
a += 2*sizeof(void*);
block_info
leak_info
block_info
leak_info
address = 0x10 size = 0x20 id = 2 usecount = 1 refcount = 0 alloc_backtrace
blk_id = 1 blk_usecnt = 1 alloc_backtrace ref_backtrace lose_backtrace
address = ? size = ? id != 1 usecount = ? refcount = ? alloc_backtrace
blk_id = 1 blk_usecnt = 1 alloc_backtrace ref_backtrace lose_backtrace
3
memory_block
free(a-2*sizeof(void*));
memory_block
4 (leak removed because id memory block has changed)
Figure 2. Example of detecting a false positive block information structure may either be free or in use for another memory block that has been allocated in the mean time, but we can detect the fact that the reference originally pointed to another memory block by comparing the block id’s.
4.3
Leaks
Finally, there are the memory leaks. When the reference count of a block of memory reaches zero, a new potential leak is created. The are called potential leaks because there may still be a reference to the possibly leaked block in a register, or it could be that a new reference will be calculated by the program later on (e.g. by substracting a value from a pointer that currently points to somewhere in the middle of that block). Such a potential leak contains the call stacks of where it occurred, where the last reference, which was just lost, was created and where the leaked block was allocated. All potential leaks are stored in a hash table, with the hash based on the recorded call stacks mentioned above. Apart from that data, we also record the cause of the leak (as explained in section 3) and the current block id and usecount of the memory block at the time the leak occurred. Finally, leaks also have an occurrence count. Two potential leaks are deemed identical if their causes and their three recorded call stacks match. In such a case, the previously stored potential leak in the hash table is verified to see whether the block it refers to is still leaked.
This verification occurs at two levels. First of all, if the block id recorded in the potential leak is different from the current one of the memory block, it means the block has been freed since we detected the potential leak, so it was a false positive. The second verification is based on discrepancies between the usecount values of the potential leak and the memory block. If these values differ, a new reference has been created to the supposedly leaked block since the original leak detection. As such, this block can not have been leaked at that moment in time. If both tests pass, the previously recorded leak is deemed to be permanent. The occurrence count of the leak is increased, and the the stored block id and usecount are replaced by those of the newly detected leak. A demonstration of detecting a false positive based on a change of block id is shown in figure 2. Like in the previous figure, in statement 1 a memory block is allocated and the resulting pointer is stored in variable a. The result is that an info structure for the memory block and the reference are created, with the latter referring to the former. In statement 2, we add a constant to a. When the value of a in memory is changed, we detect that the new pointer no longer refers to the start of the memory block, so we decrease the reference count of the previous block it pointed to. Since that one is now zero, we create a new potential leak. This leak gets a copy of the creation backtrace of the reference we just overwrote, the allocation site of the mem-
ory block and the current backtrace (i.e., the place where the leak was detected). We also copy the current block id and usecount values of the memory block and keep a pointer to the information about the memory block for future checking. In statement 3, the block is freed. Consequently the block id of the memory block info is increased. The potential leak remains untouched. Note that if the parameters are passed via the stack, the usecount of the block will also be increased, since by passing the parameter a new reference to the block is created. When we later on check whether the previously created potential leak was a real leak, we can see it was not due to the fact the block ids will differ between the memory block info and the leak info (as well as the usecount, possibly).
4.4
Reporting
Every time memory is allocated, we check whether 5 minutes have passed since the last time we wrote out all collected leaks. If so, then we process all collected potential leaks, write out the ones we deem to be real leaks (using the same verification based on block ids and usecounts described in the previous section) and reset the hash table containing them. This procedure is also carried out when the program exits. We only do this checking at allocation time, since if the program is not allocating any new memory, any leaks that may have happened are not going to have much influence on the program’s operation. We also do not lose any information by delaying the reporting of the leaks. We have not yet implemented the reporting of the remaining references to logically leaked memory blocks at the end of the program. It could be easily done by iterating over all still existing references though, preferably grouping them per leaked memory block. An example of a report (in verbose mode) of a detected leak can be seen in figure 3
5
False positives, false negatives
A very important aspect of detecting memory leaks, is dealing with false positives and false negatives. In case of a real garbage collection system, one cannot afford to incur the former, as it would result in memory corruption. In our case, the consequences are not as catastrophic, but if there are too much false positives, the output becomes useless to the user. We use the system of the potential leaks to avoid most false positives. The majority of those result from functions which return the last reference to a block of memory in a register. Once the stack shrinks, the last reference is then often removed, resulting in a potential leak. When the result
of this function is stored back to memory, the usecount of the memory block is increased, so the false positive will be recognised and not reported. Another way to deal with this, would be to scan the contents of the registers whenever a leak due to stack shrinking occurs, but that has not yet been implemented. Another kind of false positive can occur since we only track references to the start of a memory block. In practice, we only experienced this in the case of C++ code, where in some cases constructors return a pointer to sizeof(void*) bytes past the start of the allocated block. We compensated for this by treating such pointers also as references to blocks. After this adaption, we did not encounter any further reported false positives due to pointers not pointing to the start of a block. Permanent false positives can occur due to not handling cases which seldom happen, such as overwriting part of a pointer, or writing a pointer byte per byte to memory. Adding support for these cases can be done at the expense of a larger slowdown. False negatives can occur when a value is stored to memory that happens to have the same value as the start of an allocated memory block, but which is not actually used in the program as such. In case this is a loop counter, the reference count will immediately be decreased again in its next iteration. If it is random data, e.g. copied from a mapped file, a physical leak may never be detected using the reference counting method. The same goes for leaked cyclic structures. However, since we keep track of all allocated memory blocks, we can still report them as logical memory leaks when the program exits. Additionally, we can also provide a list of all sites where the remaining references were created.
6
Related work
As mentioned in the introduction, several memory debuggers which support memory leak detection already exist. Most simply provide replacement functions for malloc, free and friends and report, when the program exits, which blocks have not been deallocated. This very low overhead technique is used by Valgrind, Leaktracer, memdebug and memprof and is therefore useful to try first. Insure++ performs full instrumentation of the available source code and can therefore also track where exactly the last reference to a block of memory is lost in case of physical memory leaks, at least if this occurs within a part of the program for which source code is available. It does not provide any extra information regarding logical memory leaks. Another interesting case is the well known Boehm garbage collector [2]. It includes a mode in which it functions as a memory leak detector instead of as a garbage collector. However, as it relies on periodic scanning of the
*** Warning, freed block containing last reference to a block of memory (reference at 0x88a937c, block at 0x88a9388, ip = 0x8048497, 1 occurrence(s)) in thread 0 at: [0x08048497]: test_linked_list, /user/jmaebe/diota/test/mem8.c:54 53: // make a->next no longer reachable 54: free(a); 55: } [0x08048642]: main, /user/jmaebe/diota/test/mem8.c:120 119: testje2(&a); 120: test_linked_list(); 121: // test multiple leaks at the same location [0x0039176b]: __libc_start_main+235, /lib/tls/libc.so.6 The last reference to [0x0804848e]: 50: 51: 52: [0x08048642]: 119: 120: 121: [0x0039176b]:
that block we know of was created at 0x804848e: test_linked_list, /user/jmaebe/diota/test/mem8.c:51 a=malloc(sizeof(record_t)); a->next=malloc(sizeof(record_t)); main, /user/jmaebe/diota/test/mem8.c:120 testje2(&a); test_linked_list(); // test multiple leaks at the same location __libc_start_main+235, /lib/tls/libc.so.6
This block was allocated at 0x8048486: [0x08048486]: test_linked_list, /user/jmaebe/diota/test/mem8.c:51 50: a=malloc(sizeof(record_t)); 51: a->next=malloc(sizeof(record_t)); 52: [0x08048642]: main, /user/jmaebe/diota/test/mem8.c:120 119: testje2(&a); 120: test_linked_list(); 121: // test multiple leaks at the same location [0x0039176b]: __libc_start_main+235, /lib/tls/libc.so.6 Figure 3. Example of verbosely reported memory leak ... 1
5
10
enode* result = new_enode(polynomial, exp+1, pos+1/*from 1 to m*/); for(int i=0;iarr[i].d); value_clear(result->arr[i].x.n); result->arr[i] = translate_one_term(parameter_names, left_over_var_names, new_terms); }
... Figure 4. Bug found in FPT using our technique
address space of a program using a variant of the mark-andsweep algorithm, it can only discover that a pointer got lost somewhere between two garbage collections.
or modify operation, and add the ability for a backend to specify on a per-instruction (type) basis whether it wants to be called or not.
7
9
Evaluation
We evaluated our techniques by analysing a few known free software programs (lynx and vim, which turned out not to contain any recurring memory leaks), as well as locally adapted versions of the SimpleScalar simulator and the Fortran Parallel Transformer (FPT) [3]. The slowdown factor lies between 200 and 300 times, which is obviously very significant. The amount of required memory more or less doubles compared to the original execution. Both SimpleScalar and FPT were known to contain memory leaks from testing with other tools, but without the exact location of the actual leaking, fixing them proved to be very hard. An example from FPT is shown in figure 4. Originally, the d and x.n fields in lines 6 and 7 were long int’s. Afterwards, they were changed into whole numbers with infinite precision from the GNU Multiprecision Library GMP. Before overwriting such values, one has to call the value clear() macro to free previously allocated memory. While adding such calls throughout 50000+ lines of C++ code, the two that are now at lines 6 and 7 were forgotten. Our tool pinpointed what is now line 8 in the fragment above as the place where the last reference to a block of memory was overwritten.
8
Future plans
One of our main goals currently is to reduce the overhead of our backend. It has already become more than a factor 10 faster since the start of this project, and we are confident we can reduce it a lot more. One way is to adapt DIOTA so that the backend can better control when exactly it wants its callbacks to be called. Currently, the backend’s callback is called before each memory access (either load, modify or store). This means that when a store is reported, the new value is not yet written to memory. As such, we have to log this event and only when the next memory operation occurs, the result of the previous store can be examined. Another issue is detecting when the stack shrinks. At the moment, every time a memory access occurs, we check whether the stack has shrunk and whether consequently some references went out of scope. A much better way would be to insert these checks only after instructions that can increase the stack pointer (given a downward growing stack). We therefore intend to add a mode to DIOTA whereby a backend’s callbacks will only be called right after a write
Conclusion
In this paper, we described how precise memory leak detector can be performed using the reference counting technique. We described implementation details and the problems of false positives and false negatives. We showed in our evaluation that although the current slowdown is quite big, the results provided by the technique help significantly with finding the root cause of memory leaks. We intend to speed up the implementation and technique in the future.
10
Acknowledgements
Jonas Maebe is supported by a grant from the Institute for the Promotion of Innovation by Science and Technology in Flanders (IWT). This research was also funded by Ghent University and by the Fund for Scientific Research-Flanders (FWO-Flanders). The authors also wish to thank Kristof Beyls for providing ideas, testing consecutive implementations and his invaluable feedback throughout this process.
References [1] E. S. Andreasen. Leaktracer. http://www.andreasen.org/LeakTracer/. [2] H. Boehm. Dynamic memory allocation and garbage collection. In Computers in Physics, volume 9, pages 297–303, May 1995. [3] E. D’Hollander, F. Zhang, and Q. Wang. The fortran parallel transformer and its programming environment. Journal of Information Science, 106:293–317, 7 1998. [4] T. Z. Group. Zerofault. http://www.zerofault.com. [5] Insure++. http://www.parasoft.com/. [6] J. Maebe, M. Ronsse, and K. D. Bosschere. DIOTA: Dynamic Instrumentation, Optimization and Transformation of Applications. In Compendium of Workshops and Tutorials, Held in conjunction with PACT’02: International Conference on Parallel Architectures and Compilation Techniques, Charlottesville, Virginia, USA, Sept. 2002. [7] N. Nethercote and J. Seward. Valgrind: A program supervision framework. In O. Sokolsky and M. Viswanathan, editors, Electronic Notes in Theoretical Computer Science, volume 89. Elsevier, 2003. [8] E. R. Rs. Purify: Fast detection of memory leaks and access errors. http://citeseer.nj.nec.com/291378.html. [9] P. R. Wilson. Uniprocessor garbage collection techniques. In Proc. Int. Workshop on Memory Management, number 637, Saint-Malo (France), 1992. Springer-Verlag.