provement in predictability. AUTHOR KEYWORDS. Adaptive interfaces, predictability, accuracy, user study. ACM Classification Keywords. H5.2 Information ...
CHI 2008 Proceedings · Adaptation
April 5-10, 2008 · Florence, Italy
Predictability and Accuracy in Adaptive User Interfaces Krzysztof Z. Gajos1, Katherine Everitt1, Desney S. Tan2, Mary Czerwinski2, Daniel S. Weld1 1 2 University of Washington Microsoft Research Seattle, WA 98195 One Microsoft Way, Redmond, WA 98052 {kgajos,everitt,weld}@cs.washington.edu {desney,marycz}@cs.washington.edu ABSTRACT
While proponents of adaptive user interfaces tout potential performance gains, critics argue that adaptation's unpredictability may disorient users, causing more harm than good. We present a study that examines the relative effects of predictability and accuracy on the usability of adaptive UIs. Our results show that increasing predictability and accuracy led to strongly improved satisfaction. Increasing accuracy also resulted in improved performance and higher utilization of the adaptive interface. Contrary to our expectations, improvement in accuracy had a stronger effect on performance, utilization and some satisfaction ratings than the improvement in predictability. AUTHOR KEYWORDS
Adaptive interfaces, predictability, accuracy, user study ACM Classification Keywords
H5.2 Information Interfaces and Presentation: User Interfaces – Interactions Styles, Evaluation/Methodology INTRODUCTION
Despite considerable debate, automatic adaptation of user interfaces (UIs) remains a contentious area. Proponents of machine learning-directed adaptation (e.g., [1,5]) argue that it offers the potential to optimize interactions for a user’s tasks and style. Critics (e.g., [2,10]), on the other hand, maintain that the inherent unpredictability of adaptive interfaces may disorient the user, causing more harm than good. Fortunately, recent studies have presented suggestions for which properties of adaptive UIs increase user confusion and which improve satisfaction and performance [3,4,11]. But the design space for adaptive UIs is large, with a multitude of characteristics that may determine an adaptive interface’s success or failure. The tradeoffs between many of these characteristics are still poorly understood. In this paper we explore the relative effects of predictability and accuracy on the usability of adaptive interfaces. We say that an adaptive algorithm is predictable if it follows a Permission to make digital or hard copies of all or part of this work for personal or classroom use is granted without fee provided that copies are not made or distributed for profit or commercial advantage and that copies bear this notice and the full citation on the first page. To copy otherwise, or republish, to post on servers or to redistribute to lists, requires prior specific permission and/or a fee. CHI 2008, April 5–10, 2008, Florence, Italy. Copyright 2008 ACM 978-1-60558-011-1/08/04…$5.00
strategy users can easily model in their heads. We use the term accuracy to refer to the percentage of time that the necessary UI elements are contained in the adaptive area (see Task section). We focus on these properties because they reflect a common design trade-off in adaptive UIs: whether to use a simple, easily-understood strategy to promote functionality, or whether to rely on a potentially more accurate but also more opaque machine learning approach. We present a study showing that increased accuracy significantly improved both performance and adaptive interface utilization. Furthermore, both predictability and accuracy significantly increased participants’ satisfaction. Contrary to our expectations, we found that in our particular design, increasing the adaptive algorithm’s accuracy had more beneficial effects on the participants’ satisfaction, performance and utilization of the adaptive interface than did improved predictability. Our results suggest that machinelearning algorithms deserve further consideration in the context of adaptive UIs, because the benefits of a large improvement in accuracy may outweigh the disadvantages of decreased predictability. EXPERIMENT Hypotheses
Building on previous research, we hypothesized: (1) the higher the accuracy of the adaptive algorithm, the better the task performance, utilization and the satisfaction ratings; (2) the more predictable the adaptive algorithm, the better the task performance, utilization and the satisfaction ratings; (3) increased predictability would have a greater effect on satisfaction and utilization than increased accuracy. We formulated this last hypothesis based on the design heuristic asserting that successful user interfaces should be easy to learn [6]. Participants
Twenty-three volunteers (10 female) aged 21 to 44 (M=35 years) participated in this study. All participants had normal vision, moderate to high experience using computers and were intermediate to expert users of Microsoft Office-style applications, as indicated through a simple screener. Participants were given a software gratuity for their time. Task
In order to explore the effects of accuracy and predictability, we used a generalization of the Split Menu concept [8], which [4] termed a split interface. In a split interface, func-
1271
CHI 2008 Proceedings · Adaptation
April 5-10, 2008 · Florence, Italy
eight MRU buttons in the toolbar. Postexperimental interviews confirmed that our participants easily formed a mental model of this MRU policy. Hence, the study was a 2 (accuracy: 50% or 70%) × 2 (predictability: High (most recently used) or Low (random)) factorial design. We predetermined the sequence of buttons that had to be pressed in all conditions as well as the contents of the adaptive toolbar in the random condition to ensure the desired level of accuracy.
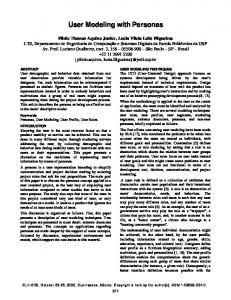
Figure 1. Task Setup.
tionality (e.g., buttons) that is predicted to be immediately useful is copied to an adaptive area (clearly designated as hosting changing content). This allows the user to either follow their familiar route or potentially save time by exploiting the adaptation. We used a carefully controlled performance task that allowed us to eliminate complications associated with more complex tasks. Our task and procedures are modeled on those used in [4]’s second experiment. In the study, we showed participants a picture of a target UI button, which they had to find and click within the interface. They could use either the traditional (static) toolbars and menus or the adaptive toolbar if the button was displayed upon it. We used a modified Microsoft Word interface, where several toolbars were placed toward the left and the center of the toolbar area (Figure 1). Some of the toolbar buttons revealed popup menus, in which additional functions were located. In the center of the screen was a panel that displayed the target button as well as a “Next” button, which participants used to proceed through the study. We only asked participants to find buttons originating in popup menus, which were one level deep. The adaptive toolbar, whose contents changed during the experiment, was located in the upper right so that it was far enough from the closest, relevant, non-adaptive button (>20° visual angle). This ensured that it required an explicit change of gaze to discover if a helpful adaptation had taken place. Eight buttons were always shown in the adaptive toolbar, and no more than one button was replaced per interaction. Participants clicked on 60 target buttons in each task set. We considered the first 10 clicks to be a “ramp-up” time and did not include performance metrics for these clicks in our analysis.
After familiarizing themselves with the task and completing a practice set using a non-adaptive interface, participants performed four counterbalanced task sets, one for each of the four conditions. Participants filled out a brief satisfaction survey after each task set, and an additional survey and an exit interview following the last session. Participants took 2.5 to 5 minutes per task set, and the whole study took less than an hour. Equipment
We ran participants in pairs on two 2.8 GHz Pentium 4 Compaq PCs with 2G of RAM, each with a Compaq keyboard and an optical mouse. Each computer had two NEC 18″ color LCD displays but only one display per computer was actively used by the participants. Participants did not interact with each other. Measures
We collected overall task times as well as the median times to acquire individual buttons (i.e., the time from selecting the “Next Button” to clicking on the indicated target), distinguishing times for buttons in their original locations from those located on the adaptive toolbar. We also measured the adaptive toolbar utilization levels, or the number of times that the participant selected the requested UI element from the adaptive toolbar divided by the number of times that the requested element was present on the adaptive toolbar. Additionally, we collected the subjective accuracy of the adaptive algorithm, and participant satisfaction ratings (on a 7point Likert scale). Finally, we asked a random subset of participants to perform an extra set of tasks following the main experiment; here we used an eye-tracker to determine which strategies our participants employed. Performance considerations prevented us from using the eye tracker during the main part of the experiment.
Design and Procedure
Our study considered two accuracy levels: 50% and 70%. Because it is difficult to implicitly measure predictability, and measuring it explicitly might influence user performance [7], we considered two extreme cases. In the unpredictable condition, updates to the adaptive toolbar were entirely random – a worst-case simulation of a complex algorithm’s inscrutability. In the predictable condition, we chose a most recently used (MRU) strategy, placing the
Results
We analyzed all continuous measures using a 2 (50% or 70% accuracy) × 2 (High vs. Low predictability) repeated measures analysis of variance (RM-ANOVA). For the analysis, we took the logarithm of all timing data - standard practice to control for non-normal distributions found in such data. Because we cannot justify any assumptions about
1272
CHI 2008 Proceedings · Adaptation
Useful
199
177
3.36 4.77 3.73 4.77
Satisfaction ratings
Predictable 2.41 3.00 3.82 4.43 Knew†
1.95 2.64 3.24 4.24
177 *
186
188
71% 86% *
79% 78%
significant?
significant?
197
Predictable
176
Averaged over predictability settings Random
196
69% 89% 73% 84%
70%
Duration Utilization
Averaged over accuracy settings
50%
Random, 50% Random, 70% Predictable, 50% Predictable, 70%
Individual conditions
April 5-10, 2008 · Florence, Italy
3.55 4.77 *
4.07 4.25
3.11 3.71
2.70 4.12 *
2.60 3.44
2.30 3.74 *
Frustrating 4.23 2.55 3.50 2.73
3.86 2.64 *
3.39 3.11
Confusing 4.14 3.36 3.24 2.95
3.69 3.16
3.75 3.09
Satisfied
3.86 4.64 4.41 5.05
4.14 4.84
4.25 4.73
In Control
3.19 4.27 4.41 5.05
3.80 4.66 *
3.73 4.73 *
This further analysis showed that participants’ feeling of being in control increased both with improved predictability (χ21,N=87=11.69, p