localization tool outputs many ranked lists where buggy files appear very ... of IR-based bug localization tools by proposing a prediction framework that is ...... [22] H. Seo and S. Kim, âPredicting recurring crash stacks,â in Proceedings of the 27th ... [36] X. Xie, T. Y. Chen, F.-C. Kuo, and B. Xu, âA theoretical analysis of the risk ...
Predicting Effectiveness of IR-Based Bug Localization Techniques Tien-Duy B. Le, Ferdian Thung, and David Lo School of Information Systems Singapore Management University, Singapore {btdle.2012,ferdiant.2013,davidlo}@smu.edu.sg
Abstract—Recently, many information retrieval (IR) based bug localization approaches have been proposed in the literature. These approaches use information retrieval techniques to process a textual bug report and a collection of source code files to find buggy files. They output a ranked list of files sorted by their likelihood to contain the bug. Recent approaches can achieve reasonable accuracy, however, even a state-of-the-art bug localization tool outputs many ranked lists where buggy files appear very low in the lists. This potentially causes developers to distrust bug localization tools. Parnin and Orso recently conduct a user study and highlight that developers do not find an automated debugging tool useful if they do not find the root cause of a bug early in a ranked list. To address this problem, we build an oracle that can automatically predict whether a ranked list produced by an IRbased bug localization tool is likely to be effective or not. We consider a ranked list to be effective if a buggy file appears in the top-N position of the list. If a ranked list is unlikely to be effective, developers do not need to waste time in checking the recommended files one by one. In such cases, it is better for developers to use traditional debugging methods or request for further information to localize bugs. To build this oracle, our approach extracts features that can be divided into four categories: score features, textual features, topic model features, and metadata features. We build a separate prediction model for each category, and combine them to create a composite prediction model which is used as the oracle. We name our proposed approach APRILE, which stands for Automated PRediction of IR-based Bug Localization’s Effectiveness. We have evaluated APRILE to predict the effectiveness of three state-of-the-art IRbased bug localization tools on more than three thousands bug reports from AspectJ, Eclipse, and SWT. APRILE can achieve an average precision, recall, and F-measure of at least 70.36%, 66.94%, and 68.03%, respectively. Furthermore, APRILE outperforms a baseline approach by 84.48%, 17.74%, and 31.56% for the AspectJ, Eclipse, and SWT bug reports, respectively.
I. I NTRODUCTION In software development, bugs are prevalent. Thus, debugging is an important task to maintain software quality. However, debugging is an expensive task as it requires much time and manual labor to find root causes of bugs and correctly fix them. In 2002, software bugs are reported to cost US economy more than 50 billion dollars annually [27]. Therefore, there are demands to develop tools which make debugging less costly. To reduce debugging cost, several techniques have been proposed to support developers in locating the root cause of bugs. One family of techniques is referred to as information retrieval (IR) based bug localization techniques [21], [32], [39]. An IR-
based bug localization technique takes as input a textual bug report and a collection of source code files. It outputs a ranked list of files sorted by their suspiciousness scores which are computed by considering the textual similarity of the files to the input bug report. This ranked list of files is then forwarded to developers for manual inspection. Developers can inspect the files one-by-one starting from the most suspicious to the least suspicious ones. If an IR-based bug localization tool is effective, developers should be able to find a buggy file by inspecting just a few files at the top of the ranked list. Unfortunately, even for state-ofthe-art bug localization tools, e.g., [21], [32], [39], for many bug reports, buggy files are located far from the beginning of the ranked lists. Recently, Parnin and Orso conducted a user study on an automatic debugging tool, and find that developers do not find an automatic debugging tool useful if they cannot find the root cause of a bug early in a ranked list [18]. These ineffective cases can make developers lose confidence in bug localization tools. In this work, we mitigate the impact of the unreliability of IR-based bug localization tools by proposing a prediction framework that is able to compute the likelihood whether an output of a bug localization tool is effective or not. We consider the output of a bug localization tool as effective if a buggy file is among the top-N files. With the help of our approach, developers can decide whether they want to use the output of a bug localization tool or not. If the output of a bug localization tool is unlikely to be effective, developers are better off to use traditional debugging methods to find the bug. To predict the effectiveness of a bug localization instance, i.e., the application of a bug localization tool on a bug report, we extract important features from the input bug report and the suspiciousness scores that are output by the bug localization tool. The set of extracted features can be divided into four categories: features extracted from suspiciousness scores, features extracted from words that appear in the textual contents of a bug report, features extracted from topic models learned from the textual contents of a bug report, and features extracted from the metadata of a bug report. For each feature category subset, we learn a separate prediction model from a training dataset using a machine learning technique (i.e., Support Vector Machine (SVM)). A prediction model outputs a score given a bug localization instance indicating the likelihood that the instance is effective. From the resultant four models, one
for each feature category, we create a final prediction model which combines the four models by computing a weighted sum of their prediction scores. The weights are tuned to maximize the prediction result on the training dataset. Then, we use the final prediction model to predict the effectiveness of bug localization instances whose effectiveness are unknown. We name our approach APRILE (Automated PRediction of IR-based Bug Localization’s Effectiveness), and evaluate its performance to predict the effectiveness of state-of-the-art bug localization techniques (i.e., BugLocator [39], BLUiR [21], and AmaLgam [32]) which are applied on a dataset of 3,459 bugs from AspectJ, Eclipse, and SWT. These bugs were used to evaluate state-of-the-art IR-based bug localization tools [1]. Our experimental results show that APRILE can achieve an average precision, recall, and F-measure of at least 70.36%, 66.94%, and 68.03%, respectively. Our approach also outperforms a baseline based on the approach proposed by Le and Lo [13] by 84.88%, 17.74%, and 31.56% for AspectJ, Eclipse, and SWT bugs, respectively. Le and Lo proposed an approach that predicts the effectiveness of a spectrum-based bug localization tool, e.g., Tarantula [10]. Spectrum-based bug localization tools analyze execution traces rather than bug reports. We adapt their approach to predict the effectiveness of an IR-based bug localization tool and use it as the baseline. The contributions of our work are as follows: 1) We propose a comprehensive list of features extracted from an input bug report and suspiciousness scores. Our features are divided into four categories: score, text, topic model, and metadata features. 2) We propose a framework that utilizes all feature categories to predict the effectiveness of an IR-based bug localization tool. For each feature category, we create a separate prediction model. We then construct a final model which combines the four prediction models. 3) We evaluate our approach to predict the effectiveness of three bug localization tools applied on 3,459 bug reports from three software projects. The empirical results show that APRILE achieves an average precision, recall, and F-measure of at least 70.36%, 66.94%, and 68.03%, respectively. We organize the remainder of our paper as follows. In Section II, we discuss background information on IR-based bug localization, Support Vector Machine (SVM), and topic modeling. Next, we present our approach in Section III. Section IV describes our experiment settings and results. We discuss related work in Section V. Finally, we conclude and present future work in Section VI. II. BACKGROUND In this section, we discuss some background materials. We first introduce IR-based bug localization. Next, we describe Support Vector Machine (SVM) which is a popular classification algorithm that we use to build prediction models. Finally, we present a topic modeling algorithm that we use to extract features.
A. IR-based Bug Localization An IR-based bug localization approach takes as input a textual bug report and a collection of program source code files. Its output is a ranked list of files sorted by their likelihood to be a buggy file that needs to be fixed to resolve the bug report. This ranked list is then manually inspected from the beginning until the buggy files are identified. Recently, many IR-based bug localization tools have been proposed [21], [32], [39]. The main idea behind an IR-based bug localization tool is that a bug report and buggy files are likely to share common words. Also, if a program file has higher textual similarity to the bug report than other files, it is more likely to contain the bug. By deploying text retrieval models, IR-based bug localization tools calculate similarity scores between a bug report and program files. Next, program files are sorted in descending order of their textual similarity scores, and forwarded to developers for manual investigation. IR-based bug localization first extracts text that appear in summary and description fields of bug reports. It also extracts comments and identifiers that appear in source code files. Each bug report and source code file can then be represented by a textual document. Next these documents are input to a text preprocessing procedure which consists of three main steps: text normalization, stopword removal, and stemming. These steps are described below: • Text Normalization: In this step, special symbols and punctuation marks are removed from a document. Next, the document is split into its constituent words. If a word is an identifier in a source code file, it is again split into smaller words following the Camel casing convention (e.g., “processFile” is split into “process” and “file”). • Stopword Removal: In this step, English stopwords are removed from the normalized document. These stopwords frequently appear in many documents and do not help much in differentiating one document from another. We use the list of stopwords obtained from [2]. • Stemming: In this step, words are transformed to their root forms. For example, “localized”, “localization”, “localize”, and “locally” are all simplified to “local”. We use the Porter Stemming algorithm [19], which is a popular stemming algorithm, to perform this step. After the above steps are performed, the document representing a bug report is then compared to documents representing source code files using various text retrieval models. These text retrieval models assign weights to words in the documents and, based on common words and their weights, compute similarity of one document and another. The details of the text retrieval model differ for different bug localization techniques. The state-of-the-art approaches are BugLocator proposed by Zhou et al. [39], BLUiR proposed by Saha et al. [21], and AmaLgam proposed by Wang et al. [32]. B. Support Vector Machine Support Vector Machine (SVM) is a popular classification algorithm that has been been shown effective for many kinds of problems [8]. It represents data instances as points in a
Section III-A. Then, we describe two main processes in our framework in Sections III-B & III-C. A. Overall Framework
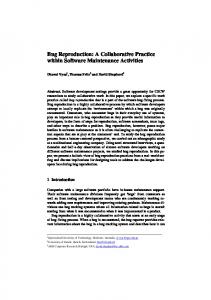
Fig. 1. Overall framework
multi-dimensional space where each feature is a dimension. It then separates data instances from different classes by finding a multi-dimensional hyperplane that best separates them. This hyperplane is often called the maximum marginal hyperplane (MMH). The underlying function (i.e., kernel) that defines the plane itself can be customized. The commonly used one is the linear kernel. In this work, we use SVM with linear kernel to build prediction models and consider a bug localization instance as a point in the multi-dimensional space. SVM is used to find the plane that separates effective bug localization instances from ineffective ones. C. Topic Modeling Topic modeling is a technique to discover latent topics in a collection of documents. These latent topics are inferred based on the occurrences of words in the documents. One of the most popular topic modeling techniques is Latent Dirichlet Allocation (LDA) [5]. LDA posits that each document is a mixture of topics and each word in the document is associated to a topic. Given a document, LDA generates its topic distribution, which corresponds to the probability of each topic to be assigned to the document. In this paper, we use LDA to infer the topic distribution of a bug report. III. P ROPOSED A PPROACH In this section, we describe technical aspects of our proposed approach. First, we present the overall framework in
Figure 1 shows the overall framework of our approach. There are two phases: training phase and deployment phase. The purpose of the training phase is to learn a model that is capable of differentiating effective bug localization instances from ineffective ones. Using the learned model, the deployment phase predicts whether other bug localization instances are likely to be effective or not. In the following paragraphs, we discuss the details of these two phases: a) Training phase: This phase takes as input a set of training bug localization instances whose effectiveness labels are known. Each instance in the training set corresponds to a bug and comes with the following information: 1) A bug report that describes the bug. 2) Suspiciousness scores that are assigned to source code files by an IR-based bug localization tool. 3) Effectiveness label (i.e., “effective” or “ineffective”). In the training phase, there are two main processes: feature extraction and model learning. In the feature extraction process, we identify and extract some important characteristics (aka. features) from each bug localization instance. Next, we use these extracted features to train a model that is capable of differentiating effective bug localization instances from ineffective ones. This model model is used in the deployment phase. b) Deployment phase: In this phase, our framework accepts bug localization instances whose effectiveness are unknown. Similar to the training phase, our framework extracts features from each bug localization instance. Based on the extracted features, the prediction model learned in the training phase will predict the effectiveness of a bug localization instance. B. Feature Extraction In this section, we list features that we extract from a bug localization instance. These include features that we extract from suspiciousness scores produced by a bug localization tool (score features), features that we extract from words that appear in textual contents of an input bug report (text features), features that we extract from topic distributions of the bug report (topic model features), and features that we extract from metadata of the bug report (metadata features). The following sub-sections describe these features one by one. 1) Score Features: Table I shows a list of features that we extract from the suspiciousness scores. A bug localization tool outputs a suspiciousness score for every source code file. In the table, features R1 to R20 are the suspiciousness scores of the top-20 files in a ranked list. If the suspiciousness scores of top ranked files are relatively low, then the instance is likely to be ineffective. The next five features, SS1 to SS5 , are simple statistics of the top-20 suspiciousness scores.
TABLE I L IST OF SCORE FEATURES ID
Description Raw Scores (20 features) R1 Highest suspiciousness score R2 Second highest suspiciousness score Ri ith highest suspiciousness score (3 ≤ i ≤ 20) Simple Statistics of Raw Scores (5 features) SS1 Mean of {R1 , . . . , R20 } SS2 Median of {R1 , . . . , R20 } SS3 Mode of {R1 , . . . , R20 } SS4 Variance of {R1 , . . . , R20 } SS5 Standard deviation of {R1 , . . . , R20 } Gaps (21 features) G1 R1 − R2 G2 R2 − R3 Gi Ri − Ri+1 (3 ≤ i < 20) Gmin Min of {G1 , . . . , G19 } Gmax Max of {G1 , . . . , G19 } Relative Differences (18 feature) RD1
R2 −R20 R1 −R20
RD2
R3 −R20 R1 −R20
RDi
Ri+1 −R20 R1 −R20
(3 ≤ i ≤ 18)
Next, features G1 to G19 , Gmin , and Gmax capture absolute differences between two consecutive suspiciousness scores. If the difference between two consecutive scores are large, the corresponding two files are very different from each other. An effective bug localization instance should be able to separate buggy files from other files. Finally, the last 18 features, RD1 to RD18 , capture how diverse the values of R1 to R20 are. The suspiciousness scores of top-ranked files corresponding to an effective bug localization instance are likely to be diverse. If all files are given the same suspiciousness score, then the bug localization instance will be ineffective. TABLE II L IST OF TEXT FEATURES ID TRACE
Fw
Description One, if there is a stack trace in the summary or description fields of a bug report. Zero, otherwise. Number of times word w occurs in the summary and description fields of a bug report.
2) Text Features: We extract text from the summary and description fields of a bug report, and use them as text features of a bug localization instance. Table II shows a list of features that we extract from the textual contents of a bug report. The first feature in our list (TRACE) has a boolean value. Its value is 1 if the summary or description field of a bug report contains a stack trace. Otherwise, its value is 0. A program stack trace usually contains clues leading to a buggy file as it contains names of relevant program files (e.g., “at org.aspectj.EclipseFactory.fromBinding(EclipseFactory.java:202)”). Hence, the existence of a program stack trace can help an IR-based bug localization tool to effectively localize bugs. Furthermore, we consider
each word in a bug report as a feature, and its value is the number of times the word appears in the bug report. Before selecting words from bug reports as features, we perform text preprocessing that is described in Section II-A. TABLE III L IST OF TOPIC MODEL FEATURES . Mk IS A TOPIC MODEL WITH THE NUMBER OF TOPICS SET TO k (k ∈ {5, 10, 15}). ID TM1k TM2k TMik TS1k TS2k TS3k TS4k TS1avg
Description Raw Topic Probabilities Probability of the 1st topic appearing in Mk Probability of the 2nd topic appearing in Mk Probability of the ith topic (3 ≤ i ≤ k) appearing in Mk Simple Statistics of Topic Probabilities in Mk Max of {TM1k , . . . , TMik } Median of {TM1k , . . . , TMik } Variance of {TM1k , . . . , TMik } Standard deviation of {TM1k , . . . , TMik } (TS15 + TS110 + TS115 )/3
3) Topic Model Features: We apply Latent Dirichlet Allocation (LDA) [5] to extract these features from bug reports. LDA takes as input a parameter k which is the number of topics. The output of applying LDA is a topic-model that contains the following information: 1) k topics, where each topic is a distribution of words. 2) Probability of topic t to occur in bug report br. 3) Topic assigned to word w in bug report br. Each time LDA is applied, it creates a topic model Mk where k is the number of topics. For our approach, we apply LDA with k ∈ {5, 10, 15} to infer three topic model M5 , M10 , M15 . Then, we capture interesting features from the three topic modes. Table III lists features that we extract from these models. For each topic model Mk (k ∈ {5, 10, 15}), we use the topic probabilities of a bug report as the features of the corresponding bug localization instance. Each topic is an abstraction of a set of words. The set of topics inferred by a topic modeling technique based on the number of topics setting k represents the level of abstraction. The higher the value of k is, the lower the abstraction level is. By using multiple topic models with various k values, we capture information from many different abstraction levels in order to maximize the chance to differentiate bug reports corresponding to effective bug localization instances from other reports that lead to ineffective instances. In addition to the raw topic probabilities, we also compute simple statistics of these probabilities as features. 4) Metadata Features: In addition to summary and description fields, bug reports have other fields.. These fields provide basic information such as report date, severity, priority, etc. We refer to this information as metadata of bug reports. Table IV shows a list of metadata features that we are interested in. In total, there are 14 metadata features. Among the features, features MT1 and MT2 capture the importance of the reported bug, features MT3 to MT7 capture the context
TABLE IV L IST OF METADATA FEATURES ID MT1 MT2 MT3 MT4 MT5 MT6 MT7 MT8 MT9 MT10 MT11 MT12 MT13 MT14
Description Importance of a Bug Priority Severity Context of a Bug Product Component Software version Hardware platform (e.g., PC etc.) Operating system platform (e.g., XP, Linux etc.) Quality of a Bug Report Name of reporter Number of bug reports the reporter has submitted so far at time of the current bug report. Number of persons in CC list when the bug report is first submitted. Total number of attachments in the bug report Number of attachments that are applications Number of attachments that are texts Number of attachments that are images
where the bug is observed, and features MT8 to MT14 capture factors that might impact the quality of bug reports such as the experience of the reporter, the number of attachments, etc. We utilize features extracted from bug report metadata to maximize the chance to capture distinctive characteristics of bug reports that correspond to effective bug localization instances. C. Effectiveness Prediction Model Our final prediction model contains four internal components which analyze score, text, topic model, and metadata features. Each component consists of a prediction model that specializes in a particular feature category . For example, score component only analyzes the score features, text component only analyzes in the text features, and so on. In the training phase, we use the Support Vector Machine (SVM) algorithm to train the prediction model of each component. SVM algorithm takes as input features of training bug localization instances whose effectiveness are known and learns a prediction model. A prediction model can process features of a bug localization instance and output a prediction score of that instance. The prediction score indicates how likely a bug localization instance is effective. If the score is greater than a threshold, then the corresponding instance is predicted as effective by that prediction model. Otherwise, it is predicted as ineffective. We linearly combine scores generated by the prediction models of the four internal components together to obtain the final score (i.e., APRILE score) as follows:
1 2 3 4 5 6 7 8 9 10 11 12 13 14 15 16 17 18
APRILE(p) = α × SVMScore (p) + β × SVMText (p) +γ × SVMTopic (p) + δ × SVMMeta (p)
the prediction scores output by the score, text, topic model, and metadata components, respectively. Each of the component has a weight in range of [0, 1] and their sum equals to 1. We also define a threshold for APRILE to differentiate prediction scores of effective and ineffective instances. We denote the threshold as ω. If APRILE(p) > ω, then p is an effective instance. Otherwise, p is ineffective. We need to tune values of α, β, γ, δ and ω. We tune these values such that the performance of APRILE is maximized on the training data. We measure the performance of APRILE in terms of F-measure (see Section IV-A). We try different weight combinations by varying the value of each weight from 0 to 1, in a step of 0.025, with a constraint that the four weights will add up to 1. Implementation-wise, we pick the values of α, β, and γ; if their total weight is less than 1, we set the value of δ such that the summation of the four weights is equal to 1. Next, we follow Equation 1 to calculate APRILE scores of bug localization instances . Then, we call procedure tuneOmega to tune the threshold ω such that the F-measure is maximized. We select the weight combination of α, β, γ, δ and ω that results in the best F-measure. Next, we describe procedure tuneOmega. The procedure takes as input a set of bug localization instances, and their effectiveness labels. tuneOmega first sorts bug localization instances in ascending order of their APRILE scores (line 1). Next, tuneOmega calculates F-measures for two base cases. The first case is when all instances are predicted as effective (line 3). The second case is when all instances are predicted as ineffective (line 5). From lines 11 to 17, tuneOmega iterates through various ω values by taking the average of the APRILE scores of two consecutive instances in the sorted list. The ω value which results in the highest F-measure is selected and returned.
(1)
(α, β,γ, δ ∈ [0, 1] ∧ α + β + γ + δ = 1) In the above equation, p is an input bug localization instance, APRILE(p) is the combined prediction score for p, SVMScore (p), SVMText (p), SVMTopic (p), and SVMMeta (p) are
Input: D: Training set of IR-based bug localization instances L: Effectiveness labels of instances in D Output: Pair of best ω and best F-measure Sort instances in D in ascending order of their APRILE’s scores. ω1 ← AP RILE(D[1]) − 10−3 Fm1 ← F-measure when effectiveness threshold is ω1 ω2 ← AP RILE(D[D.length]) + 10−3 Fm2 ← F-measure when effectiveness threshold is ω2 if Fm1 > Fm2 then Fmbest ← Fm1 , ωbest ← ω1 else Fmbest ← Fm2 , ωbest ← ω2 end for k ← 1 to D.length − 1 do ω ← (AP RILE(D[k]) + AP RILE(D[k + 1]))/2 Fmtemp ← F-measure when effectiveness threshold is ω if Fmtemp > Fmbest then Fmbest ← Fmtemp , ωbest ← ω end end return (ωbest , F mbest )
Procedure tuneOmega In the deployment phase, we apply the learned final prediction model to predict the effectiveness of bug localization instances whose effectiveness are unknown. Given an input instance p, we calculate AP RILE(p) (see Equation 1) by using
TABLE V DATASET S UMMARY: T HIRD COLUMN (#B UGS ) IS THE NUMBER OF BUG REPORTS . L AST COLUMN (#F ILES ) IS THE NUMBER OF SOURCE CODE FILES . Project AspectJ Eclipse (3.1) SWT (3.1)
Study Period Jul 2002 - Oct 2006 Oct 2004 - Mar 2011 Oct 2004 - Apr 2011
#Bugs 286 3075 98
#Files 6485 12863 6485
prediction models SVMScore , SVMText , SVMTopic , SVMMeta , and weights α, β, γ, δ, which are learned in the training phase. Then, we compare AP RILE(p) with threshold ω, which is also learned in the training phase, and output the predicted effectiveness label of p (i.e., “effective”, or “ineffective”). IV. E XPERIMENTAL E VALUATION In this section, we first describe our dataset and experiment settings. Next, we describe the research questions and our experiment results that answer these questions. We finally describe the threats to validity. A. Dataset and Experiment Settings Dataset. We conduct experiments using three sets of bug reports from AspectJ, Eclipse, and SWT which contain a total of more than three thousands bug reports. The details of our dataset are shown in Table V. Effectiveness Criterion. We consider a bug localization instance effective if a buggy file can be found in the top-N position in the ranked list. In our experiments, the default value of N is 1. Evaluation Metrics. We use precision, recall, and Fmeasure [8] to evaluate the performance of our proposed approach. We use four statistics to calculate precision and recall. These statistics are true positives (TP), false positives (FP), true negatives (TN), and false negatives (FN). The following are their definitions: TP: FP: TN: FN:
Number of effective bug localization instances that are predicted correctly. Number of ineffective bug localization instances that are predicted incorrectly. Number of ineffective bug localization instances that are predicted correctly. Number of effective bug localization instances that are predicted incorrectly
Using the above statistics, we compute precision, recall, and F-measure as follows: TP TP + FP TP Recall = TP + FN 2 × P recision × Recall F-measure = P recision + Recall
P recision =
In the above equations, precision is the proportion of true positives among the IR-based bug localization instances that are predicted as effective. Recall is the proportion of true positives among the IR-based bug localization instances that are effective. Both precision and recall reflect the performance of a prediction model. Usually, there is an inverse relationship between precision and recall where higher precision might result in lower recall (and vice versa). Hence, F-measure, which is the harmonic mean of precision and recall, is usually used as a summary measure which informs whether a gain in precision (recall) outweighs a decrease in recall (precision). Cross-Validation. We perform a ten-fold cross-validation to evaluate the performance of our approach. Cross-validation is a standard method to assess accuracy of prediction models [8]. It evaluates whether the result of a prediction model generalizes to an independent test dataset. In ten-fold cross-validation, for each project, we randomly partition its bug reports into 10 distinct subgroups of data. Subsequently, we learn a prediction model on nine subgroups, and test the prediction model on the remaining subgroup. We repeat the process 10 times by using each of the 10 subgroups as test data. Finally, we aggregate all outputs from the ten repetitions, and calculate the final precision, recall, and F-measure. B. Research Questions We analyze several research questions (RQs) to evaluate the performance of our proposed approach. These RQs are presented in the following paragraphs. RQ 1: How good is the performance of our approach when predicting the effectiveness of an IR-based bug localization tool? Answer to this research question will shed light on the utility of our approach. To answer this research question, we use APRILE to predict the effectiveness of BugLocator [39] to locate buggy files. For each bug report in our dataset, we predict if the ranked list produced by BugLocator is effective or not. RQ 2: How good is our approach compared to another effectiveness prediction approach? Recently, Le and Lo propose an approach to predict the effectiveness of a spectrum-based bug localization tool [13]. A spectrum-based bug localization tool analyzes a set of failed and correct execution traces and computes suspiciousness scores of program elements (e.g., statements). Program elements are then ranked based on their scores and the resultant ranked list is output for manual inspection. Le and Lo’s approach uses features extracted from program execution traces and suspiciousness scores. In IR-based bug localization setting, there is no execution traces; thus we can only run Le and Lo’s approach on features that are extracted from suspiciousness scores of files. We use this approach as a baseline to compare APRILE with. We denote this baseline as SVMExt Score .
RQ 3: What are the contributions of each feature category (i.e., score, text, topic model, and metadata) to the overall performance of our approach? Our proposed approach contains four components which process four different feature categories (i.e., score, text, topic model, and metadata). These components are combined together by assigning weights to each of them. To investigate the contributions of the four feature categories, we report the averages of the weights that are assigned to these components across the ten-fold cross-validation iterations. RQ 4: Which of the proposed features best discriminate effective IR-based bug localization instances from ineffective ones? We investigate which features from our list are helpful in predicting effective IR-based bug localization instances. In machine learning, Fisher score are usually used to estimate how much discriminative features are. The Fisher score of a feature is calculated as follows P#class (class) xj −x ¯j )2 class=1 (¯ F S(j) = P#class P (class) (class) 2 nclass 1 −x ¯j ) ) class=1 ( nclass −1 i=1 (xi,j (2) In the above equation, F S(j) is the Fisher score of the j th feature, nclass is the number of data points (i.e., number of bug localization instances) with label class (i.e., effective or ineffective), x ¯j is the average value of the j th feature over (class) all data points, x ¯j is the average value of the j th feature over all data points with label class. If a feature has a Fisher score of zero, then that feature does not help to discriminate effective IR-based bug localization instances from ineffective ones. On the other hand, a feature is very discriminative if its Fisher score is much greater than zero. In this research question, we investigate the most discriminative features from each feature category for every software project (i.e., AspectJ, Eclipse, and SWT). RQ 5: What is the effect of changing the effectiveness criterion on the performance of our approach? By default, a bug localization instance is deemed effective if a buggy file exists in the top-N positions of the ranked list, where N = 1. This corresponds to the case when a developer is willing to inspect only the first recommended program file. However, developers might be willing to inspect more files. In this research question, we vary the effectiveness criterion by considering N = 5 and N = 10. For each of these effectiveness criteria, we evaluate the performance of our approach. RQ 6: Is our approach applicable to predict the effectiveness of various state-of-the-art IR-based based bug localization tools? There are a number of IR-based bug localization tools that have been proposed in the literature. In this research question, we investigate the performance of our approach in predicting
the effectiveness of two other state-of-the-art bug localization tools: BLUiR [21] and AmaLgam [32]. C. Results 1) RQ 1: Overall Performance.: Table VI shows the statistics of effective and ineffective bug localization instances when BugLocator is applied on the 3,459 bug reports in our dataset. From the table, effective instances account for 22.73%, 31.67%, and 35.71% of all AspectJ, Eclipse, and SWT instances, respectively. Considering all three datasets, there are 1,074 effective instances which are 31.05% of the total number instances. Table VII shows the performance of our approach in predicting effective and ineffective instances. Our approach achieves an F-measure of 71.67%, 62.97%, and 69.44% for AspectJ, Eclipse, and SWT respectively. For Eclipse, our approach is able to correctly predict 716 out of 974 effective instances, and 1,517 out of 2,101 ineffective instances. Similarly, for AspectJ there are 43 out of 65 effective instances, and 209 out of 221 ineffective instances that are correctly predicted by our approach. For SWT, our approach can correctly identify 25 out of 35 effective instances, and 51 out of 63 ineffective instances. Overall, our approach is able to discover most effective and ineffective instances correctly. Averaging across the three datasets, the precision, recall, and F-measure of our approach are 70.36%, 66.94%, and 68.03% respectively, which are comparable to or better than the results achieved by other software analytics studies [13], [22], [23], [31]. TABLE VI N UMBER OF EFFECTIVE AND INEFFECTIVE B UG L OCATOR INSTANCES Project AspectJ Eclipse SWT Total
#Effective 65 974 35 1074
#Ineffective 221 2101 63 2385
TABLE VII OVERALL PERFORMANCE ON PREDICTING B UG L OCATOR ’ S EFFECTIVENESS
Project AspectJ Eclipse SWT Average
Precision 66.15% 73.51% 71.43% 70.36%
Recall 78.18% 55.08% 67.57% 66.94%
F-measure 71.67% 62.97% 69.44% 68.03%
2) RQ 2: APRILEvs. Baseline: We compare our approach with SVMExt Score proposed by Le et al. [13]. We apply both approaches to predict the effectiveness of BugLocator instances. Table VIII shows the precision, recall, and F-measure of SVMExt Score and our approach. For all of the projects (i.e., AspectJ, Eclipse, and SWT), our approach achieves better F-measure. In term of relative improvement, our approach outperforms the baseline by 84.48%, 17.74%, and 31.56% for AspectJ, Eclipse, and SWT, respectively.
show better knowledge and familiarity of reporters on a certain kind of bugs. Consequently, these reporters tend to submit better written bug reports that help bug localization tools perform more effectively. Hence, values of MT10 help our prediction model to differentiate bug reports of effective bug localization instances from the other ones. There are other features that are important in 2 out of 3 projects. They are MT3 , MT8 , and MT14 . MT3 captures information of the product where the bug is observed. This feature helps the prediction model to identify which parts of the software project are likely to lead to effective bug localization instances. MT8 , and MT14 are two features related to quality of bug reports. If a bug is reported by an experienced reporter, the bug is likely to be well described. Furthermore, there are cases where reporters attach screenshots to bug reports and put less effort in writing symptoms of the bugs explained by the screenshots. Since a bug localization approach only analyzes text and not images, they tend to perform poorly for such bug reports.
TABLE VIII F- MEASURE : SVMExt Score VS . OUR APPROACH Project AspectJ Eclipse SWT
SVMExt Score 38.85% 53.48% 52.78%
Our Approach 70.67% 62.97% 69.44%
Improvement 84.48% 17.74% 31.56%
3) RQ 3: Contributions of Each Feature Category: Table IX shows our findings. We find that the contribution of each feature category varies from project to project. For AspectJ, score features have the largest contribution, but for Eclipse and SWT, topic model features contribute the most. Across the three projects, the contribution of the metadata features are smaller than the others. TABLE IX AVERAGE WEIGHTS OF EACH FEATURE CATEGORIES Project Aspectj Eclipse SWT
Score 0.793 0.160 0.207
Text 0.145 0.268 0.202
Component Topic Model 0.030 0.528 0.565
Metadata 0.033 0.045 0.025
4) RQ 4: Most Important Features: Table X shows the top5 features for each category with the highest Fisher scores for each project. The following are our findings: 1) For score features, we notice G1 and Gmax are in the top-5 of the three projects. G1 captures the difference of the highest suspiciousness score and the second highest suspiciousness score, Gmax captures the maximum value of the difference between two consecutive suspiciousness scores. In many effective instances, the suspiciousness score of a buggy file is often very different from the suspiciousness score of the next file in the ranked list. 2) Next, for text features, we observe that the top-5 text features of the three projects are quite different. There is only one word (i.e., “error”) which is important to classify both AspectJ and Eclipse instances. This indicates that textual bug reports of each project are rather different from one another. Therefore, their important text features are unique to each project. 3) Next, we analyze topic model features. From the table, we notice that the most important features of the three projects comes from topic models with different numbers of topics. This means one single topic model (i.e., one abstraction level of words) captures some characteristics of bug reports, but not all of them. Therefore, combining features from different topic models helps our approach to effectively differentiate bug reports of effective instances from those of ineffective ones. 4) Finally, we inspect important metadata features. We find that feature MT10 (number of persons in the CC list of a bug report) is among the top-5 features of the three projects. Usually, the reporters put in CC lists people who they think to be experienced and familiar with a similar kind of bugs. Therefore, longer CC lists somehow
. TABLE X M OST IMPORTANT FEATURES Category Score Feature
Text Feature
AspectJ 1. R1 2. SS5 3. SS4 4. G1 5. Gmax 1. Ferror 2. Fprogram 3. Fimpli 4. Fvoid 5. Freason
Eclipse 1. Gmax 2. G1 3. RD4 4. RD5 5. RD3 1. Feasili 2. Fsubclass 3. Ftest 4. Fnativ 5. Ferror
SWT 1. R1 2. Gmax 3. G1 4. RD2 5. RD6 1. Frun 2. Fstatic 3. Flog 4. Feclips 5. Frefer
Topic Model Feature
1. 2. 3. 4. 5.
TM415 TM515 TM55 TS1avg TM810
1. 2. 3. 4. 5.
TM810 TM10 15 TM415 TM815 TM410
1. 2. 3. 4. 5.
TM210 TM215 TM25 TM15 15 TM15
Metadata Feature
1. 2. 3. 4. 5.
MT6 MT10 MT11 MT8 MT3
1. 2. 3. 4. 5.
MT3 MT14 MT12 MT13 MT10
1. 2. 3. 4. 5.
MT10 MT8 MT1 MT14 MT9
5) RQ 5: Effect of Varying Effectiveness Criterion: Table XI shows the number of effective and ineffective BugLocator instances for N = 1, N = 5 and N = 10. Clearly, the number of effective instances increases when we vary the value of N from 1 to 10. Overall, the numbers of effective BugLocator instances for N equals to 1, 5, and 10, are 31.05%, 54.96%, and 64.41% of all BugLocator instances, respectively. Table XII shows the effect of using various effectiveness criteria on the performance of our approach. From the table, we notice that F-measure increases from 68.03% to 83.22% when we increase N from 1 to 10. This shows that our approach can work well for various effectiveness criteria.
TABLE XI N UMBER OF EFFECTIVE AND INEFFECTIVE INSTANCES OF B UG L OCATOR FOR VARIOUS EFFECTIVENESS CRITERIA . Project AspectJ Eclipse SWT Total
N=1 (+) (–) 65 221 974 2101 35 63 1074 2385
N=5 (+) (–) 139 147 1694 1381 68 30 1901 1558
N=10 (+) (–) 172 114 1978 1097 78 20 2228 1231
TABLE XII F- MEASURE OF OUR APPROACH FOR N=1, N=5, AND N=10 Project AspectJ Eclipse SWT Average
N=1 71.67% 62.97% 69.44% 68.03%
N=5 72.52% 78.67% 83.33% 78.17%
N=10 79.81% 80.69% 89.16% 83.22%
only experimented on bug reports from 3 open source projects. Moreover, the projects are all written in Java and use the same bug reporting system (i.e., Bugzilla). In the future, we plan to reduce these threats by experimenting on more projects written in various programming languages and which use various bug reporting systems. We also plan to extend our study to closed source software systems. We have only investigated 3 IR-based bug localization tools. These tools are the latest IR-based bug localization tools proposed in the literature. In the future, we also want to investigate other IR-based bug localization tools. Threats to construct validity relate to the suitability of our evaluation metrics. We use precision, recall, and F-Measure to evaluate our approach. These metrics are well known [8] and have been used in many software engineering studies [4], [13], [17]. Thus, we believe there is little threat to construct validity. V. R ELATED W ORK
6) RQ 6: Performance on Other IR-based Bug Localization Tools: We inspect the performance of our approach on several other IR-based bug localization tools namely BLUiR [21] and AmaLgam [32]. We use the default effectiveness criterion (i.e., N = 1). Table XIII shows the number of effective and ineffective instances for each tool. From the table, the total numbers of effective instances of BLUiR and AmaLgam account for 33.07% and 54.90% of all instances respectively. Table XIV shows the precision, recall, and F-measure of our approach when applied to BLUiR and AmaLgam instances. We observe that the average F-measure scores across the three projects are close to or higher than 70%. These results show that our approach can be applied to predict the effectiveness of different IR-based bug localization tools. TABLE XIII N UMBER OF EFFECTIVE AND INEFFECTIVE INSTANCES FOR BLU I R AND A MA L GAM Project AspectJ Eclipse SWT Total
BLUiR (+) (–) 76 210 1013 2062 55 43 1144 2315
AmaLgam (+) (–) 105 181 1060 2015 61 37 1226 2233
TABLE XIV F- MEASURE OF OUR APPROACH ON BLU I R AND A MA L GAM INSTANCES Project AspectJ Eclipse SWT Average
BLUiR 67.07% 65.13% 76.03% 69.41%
AmaLgam 70.85% 67.83% 84.03% 74.24%
D. Threats to Validity Threats to internal validity relate to experimenter errors. We have rechecked our implementation several times, but there may still be errors that we do not notice. Threats to external validity relate to the generalizability of our findings. We have
In this section, we highlight related studies on IR-based bug localization and spectrum-based bug (fault) localization and related studies that employ classification techniques to automate software engineering tasks. The survey here is by no means complete. A. IR-Based Bug Localization These techniques leverage information retrieval techniques to measure the similarity between a bug report and source code files to produce a ranked list of most similar files. Rao and Kak applied many standard IR techniques for bug localization and evaluated their performances [20]. Lukins et al. proposed the use of Latent Dirichlet Allocation (LDA) for bug localization [15]. Marcus and Maletic used Latent Semantic Indexing (LSI) to recover document to source code traceability links [16]. Sisman and Kak proposed a technique that predicts the likelihood of a file to be buggy by learning from information stored in version history and use these likelihoods along with a Vector Space Model (VSM) to perform bug localization [25]. Zhong et al. proposed BugLocator, a bug localization tool that uses a specialized VSM model [39]. Saha et al. used the structure of source code files and bug reports to build a structured retrieval model for bug localization [21]. Wang and Lo combined the approaches by Sisman and Kak, Zhou et al., and Saha et al. to build a better bug localization tool [32]. Tantithamthavorn et al. consider co-change histories to improve performance of BugLocator [26]. S.W. Thomas et al. analyze the impact of input parameters on performance of various IR-based bug localization tools, and introduce a framework for combining results of different bug localization tools [28]. In this work, we extend these studies by building an approach that can predict if a ranked list that is output by a bug localization technique is likely to be effective or not. If it is likely to be ineffective, developers can ignore the ranked list and use conventional debugging methods. Following an ineffective bug localization output wastes developers’ time and effort.
B. Spectrum-Based Bug (Fault) Localization These techniques analyze program execution traces and pass/fail outputs of test cases to rank program elements (e.g., program statements). Jones and Harold proposed a suspiciousness formula called Tarantula that assigns suspiciousness scores to program elements [10]. Intuitively, Tarantula considers program elements that appear more in failed executions as more likely to be buggy. Similarly, Abreu et al. proposed a suspiciousness formula called Ochiai [3]. Studies have shown that Ochiai outperforms Tarantula in ranking buggy program elements. Wong et al. proposed DStar (D∗ ) to rank program elements and showed that it outperformed 38 other measures [33]. In another study, Wong et al. proposed a crosstab-based statistical approach for bug localization [35]. In yet another study, Wong et al. proposed the use of an RBF neural network for bug localization [34]. Borrowing concepts from the data mining community, Lucia et al. investigated the effectiveness of 40 association measures and found that Klosgen and Information Gain are promising measures for bug localization [14]. Recently, Xie et al. theoretically proved that several families of suspiciousness formulas outperform the others [36]. Other studies also analyze execution traces to find buggy program elements. However, these studies do not compute suspiciousness scores. Zeller and Hildebrandt proposed Delta Debugging that search for failure inducing inputs [38]. Employing this technique, Zeller searched for minimal state difference between failed and successful execution traces [37]. Cleve and Zeller extended Delta Debugging further by incorporating cause transitions, which is implemented in a tool named AskIgor [7]. In this work, we focus on predicting the effectiveness of an IR-based bug localization tool instead of a spectrum-based bug localization tool. Le and Lo have developed an approach that predicts the effectiveness of a spectrum-based bug localization tool [13]. C. Classification Techniques for Software Engineering There are many studies that employ classification techniques to solve software engineering problems. Bowring et al. employed active learning to predict whether an execution trace is correct or faulty [6]. Antoniol et al. proposed an approach that predicts whether an issue is a bug report or a feature request [4]. Lamkafi et al., Menzies and Marcus, and Tian et al. proposed techniques that predict the severity of reported bugs [11], [12], [17], [29]. Jalbert and Weimer proposed an approach that predicts whether a bug report is a duplicate or not [9]. Tian et al. extended Jalbert and Weimer’s work using a more effective solution [30]. Shibab et al. proposed an approach that predicts whether a closed bug report would be reopened [24]. VI. C ONCLUSION AND F UTURE W ORK In this paper, we address the unreliability of IR-based bug localization techniques by proposing an automatic approach that can predict the effectiveness of a bug localization instance.
We propose a number of features that we extract from an input bug report and a ranked list of suspiciousness scores that are output by a bug localization tool. These features include: suspiciousness score features, text features, topic model features, and metadata features. For each feature category, we use the values of the features extracted from a training data to learn a prediction model using a machine learning technique. We combine these prediction models together to create a final model. We tune the contributions of each constituent model in the final model to achieve the best performance on the training data. Later, we use the final model to predict the effectiveness of bug localization instances whose effectiveness are unknown. We evaluate our proposed approach on state-of-the-art bug localization techniques applied on a dataset of 3,459 bugs from AspectJ, Eclipse, and SWT. Our approach can achieve an average precision, recall, and F-measure of at least 70.36%, 66.94%, and 68.03%, respectively. Furthermore, our approach outperforms a baseline based on the approach proposed by Le and Lo [13] by 84.48%, 17.74%, and 31.56% for bug reports from AspectJ, Eclipse, and SWT, respectively. For future work, we plan to add more features to improve F-measure further. Also, we plan to use search algorithms such as genetic algorithm, to tune the weights that govern contributions of the constituent models in our final model. R EFERENCES [1] https://code.google.com/p/bugcenter/wiki/BugLocator. [2] http://dev.mysql.com/doc/refman/5.1/en/fulltext-stopwords.html. [3] R. Abreu, P. Zoeteweij, R. Golsteijn, and A. J. Van Gemund, “A practical evaluation of spectrum-based fault localization,” Journal of Systems and Software, vol. 82, no. 11, pp. 1780–1792, 2009. [4] G. Antoniol, K. Ayari, M. Di Penta, F. Khomh, and Y.-G. Gu´eh´eneuc, “Is it a bug or an enhancement?: a text-based approach to classify change requests,” in CASCON, 2008. [5] D. Blei, A. Ng, and M. Jordan, “Latent Dirichlet allocation,” J. Machine Learning Research, vol. 3, pp. 993–1022, 2003. [6] J. F. Bowring, J. M. Rehg, and M. J. Harrold, “Active learning for automatic classification of software behavior,” in ACM SIGSOFT Software Engineering Notes, vol. 29, no. 4. ACM, 2004, pp. 195–205. [7] H. Cleve and A. Zeller, “Locating causes of program failures,” in ICSE, 2005. [8] J. Han and M. Kamber, Data Mining Concepts and Techniques, 2nd ed. Morgan Kaufmann, 2006. [9] N. Jalbert and W. Weimer, “Automated duplicate detection for bug tracking systems,” in IEEE International Conference on Dependable Systems and Networks With FTCS and DCC. IEEE, 2008. [10] J. A. Jones and M. J. Harrold, “Empirical evaluation of the tarantula automatic fault-localization technique,” in ASE, 2005. [11] A. Lamkanfi, S. Demeyer, E. Giger, and B. Goethals, “Predicting the severity of a reported bug,” in 7th IEEE Working Conference on Mining Software Repositories (MSR). IEEE, 2010, pp. 1–10. [12] A. Lamkanfi, S. Demeyer, Q. D. Soetens, and T. Verdonck, “Comparing mining algorithms for predicting the severity of a reported bug,” in 15th European Conference on Software Maintenance and Reengineering (CSMR). IEEE, 2011, pp. 249–258. [13] T.-D. B. Le and D. Lo, “Will fault localization work for these failures? an automated approach to predict effectiveness of fault localization tools,” in ICSM, 2013. [14] Lucia, D. Lo, L. Jiang, F. Thung, and A. Budi, “Extended comprehensive study of association measures for fault localization,” Journal of Software: Evolution and Process, vol. 26, no. 2, pp. 172–219, 2014. [15] S. K. Lukins, N. A. Kraft, and L. H. Etzkorn, “Bug localization using latent dirichlet allocation,” Information and Software Technology, vol. 52, no. 9, pp. 972–990, 2010.
[16] A. Marcus and J. I. Maletic, “Recovering documentation-to-source-code traceability links using latent semantic indexing,” in ICSE, 2003. [17] T. Menzies and A. Marcus, “Automated severity assessment of software defect reports,” in ICSM, 2008. [18] C. Parnin and A. Orso, “Are automated debugging techniques actually helping programmers?” in ISSTA, 2011, pp. 199–209. [19] M. F. Porter, “An algorithm for suffix stripping,” Program, vol. 14, no. 3, pp. 130–137, July 1980. [20] S. Rao and A. Kak, “Retrieval from software libraries for bug localization: a comparative study of generic and composite text models,” in MSR, 2011. [21] R. K. Saha, M. Lease, S. Khurshid, and D. E. Perry, “Improving bug localization using structured information retrieval,” in ASE, 2013. [22] H. Seo and S. Kim, “Predicting recurring crash stacks,” in Proceedings of the 27th IEEE/ACM International Conference on Automated Software Engineering, ser. ASE, 2012. [23] E. Shihab, A. Ihara, Y. Kamei, W. M. Ibrahim, M. Ohira, B. Adams, A. E. Hassan, and K. ichi Matsumoto, “Studying re-opened bugs in open source software,” Empirical Software Engineering, vol. 18, no. 5, pp. 1005–1042, 2013. [24] E. Shihab, A. Ihara, Y. Kamei, W. M. Ibrahim, M. Ohira, B. Adams, A. E. Hassan, and K.-i. Matsumoto, “Predicting re-opened bugs: A case study on the eclipse project,” in 17th Working Conference on Reverse Engineering (WCRE). IEEE, 2010, pp. 249–258. [25] B. Sisman and A. C. Kak, “Incorporating version histories in information retrieval based bug localization,” in MSR, 2012. [26] C. Tantithamthavorn, A. Ihara, and K.-i. Matsumoto, “Using co-change histories to improve bug localization performance,” in Software Engineering, Artificial Intelligence, Networking and Parallel/Distributed Computing (SNPD), 2013 14th ACIS International Conference on. IEEE, 2013, pp. 543–548. [27] G. Tassey, “The economic impacts of inadequate infrastructure for software testing.” National Institute of Standards and Technology. Planning Report 02-3.2002, 2002.
[28] S. Thomas, M. Nagappan, D. Blostein, and A. Hassan, “The impact of classifier configuration and classifier combination on bug localization,” 2013. [29] Y. Tian, D. Lo, and C. Sun, “Information retrieval based nearest neighbor classification for fine-grained bug severity prediction,” in 19th Working Conference on Reverse Engineering (WCRE). IEEE, 2012, pp. 215– 224. [30] Y. Tian, C. Sun, and D. Lo, “Improved duplicate bug report identification,” in Software Maintenance and Reengineering (CSMR), 2012 16th European Conference on. IEEE, 2012, pp. 385–390. [31] H. Valdivia Garcia and E. Shihab, “Characterizing and predicting blocking bugs in open source projects,” in MSR, 2014. [32] S. Wang and D. Lo, “Version history, similar report, and structure: Putting them together for improved bug localization,” in ICPC, 2014. [33] W. E. Wong, V. Debroy, R. Gao, and Y. Li, “The dstar method for effective software fault localization,” IEEE Transactions on Reliability, 2013. [34] W. E. Wong, Y. Shi, Y. Qi, and R. Golden, “Using an rbf neural network to locate program bugs,” in ISSRE, 2008. [35] W. E. Wong, T. Wei, Y. Qi, and L. Zhao, “A crosstab-based statistical method for effective fault localization,” in ICST, 2008. [36] X. Xie, T. Y. Chen, F.-C. Kuo, and B. Xu, “A theoretical analysis of the risk evaluation formulas for spectrum-based fault localization,” ACM Transactions on Software Engineering and Methodology (TOSEM), vol. 22, no. 4, p. 31, 2013. [37] A. Zeller, “Isolating cause-effect chains from computer programs,” in FSE, 2002. [38] A. Zeller and R. Hildebrandt, “Simplifying and isolating failure-inducing input,” Software Engineering, IEEE Transactions on, vol. 28, no. 2, pp. 183–200, 2002. [39] J. Zhou, H. Zhang, and D. Lo, “Where should the bugs be fixed? more accurate information retrieval-based bug localization based on bug reports,” in ICSE, 2012.