Predicting Protein Interactions from Functional Specificity K. Anton Feenstra1 , Giacomo Bastianelli2 , and Jaap Heringa1 1
Centre for Integrative Bioinformatics VU (IBIVU), Vrije Universiteit Amsterdam, De Boelelaan 1081A, 1081 HV Amsterdam, The Netherlands E-mail: {feenstra,heringa}@few.vu.nl 2
Institut Pasteur, 25-28 rue du Dr Roux, Paris, France E-mail:
[email protected]
Many protein families involved in protein-protein interaction (PPI) contain sub-families that interact with different protein binding partners. We have applied the Sequence Harmony method (SH), which is able to detect specificity sites from a multiple sequence alignment (MSA) containing sub-families. The input was a dataset of MSAs of interacting protein families, each time containing a set of non-interacting paralogous sequences. Exploiting the differences in sequence conservation between the binding and non-binding groups by SH, we demonstrate that predicted specificity residues turn out to reside on the protein surface. We also show that we can select interface residues with approximately 14% coverage (true-positive rate) at 27% error (false-positive rate).
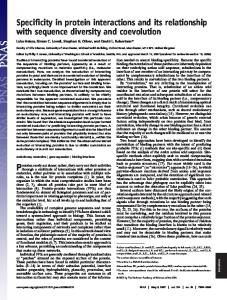
Introduction Specificity is a critical ingredient in regulation and signaling processes in cellular systems and it is most often achieved by recognition between specific proteins. Detection of specificity residues is most often used to pinpoint functional residues in general,1 however, if the functional difference is based on protein-protein interactions (PPI), specificity sites can actually correspond to the interface region. We will attempt to identify PPI interface regions from protein sequence using the previously introduced SH method for detection of subtype specific sites.2, 3 The general scheme of our approach is shown in Fig. 1, and is based on the availability of data on interacting (AB) and non-interacting (A-B0 ) paralogs. The first step is the detection of a non-interacting ortholog (B0 ) to one of the interacting proteins (B, in this case). Second is the addition of orthologs to both the interacting and non-interacting proteins, and finally the selection of specificity residues using this pair of paralogous groups of orthologs.
A
PPI
PP
B B
I
A
B'
Figure 1. For a pair of interacting proteins (A-B) we find a non-interacting homolog (B0 , no interaction with A), and orthologs of the interactor (B) and non-interactor (B0 ). Specificity residues for these ortholog groups (B vs. B0 ) are putative interface residues in B. Analogously, we select putative interface residues for A (using A0 that does not interact with B), which can be matched up to form the interface between A and B.
1
Methods Homolog Detection Experimental PPI evidence is based on the sum of socio-affinity scores from Gavin et al.4 and Krogan et al.5 , as proposed by Van Noort et al.6 . We took a score above a threshold of 4 as interacting, and below as non-interacting. For paralog detection, we blast each interacting protein (B) against the nr database with entrez query=Saccharomyces cerevisiae. We find the first non-interacting protein (B0 ), ordered according to the blast score (most similar first). We filter the hits by sequence length of least 80% of the query. For the ortholog search, we use the same rationale as for the paralog search but now using the Fungi database, and retain one hit for each of the first 10 organisms (so, at most 10 different organisms). For these hits, we require the length to be between 80% and 140% of the interacting protein, a bit-score of > 50 and an e-value of < 10−15 . Protein-protein Interaction Specificity The basis of the interaction specificity residue detection is the selection of specificity residues using SH. These selections are further filtered using simple rules based on group and combined entropies. For the SH method, sequences are taken from an input alignment and separated into user-specified groups. The SH score for two groups A and P B is calculated as SH = 1 (S − S − S ), using the group entropies (S = − p log p) and combined enA+B A B 2 P tropy over the column (SA+B = − (pA + pB ) log (pA + pB )), where the sums are over all residue types. SH values range from zero for completely non-overlapping residue compositions, to one for identical compositions. Further details on the method were described previously.2, 3, 7 Our dataset contains 15 heterodimer complexes of S. cerev. proteins of size 30 or larger for which PDB files are available, and the analysis includes all 15 · 2 chains. Interface and surface residues were identified using MSMS.8 Interface 69.6% 9.8% 10.1% 34.3% 9.5% 48.9% 61.8% 21.2% 42.3% 28.9% 17.8%
Surface 50.2% 30.7% 10.2% 19.2% 7.4% 52.1% 67.0% 12.9% 33.8% 17.9% 13.4%
Criterion SB < SB 0 SB 0 < SB SA+B = 0 SB 0 − SB > 0.3 SB = 0 and SB 0 = 0 and SH = 0 SA+B > 0.4 SA+B > 0.4 within SB 0 −SB > 0.3 and SB < 0.3 SA+B > 0.4 and SB 0 − SB > 0.3 and SB < 0.3 SH < 0.2 SB < SB 0 and SH < 0.2 SB 0 − SB > 0.3 and SH < 0.2
Description more conserved in interactor less conserved in interactor conserved much more conserved in interactor conserved in group but not between variable (non-conserved) variable within conserved interactor variable and conserved interactor specific (low harmony) conserved interactor and specific more conserved interactor and specific
Table 1. Behaviour of residues at the interface and at the rest of the surface (non-interacting part) in terms of SH and group (SA , SB ) and overall (SA+B ) entropies.
2
Results and Discussion We have observed (data not shown) that our predictions are very sensitive to a propor selection of paralog and ortholog sequences. Particularly, the prediction quality depends on the distance between the interacting protein and its non-interacting paralog. (Non-)Interacting paralogs Our selection procedure was set up to identify non-interacting paralogs based on specific blast-searches. We observed, however, that less than 10 percent of all paralogs found were actually interacting. This opens the interesting possibility of applying our approach without the support of (high-quality) data on non-interaction, which in general is much less reliable than interaction data. This could be done on a much larger scale from available genomic sequence data and high-throughput PPI screens. Surface and Interface Properties
60
S≥ 0.00 0.00 0.05 0.10 0.15 0.15
SB ≤ 1.00 0.90 0.80 0.70 0.60 0.50
SB’-SB≥ 0.00 0.00 0.05 0.05 0.10 0.10
40
SH≤ 1.00 0.90 0.80 0.70 0.60 0.50
SH≤ 0.40 0.35 0.30 0.25 0.20
S≥ 0.20 0.25 0.30 0.35 0.35
SB ≤ 0.40 0.35 0.30 0.25 0.20
SB’-SB≥ 0.15 0.20 0.25 0.30 0.35
0
20
Coverage (TPR, %)
80
100
Previously, we had already observed that specificity residues are predominantly located at the protein surface2, 3 . Since interface regions obviously are on the surface as well, we therefore analyzed the selection of surface residues in the current dataset. We used SH ≤ 0.3, SB ≤ 0.3, and SB 0 − SB ≥ 0.3 and find that between 71% and 95%, on average 86% ± 8, are at the surface. From the properties listed in Table 1, we can make a detailed comparison between interface residues and other surface residues (non-interface). We see an enrichment on the interface of residues with entropy SB (interacting) lower than SB 0 (non-interacting), which is 70% over 50%. This ratio becomes bigger if the entropy difference is bigger, 34% over 19%. Also low-harmony sites are somewhat more prevalent on the interface. Conservation and variability seem to be equally distributed between the intface and rest of the surface.
0
20
40
60
80
100
Error (FPR, %) Figure 2. ROC curve (TPR vs. FPR) for selection of interface residues from different selection criteria.
3
Selecting Interface residues From the observed statstics, we will now derive some rules for the selection of interface residues. First of all, the entropy SB (interacting) should be lower than SB 0 (noninteracting). This is true for 70% of interface residues, and for 34% the difference is even bigger (> 0.3). In addition, the SH score should not be high for a residue that is critical for interaction with the partner, but it also is not necessarily very low (42% with SH < 0.2). In Fig.2 we show a ROC plot for a set of different combinations of selection parameters, cf. Table 1, going from relaxed to more stringent. We can obtain very high coverage (90%), but at relatively high error (60%). Lowering the error rate goes sharply at the cost of coverage, and the lower half of the ROC curve even goes below the line expected for a random selection (where FPR ∼ TPR).
Conclusion We have shown that subtype specificity can be used as a tool to pinpoint interface residues. However, care should be taken in selecting the paralog and ortholog proteins. Nevertheless, the trends we observed will be helpful in the further development of protein interface prediction. In addition, our analysis yields some insights in possible evolutionary selection mechanisms that have helped shape protein interfaces, and furthers our understanding of specificity of protein-protein interactions.
Acknowledgments We thank Vera van Noort and Martijn Huynen for the Gavin-Krogan socio-affinities dataset. We thank Bas Dutilh and Martijn Huynen for stimulating discussions.
References 1. J. C. Whisstock and A. M. Lesk, Prediction of protein function from protein sequence and structure, Quart. Rev. Biophys., 36, no. 3, 307–340, 2003. 2. K.A. Feenstra, W. Pirovano, K. Krab, and J. Heringa, Sequence harmony: detecting functional specificity from alignments, Nucleic Acids Res., 35, no. web server issue, W495–W498, 2007, www.ibi.vu.nl/programs/seqharmwww. 3. W. Pirovano, K. A. Feenstra, and J. Heringa, Sequence Comparison by Sequence Harmony Identifies Subtype Specific Functional Sites, Nucl. Acids Res., 34, no. 22, 6540–6548, 2006. 4. A.C. Gavin, P. Aloy et al., Proteome survey reveals modularity of the yeast cell machinery, Nature, 440, 631–636, 2006. 5. N.J. Krogan, G. Cagney et al., Global landscape of protein complexes in the yeast Saccharomyces cerevisiae, Nature, 440, 637–643, 2006. 6. V. van Noort, B. Snel, and M.A. Huynen, Exploration of the omics evidence landscape: adding qualitative labels to predicted protein-protein interactions., Genome Biol., 8, R197, 2007. 7. K. A. Feenstra, W. Pirovano, and J. Heringa, Sub-type Specific Sites for SMAD Receptor Binding Identified by Sequence Comparison using ”Sequence Harmony”., in: From Comput. Biophys. to Syst. Biol., U.H.E. Hansmann, J. Meinke, S. Mohanty, and O. Zimmermann, (Eds.), vol. 34 of NIC Series, pp. 73–78, John von Neumann Institute for Computing, J¨ulich, 2006. 8. M.F. Sanner, A.J. Olson, and J.C. Spehner, Reduced surface: an efficient way to compute molecular surfaces., Biopolymers, 38, 305–320, 1996.
4