Predicting Surprise Judgments from Explanation Graphs Meadhbh I. Foster (
[email protected]) Mark T. Keane (
[email protected]) Department of Computer Science & Informatics, University College Dublin Belfield, Dublin 4, Ireland surprising event, a task often carried out retrospectively rather than predictively (e.g., Kahneman & Miller, 1986; Maguire, Maguire, & Keane, 2011). While this theoretical opposition is real, they may actually be complementary, addressing different classes of events (see section 1.1). The current paper focuses on sense-making aspects of surprise, where the sense-making process is cast as explanation formation; people’s perception of surprise is a metacognitive estimate of the cognitive work involved in explaining a surprising event (see Foster & Keane, 2013). Stated simply, some surprises are more surprising because they are harder to explain. Though both are surprising events, it is more surprising to hear that an X-Factor teen contestant has died, than it is, unfortunately, to hear that Amy Winehouse has died (given her pre-history of substance abuse), because the former is harder to explain than the latter (although, as surprise is a subjective experience, this can depend on the individuals level of knowledge surrounding each event). Traditionally, explanation is seen as playing a role in building causal models or predictive schemas to deal with future events (Heider, 1958; Lombrozo & Carey, 2006). However, apart from having a predictive role when a new situation is initially encountered, explanation may also serve to help people decide how information should be weighted or how attention should be allocated, as events occur (Keil, 2006). In the remainder of this section, before presenting our model of surprise, we briefly consider broad categories of surprising events, and previous models proposed from probabilistic and sense-making perspectives.
Abstract Surprise is a ubiquitous phenomenon that is implicated in many areas of cognition, from learning, to decision making, to creativity. For example, it has recently been proposed as a trigger for learning in robotic agent architectures. This paper describes a novel cognitive model of surprise based on the idea that surprise is fundamentally about explaining why the surprising event occurred; events that can be explained easily are less surprising than those that are more difficult to explain. Using explanations that people have produced, this surprise model builds a directed graph of explanations that link the setting and outcome of a given scenario, and uses this graph to predict surprise ratings. Simulations are reported which show that the model’s performance corresponds closely to the psychological evidence, as measured by people’s ratings of different surprising scenarios. Keywords: surprise; explanation; cognitive; judgments
1. Introduction The phenomenon of surprise has been intensively researched since Darwin’s time, perhaps because it involves an interesting mixture of emotion and cognition. Though surprise clearly involves an emotional reaction (often accompanied by a startle response), it also seems to serve a strategic, cognitive goal, as it directs attention to explain why the surprising event occurred and to learn for the future (e.g., Ranganath & Rainer, 2003). Originally conceived of as a “basic emotion” (e.g., Darwin, 1872; Ekman & Friesen, 1971; Izard, 1977; Tomkins, 1962), more recently surprise has been re-appraised as a cognitive state because, unlike most emotions, it can be either positively or negatively valenced (Ortony & Turner, 1990). In Artificial Intelligence, Macedo, Cardoso, Reisenzein, Lorini, and Castelfranchi (2009) have argued that any agent operating in a changing and imperfectly known environment needs a surprise mechanism to survive. Specifically, surprise is considered an essential requirement in robotic, agent architectures to identify learning events (e.g., Macedo, Reisenzein, & Cardoso, 2004). In Cognitive Psychology, theories of surprise fall into two identifiable camps, the “expectation” and “sense-making” approaches. Expectation theories focus on the properties of surprising outcomes, characterizing them as low-probability events, disconfirmed expectations, schema-discrepant events or events of contrasting probabilities (e.g., Meyer, Reisenzein, & Schützwohl, 1997; Reisenzein & Studtmann, 2007; Teigen & Keren, 2002, 2003). Sense-making theories stress the importance of understanding and integrating the
1.1 Categories of Surprising Events The theoretical division between expectation and sensemaking accounts of surprise may reflect a different emphasis on two broad classes of scenario. Some scenarios invite the formation of definite expectations, whereas others do not. For example, if a coin is tossed in the air, it is reasonable to develop the expectation that it will come down as either heads or tails. If someone is running a race, it is reasonable to develop expectations that they will win (or lose). However, if you are sitting at home watching TV, you are unlikely to develop the expectation that a rock will come through the window. If you are watching a teenage X-Factor contestant singing on TV, it is not reasonable to develop the expectation that they will die an hour from now. Indeed, many everyday scenarios are probably ones in which people do not generate expectations for every possible outcome of the scenario before-the-fact. As Ortony and Partridge have
124
noted: “It is not realistic to suppose that a system with goals and tasks to perform is at the same time randomly spawning inferences about unrelated and improbable possibilities” (p.107, 1987). As we shall see in the following sections, this distinction between two broad classes of surprising event – those that are prior-expectation-inviting and those that are not priorexpectation-inviting – is important, as the latter present specific issues for probabilistic accounts that do not arise for sense-making interpretations of surprise.
making accounts, as they fundamentally operate in a retrospective way; they typically see surprise as a process of resolving some inconsistency after the event occurs.
1.3 A Sense-Making Model of Surprise We know of only one fully-implemented computational model adopting the sense-making perspective; that developed by Maguire, Costello and Keane (2006), based on Grimes-Maguire and Keane’s (2005) theory of Representation-Fit (see also Maguire et al., 2011). It conceptualizes surprise as a representation-fitting process of integrating surprising events with existing schemas, as opposed to a process of expectation disconfirmation. Their model consists of two parts: an integration stage and an analysis stage, utilizing many ideas from Connell and Keane’s (2006) Plausibility Analysis Model (PAM). The integration stage links each event in a scenario with those that have happened already so that a current, coherent representation is formed, and a total incoherency score for the scenario is created, based on the ratio of linked concepts to unlinked concepts. Then, the analysis stage involves a systematic assessment of this representation; calculating the surprise for a given event. For this assessment, the model detects factors that are both directly supportive of the surprising event, and those that are vaguely supportive of it. Using WordNet (cf. Miller, 1995) as a foundation for their knowledge base, they showed this model of surprise to be consistent in predicting people’s surprise ratings for a series of short stories with predictable, neutral, and unpredictable outcomes. However, this approach could, possibly, be linked with an expectation account, as degree-of-expectation could be seen as a function of this incoherency score. Having reviewed the main issues in previous theories and models of surprise, in the remainder of the paper we advance a new sense-making model, the Explanatory Analysis Model of Surprise (EAMoS) based on Foster and Keane’s (2015) Metacognitive Explanation-Based (MEB) theory of surprise. Like Maguire et al.’s (2006) model, the present model focuses on several studies of surprise in discourse (see Maguire et al., 2011; Foster & Keane, 2013, 2015). Hence, before presenting the model, we briefly review this empirical evidence.
1.2 A Probabilistic Model of Surprise Most of the existing computational models of surprise are framed from the expectation-disconfirmation perspective rather than the sense-making one (see, e.g., Bae & Young, 2008; Lorini & Castelfranchi, 2006, 2007; Macedo & Cardoso, 2001; Macedo et al., 2004; Baldi & Itti, 2010). For example, Baldi and Itti’s (2010) Bayesian theory of surprise, mathematically defines surprise as the effect that an event has on an observer; specifically, surprise is defined as the distance between prior and posterior belief distributions (see also Itti & Baldi, 2006, 2009). They have shown this theory of surprise to work well in predicting human gaze by computing surprise over images and video stimuli in a computer vision system using a neural network architecture. However, Itti and Baldi (2009) note that a consistent definition of surprise (using a Bayesian framework), must involve prior and posterior distributions to capture subjective expectations. So, for this theory prior beliefs (i.e., expectations) necessarily need to be computed so that the change between prior and posterior belief distributions can be calculated. As such, the theory cannot account for instances of surprise in which expectations are not computed in advance. Many other probabilistic models recognize that this “missing-expectations problem” needs to be addressed. For instance, Bae and Young (2008) employ the notion of postdictability in their model of surprise in narratives. That is, often in a narrative there is a “hidden truth” revealed at the end of a story that resolves some surprising event, where this resolution essentially involves an after-the-fact explanation step. Similarly, Macedo and Cardoso (2001; Macedo et al., 2004) draw on both the cognitivepsychoevolutionary model of surprise and Ortony and Partridge’s (1987) distinction between active and passive expectations to model surprise. Passive expectations are those that cause the agent to be surprised after-the-fact; cognitive attempts to retrospectively construct what they could have expected to happen. However, they still rely on expectations, and, as such, are distinct from more sensemaking, explanation-based proposals for surprise. At present, it is not wholly clear how the missingexpectation problem might be best handled within the probabilistic framework. What can be said is that, at the very least, it requires some “retrospective machinery” to recover what expectations should have been adopted, afterthe-fact. As we shall see, these issues do not arise for sense-
2. Recent Evidence on Surprise There is now a considerable body of empirical work on aspects of surprise in discourse (e.g., Grimes-Maguire & Keane, 2005; Gendolla & Koller, 2001; Maguire et al. 2011; Foster & Keane, 2013). This work makes use of simple stories describing surprising events, presented to people before asking them to judge the surprisingness of the outcome. So, for example, for the story in Table 1, people would typically read the key sentences one at a time, before being shown the outcome and asked to rate its surprisingness. This research has revealed several interesting aspects of surprise behavior. For instance, Foster and Keane (2013) have recently shown that some surprising events may be “known” or “less-known”; that is, some
125
surprising events may have “ready-made” explanations for them, whereas others do not (see also Schank, 1986). Imagine, one day you are walking home and discover that your wallet is missing from the pocket of your jeans. You would be surprised, but also have some ready explanations for what might have occurred (e.g., “Could it have been robbed?”, “Might I have dropped it?”). Now, imagine you are walking home and discover that your belt is missing from the waist of your jeans. Again, you would be surprised, but few explanations present themselves (the only one we could think of, eventually, was leaving one’s belt in the security area at the airport). So, here, a small change in the object mentioned in the outcome (i.e., wallet or belt) subtly changes the activated knowledge, altering the ease with which the surprise is resolved.
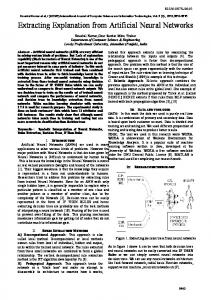
known dimension (see Figure 1). These are the results modeled in the following simulation.
3. Presenting EAMoS: An Explanatory Analysis Model of Surprise The current novel sense-making model, EAMoS, is based on the MEB theory of surprise (Foster & Keane, 2015). EAMoS takes a different, simpler approach to previous models of surprise, focusing on the structure of the set of explanations for a given surprising event. We posit that every surprising scenario has an explanatory structure, consisting of a space of putative explanations that link the outcome to its preceding setting (see also Leake, 1991; Schank, Kass, & Riesbeck, 1994), and that surprise is resolved by building an explanation to relate the setting to the outcome. The shape of the explanation space for a given scenario determines whether it will furnish explanations that emerge easily (i.e., almost as in “normal” comprehension) or whether this requires more concerted cognitive effort (at the extreme, even involving conscious problem solving). Following these proposals, the present model conceptualizes the explanation space as a graph of the set of explanations for the surprising event, and analyses the structure of this graph to predict the surprisingness of the outcome. Note, the model has no mechanics for generating explanations per se; but rather builds its graph from provided text descriptions of people’s explanations gathered in previous experiments.
Figure 1: Mean surprise judgments across scenarios for both levels of Outcome-Type (known vs. less-known) (Foster & Keane, 2013, Experiments 1 & 2) with standard errors.
Table 1: Sample scenario used by Foster & Keane (2013, Experiments 1 & 2).
Foster and Keane (2013) operationalized this known/lessknown dimension for these story materials using (i) a pretest sorting task by an independent group of participants and (ii) Latent Semantic Analysis (LSA) coherence scores (cf. Landauer & Dumais, 1997). They showed that these different classes of outcomes either eased or inhibited the process of explanation and, respectively, reduced or increased the experienced surprise associated with the scenario (as measured by surprise ratings). Importantly, Foster and Keane also asked participants to explain the surprising outcomes; thus providing data about the range of possible explanations used (data that forms the basis for the current simulations). The procedures in the Foster and Keane (2013) experiments were similar. In both, participants were asked to read nine stories and to judge the surprisingness of their outcomes. The participants in one condition (explanation) were asked to produce the first explanation they could think of for why the outcome may have occurred, before rating it for surprise; in a second condition (comprehension), participants were asked to answer two simple comprehension questions about the scenario before rating it for surprise. In both experiments participants rated their surprise on a scale from 1-7, with 1: not surprising and 7: very surprising. As predicted, Foster and Keane (2013) found main effects for the known/less-
Setting
Outcome
Rebecca is on the beach. She goes for a swim in the water Known Less-Known After she dries herself off After she dries herself off she notices that her skin she notices that her skin has turned red. has turned turquoise.
2.1 How EAMoS Works Operationally, EAMoS takes scenarios consisting of pairs of setting and outcome inputs (e.g., see Table 1), and explanations that were produced for these scenarios by groups of participants in previous empirical work (Foster & Keane, 2013). No changes were made to these explanations before they were read in to the model, aside from the correction of some spelling mistakes. EAMoS uses these explanations to build an explanation graph; that is, a directed graph, G, from setting to outcome (e.g., see Fig. 2). It then outputs a surprise rating for the outcome described in the scenario. 2.1.1 Phase One: Populating the Explanation Space The model itself first reads in the setting of the scenario for which it is judging surprise, followed by the explanations and the outcome in question. These settings and outcomes are pre-processed (i.e., punctuation, capitalization, and stop
126
words1 are removed, and stems/root-forms are determined where appropriate), and represented as single nodes (see Fig. 2). The explanation text-strings are processed in more detail: The explanations used to populate G are preprocessed, but otherwise are used as given by people. After this pre-processing step, G is built as the set of nodes; every entity in each explanation string that remains after preprocessing becomes a node in G. For each node, a directed edge is added to the graph for (i) every pair of consecutive entities in an explanation, (ii) from the setting to the first entity, and (iii) from the last entity to the outcome.
number of given entities (Given Information; Total GI) provided in the setting and outcome, and the number of given entities that are used as nodes in G (GI Used). EAMoS uses these variables, scaled by the number of explanations included in the building of G, to calculate surprise by applying a function that ascertains the difficulty of explaining the outcome, shown in Figure 3. Theoretically, this function is based on MEB’s idea that surprise is based on explanation; the structure of the explanation space is an approximation for how easy or difficult this process will be. Surprise increases as the ratio between edges and nodes increases. Surprise decreases when more of the given entities are used in explanations. This is scaled by the number of explanations that were used to populate G.
Explanations used: 1. The water was cold. 2. She is cold. 3. She has been sunburned through the water. 4. She has sunburn.
Figure 3: The surprise function used by EAMoS.
2.2 Model Simulation and Evaluation To evaluate the model, we compared the surprise ratings that EAMoS produces to the ratings produced by participants in two experiments reported by Foster and Keane (2013, Experiments 1 & 2). In this simulation, the model was run on the exact same scenarios presented to the human participants. 2.2.1 Simulation Setup For the purposes of the simulation, the mean surprise rating of each scenario was used. The model took as input each scenario, built the explanations graph for each setting and outcome pair, and produced surprise ratings using the formula in Figure 3. These ratings were then normalized and translated into a number between 1 and 7, to allow for direct comparison with human ratings from Foster and Keane (2013). The two experiments used 18 different story scenarios, all of which were used in the simulation; the mean surprise ratings for each scenario were recovered from the raw data of participant responses.
Figure 2: Simplified explanation structure produced by EAMoS for the known variant of the Rebecca scenario (see Table 1) using only four explanations. If two entities in different explanation strings are the same (such as “water” in the simple explanation structure demonstrated in Fig. 2), then they are represented as a single node in G, though the edges between this entity and those consecutive to it may differ for the two different explanations. So, the explanations “she has been sunburned through the water” and “the water was cold” both include “water” in their representation in G, but each explanation path can be traced distinctly through G from setting to outcome. Thus, the relatively simple computational process described above produces G, which encodes the approximate relationship and overlap among all the entities in the provided explanations for each outcome. 2.1.2 Phase Two: Calculating Surprise EAMoS’s analysis takes as its core input two variables from G to represent the explanatory structure of that scenario: (i) the number of edges, and (ii) the number of nodes. It also counts the total 1
Figure 4: EAMoS’s output against human surprise ratings. Default English stop words list used: www.ranks.nl/stopwords
127
2.2.1 Results and Discussion EAMoS returned surprise scores that were highly correlated with the human data (N = 95) from Foster and Keane (2013), r(16) = 0.771, p = 0.0002. At a finer level of detail, EAMoS’s surprise ratings correlated with the data for both Experiment 1, r(16) = 0.737, p = 0.0005, and Experiment 2, r(16) = 0.779, p = 0.0001. A regression analysis confirmed that EAMoS’s output could be used to predict human performance in surprise ratings, again when the total data set was used, R2 = 0.594, p = 0.0002 (see Figure 4 for a scatterplot of the relationship between model output and participant means), and individually, for Experiment 1, R2 = 0.544, p = 0.0005 and for Experiment 2, R2 = 0.607, p = 0.0001. Next, we wanted to see how the model would perform in relation to the two levels of Outcome-type, known and less-known. Accordingly, we performed an independent measures t-test, which revealed a significant difference between the surprise ratings produced by the model for known and less-known Outcome-types, t(16) = -2.66, p = 0.017, 2-tailed. As expected, the model scored the less-known scenarios as more surprising (M = 4.36, SD = .764) than the known scenarios (M = 3.55, SD = .504). This compares favorably to the experimental results and suggests that the model was able to represent the different explanation structures afforded by the two levels of Outcome-type.
differently and has no major effect on the model’s highly significant correlations with human surprise judgments. Although the correlations are slightly higher when the edges variable is weighted at 25%, we wished to avoid over fitting the model to this data set, so have not altered the formula to reflect this. Overall, these findings suggest that our approach of not weighting the variables separately is a succinct and suitable approach.
3. General Discussion Previous models have approached the modelling of surprise largely from an expectation-disconfirmation perspective. In this paper we have described a computational model of surprise that takes the novel approach of using explanation structure to predict surprise ratings for a variety of scenarios. Simulations have shown a strong correspondence between predictions made by EAMoS and participant generated surprise ratings, and the model has tested favorably for reliability. Although the scenarios used in the simulation detailed here have been short, simple textual descriptions of events, we believe that the model could be extended to predict surprise in more extended discourse, and in real life situations – indeed, for any situation in which explanations for why the event occurred can be computed . One future direction that we are currently implementing is to alter the model to predict surprise for individual participants, rather than at the group level. Another fruitful direction could be to include a semantic knowledge base; although the simplicity of this model works well in predicting human surprise, allowing the model to match, say, “sea” with “water” in explanations for the Rebecca scenario described above, may provide even more accurate predictions. In conclusion, this work has shown that surprise can be predicted by a simple analysis of explanations that link preceding settings with target surprising outcomes. These initial simulations are promising, and even in the simple form presented here the model correlates strongly with people’s surprise ratings. In addition to providing further support for the MEB theory of surprise by illustrating that explanation plays a key role in surprise, these results point to promising future research directions for surprise that have not been previously explored.
Table 2: Sensitivity analysis detailing correlations when weights are varied for nodes and edges in EAMoS’s analyses (**Correlation is significant at