Iranian Journal of Fuzzy Systems Vol. 9, No. 3, (2012) pp. 127-146
127
PREDICTING URBAN TRIP GENERATION USING A FUZZY EXPERT SYSTEM A. A. RASSAFI, R. REZAEI AND M. HAJIZAMANI
Abstract. One of the most important stages in the urban transportation planning procedure is predicting the rate of trips generated by each traffic zone. Currently, multiple linear regression models are frequently used as a prediction tool. This method predicts the number of trips produced from, or attracted to each traffic zone according to the values of independent variables for that zone. One of the main limitations of this method is its huge dependency on the exact prediction of independent variables in future (horizon of the plan). The other limitation is its many assumptions, which raise challenging questions of its application. The current paper attempts to use fuzzy logic and its capabilities to estimate the trip generation of urban zones. A fuzzy expert system is introduced, which is able to make suitable predictions using uncertain and inexact data. Results of the study on the data for Mashhad (Lon: 59.37 E, Lat: 36.19 N) show that this method can be a good competitor for multiple linear regression method, specially, when there is no exact data for independent variables.
1. Introduction The first and one of the most important steps in the process of traffic volume prediction is to estimate the number of trips generated in each traffic zone. Two widely-spread methods that are used for prediction are “multiple linear regression” and “cross classification” techniques [21, 32, 37]. A cross-classification table shows the number of daily trips produced per household for different characteristics of households, such as household size, number of owned cars, etc. The trip rates per household are developed from a household survey, and will be used for predicting the number of future trips. The ‘cross-classification analysis’ method is based on estimating the rates of trip production as a function of different socio-economic characteristics of households, such as household size, number of owned cars, etc.. The basic assumption is that trip rates remain constant over time for aforesaid stratification. Therefore, the number of households of each household category needs to be forecasted in the future [37]. Multiple linear regression (MLR) method, relates the number of trips (or trip rates) of each purpose generated by each individual, household, or traffic zone, Received: January 2011; Revised: September 2011; Accepted: October 2011 Key words and phrases: Trip generation, Multiple linear regression, Membership function, Fuzzy rules, Fuzzy expert system.
128
A. A. Rassafi, R. Rezaei and M. Hajizamani
as dependent variable, to a set of socio-economic characteristics of that individual/household/zone, as independent (explanatory) variables. This relation is expressed by a mathematical phrase. In order to use the model as a predictor of future trips, a calibration process is used to estimate the parameters (the coefficients of independent variables) under the OLS (Ordinary Least Square) assumption. In other words, first, the available ‘current’ data for both dependent and independent variables are used to estimate the parameters. Then, it is possible to predict ‘future’ trips by using the forecasted values for independent variables. The prediction can be made with the assumption that the relationship between explanatory variables and dependent variable remains unchanged for the planning year. Despite its wide spread applications, regression has limitations [10, 21]. One of the disadvantages is the need to the other methods to forecast the values of the independent variables for the prediction period. To the extent the forecasts of the values of independent variables are erroneous; the regression-based predictions will be imprecise. In other words, there is a need to ‘exact’ data of variables for future. Second, there is no guarantee that the past relationship between independent and dependent variables will unchangeably continue in the future. As mentioned above, in urban transportation modeling procedure, it is assumed that the forecast equation holds exactly in the prediction period. In the current study, number of trips generated by each traffic zone is estimated using a fuzzy expert system. The input of this system is inexact and inexplicit human knowledge in form of facts and certain or uncertain rules. In other words, having unclear information for future values of independent variables, it is possible to gain an insight to the dependent variable’s value for the horizon year. In this method the final output, i.e. the number of generated trips for each traffic zone will be found using a reasoning scheme. Therefore, the fuzzy expert system enables us to provide the future traffic volumes, with a reasonable precision and without the need of exactly predict the future values of independent variables. The paper is organized as follows: first, the role of multiple linear regression in urban transportation demand modeling process is discussed, then fuzzy expert systems are introduced, and the application of computational intelligence to transportation studies is reviewed. In order to develop the study’s idea, a multiple linear regression model as well as a fuzzy expert system is constructed for Mashhad. The results of both models, and comparison them are discussed in the next section. Finally, the study’s concluding remarks, acknowledgment, and references are presented. 2. Multiple Linear Regression in Urban Transportation Demand Modeling The commonly-used urban travel forecasting procedure is still the four-step Urban Transportation Planning System (UTPS), the first step of which, i.e. trip generation, determines the overall scale and pattern of trip making within a study area [33]. Linear regression is still widely used in transportation demand modeling particularly in modeling trip generation [32, 33, 37], even though this methodology does not recognize the non-negativity and integer nature of the trips [31, 51]. This
Predicting Urban Trip Generation Using a Fuzzy Expert System
129
method is one of the most widely studied and applied statistical and econometric techniques, because it is suitable for modeling a wide variety of relationships between variables [51]. Furthermore, their fuzzy variations have been extensively developed [1, 14, 15, 38]. Regression analysis is a statistical tool for the investigation of causal or functional relationships between variables [6], or rather, regression is the study of dependence [52]. Usually, the researcher seeks to ascertain the causal effect of one variable upon other ones. In trip generation modeling, the frequently used method is multiple linear regression. The implementation of this method in transportation demand analysis was first occurred in 1950s [37]. Having found the relationship between dependent and independent variables by regression, transportation experts are able to predict trips generated by each traffic zone. The relationship between variables can be expressed by the following equation: Y = β0 + β1 · X1 + β2 · X2 + ... + βn · Xn + ε
(1)
where Y is the dependent variable, which in a transportation demand study is the number of produced or attracted trips. X1 , X2 ,...,and Xn are independent variables effective on trip production or attraction, and β0 , β1 , β2 ,..., and βn called the regression parameters or coefficients, which are unknown constants to be determined (estimated) from the data. ε is assumed to be a random error representing the discrepancy in the approximation. It accounts for the failure of the model to fit the data exactly. In order to construct and calibrate the model, independent variables affecting each trip purpose are chosen, and then for each traffic zone, the most recent data on the variables’ values are collected. These data are generally gathered from origindestination surveys, as well as other sources such as organizations and governmental agencies that are responsible for providing socio-economic information. In many countries in which there is no organized structure for data storage and management, the data collection is a hard stage in the study process. The collected data are then used to estimate the model parameters by Ordinary Least Squares (OLS) method. After parameter estimation, it is necessary to test and validate the model, and then the model is ready to predict the future values of dependent variable, which in the current study is the number of generated trips of particular purpose in each zone. At this stage, it is necessary to use other methods to forecast the values of the independent variables. Regression analysis has disadvantages too [6, 32, 40, 51]. Some crucial limitations that justify the method used in the current study are: proposing the model structure as well as parameter estimation for modeling trip generation by regression needs an extensive data collection including a comprehensive origin-destination survey, of which high costs has been always a problem for decision-makers and researchers. Furthermore, regression is not able to manage satisfactorily on qualitative variables either in terms of interpreting the results or in terms of obtaining a realistic model [17, 55]. Finally, as mentioned earlier, predicting future values of trips produced or attracted, needs other techniques to forecast the values of independent variables as well, and this will arise more inaccuracy.
130
A. A. Rassafi, R. Rezaei and M. Hajizamani
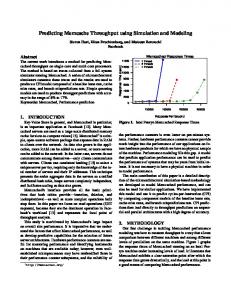
3. Fuzzy Expert Systems Digital data processing for optimizing human decisions has been developed in the recent decades. In order to help managers and decision-makers, management information systems (MIS) were first introduced in 1960. Then in the late 1970s and early 1980s, decision support systems were presented to sponsor management and engineering decisions, of which expert systems are newer [57]. Expert systems have the capability of modeling the expert human opinions towards decision-making, consulting, learning, and research. Expert systems are computer programs that emulate the reasoning process of a human expert or perform in an expert manner in a domain for which no human expert exists. They typically reason with uncertain and imprecise information [28]. There are many sources of imprecision and uncertainty. The knowledge that they embody is often not exact in the same way that a human’s knowledge is imperfect. The facts or user-supplied information is also uncertain. An expert system is typically made up of at least three parts: an inference engine, a knowledge base, and a global or working memory. The knowledge base contains the expert domain knowledge for use in problem solving. The working memory is used as a scratch pad and to store information gained from the user of the system. The inference engine uses the domain knowledge together with acquired information about a problem to provide an expert solution[44]. Expert systems are able to model uncertainty and imprecision by fuzzy expert systems (FES). An FES is simply the combination of the fuzzy set theory and an expert system [30]. As can be seen in Figure 1, an FES usually includes four major parts: A fuzzy rule base, a fuzzification module, an inference engine, and a defuzzification module. The fuzzification module transforms the crisp input values submitted to the FES into fuzzy variables. The inference engine uses the results of the fuzzification module and accesses the fuzzy rules in the fuzzy rule base to infer output values. The final output of the FES is provided by the defuzzification module. There are several methods for defuzzification. To name a few, the average maximum method, the weighted average maxima method, and the method most commonly used, a centroid method [30, 44]. In the current paper the centroid method was chosen because of its wide usage in the literature. Briefly, first, the crisp data is transformed to fuzzy variables, then, reasoning starts based on the available information and rules in knowledge base. Afterwards, the final results of the model are achieved by inference engine in fuzzy format, and finally, the final fuzzy set results turns into crisp values. 4. Application of Computational Intelligence to Transportation Studies Statistical methods have a solid and widely accepted foundations in transportation studies [22]. However, the existence of uncertainty in transportation analysis [25, 26], the rigid relationships dictated by physical principles against the approximate nature of predictions [24], and difficulties lie in working with traditional models [22, 39], justify the use of new sciences in the analyses. Soft computing has been applied to many transportation studies. The body of literature on the applications of this branch of science to transportation studies
Predicting Urban Trip Generation Using a Fuzzy Expert System
131
Figure 1. A Block Diagram of a Fuzzy Expert System [23] is considerably substantial and is still growing too [13, 25, 26, 34, 45, 47, 48, 53]. However, due to the gigantic number of studies devoted to the application of soft computing to this extensive area, the following is only an excerpt of relevant works carried out in road transportation. 4.1. Traffic Flow Modeling. A number of studies was devoted to traffic flow modeling using computational intelligence [9, 20, 54]. One of the major elements of responsive urban traffic control systems is a flow prediction model [54]. Yin et al. developed a fuzzy neural model to predict the flows in an urban street network by classifying input data into a number of clusters using a fuzzy approach and then specifying the input-output relationship as in conventional neural network approach [54]. Dimitriou et al. presented an adaptive hybrid fuzzy rule-based system for modeling and predicting the dynamic evolution of traffic flow in an urban arterial. The proposed system enables the optimal tuning of the parameters involved in the membership functions through employing a Genetic Algorithm optimization method [9]. In another study, incorporation of fuzzy description of traffic flow process, especially its parameters, in the group model was investigated, and the fuzzy version of group model of traffic flow in street networks was presented [20]. Chakroborty and Kikuchi proposed a car following model based on fuzzy inference system, which because of being based on imprecise decision making process of drivers is able to explain the properties of car following behavior, i.e., can overcome the deficiencies of the conventional car following models [4, 5]. 4.2. Network Design. In a different area, fuzzy logic was used to select transportation projects, (a process usually called ‘network design’). Decision makers are faced with the problem of efficiently selecting a subset of transportation projects
132
A. A. Rassafi, R. Rezaei and M. Hajizamani
for implementation, given their limited budget. This selection process is based on multiple objectives, which are often qualitative in their nature, or their complete information is not available. The usual selection methods cannot deal effectively with the decision makers’ preferences or vagueness. Fuzzy sets theory is able to cope with inexact information, and therefore is believed to be an appropriate tool for network design. [36, 50]. 4.3. Traffic Control. Traffic signal control is one of the oldest application areas of fuzzy sets in transportation engineering [35]. More intelligent traffic signal control would make the current roadway system operate more efficiently without building new roadways or widening existing roadways [56]. In the most studies devoted to fuzzy traffic control, fuzzy logic was used for signal timing at a particular intersection to ascertain whether the existing signal phasing is appropriate or not. Traffic in general is controlled by rules, and a rule-based approach gives better control related to how the system should behave. The rules and conditions in signal control are typically vague, and an expert can roughly describe how signals should operate. Therefore, a fuzzy inference rule base can be exploited to control the traffic signal timing [29]. Fuzzy logic based controllers have many advantages because they do not require many detailed mathematical formulas and numerical calculations [19]. The fuzziness of signal control can be divided into three levels: input level, in which there is uncertainty in the situation of the prevailing traffic, control level, where it is not possible to explain the cause/consequence relationship of signal control, and output level, in which, the correct control criteria are not known (for example, extension gap) [35]. 4.4. Estimation of Origin-Destination Matrix. Estimation of origin-destination trip demand matrix from the traffic volume counts of the network links is a very important procedure in travel analysis and transportation planning. The traditional direct estimation methods are usually based on comprehensive survey, making use of (home) interview, and thus are typically expensive [42]. That is why the abovementioned method plays a key role in transportation planning. Shafahi and Faturechi presented a new fuzzy model to estimate the origindestination matrix from traffic counts. They proposed a method that considers the link data as a fuzzy number [42]. Caggiani et al. proposed a Fuzzy generalized least square estimation method that allows to improve the estimation performances of classic generalized least square estimator by including, in addition to traffic counts, uncertain information about starting origin-destination demand [3]. Foulds et al. described a method for estimating origin-destination matrix for congested networks based on a sequence of fuzzy linear programs when the input data were incomplete and imprecise [11]. 4.5. Transportation Demand Modeling. As mentioned earlier, the traditional modeling procedure for urban transportation demand, is called urban transportation planning system, or simply UTPS, which consists of four consecutive stages namely, trip generation, trip distribution, modal split, and traffic assignment [21, 32, 37]. Soft computing has been applied to all these four steps. In trip generation,
Predicting Urban Trip Generation Using a Fuzzy Expert System
133
which is also the focus of the current paper, Shafahi and Abrishami developed neural and fuzzy-neural models to predict attracted school trips to each traffic zone [41]. Shafahi et al. presented a fuzzy estimation model of trip distribution for optional trip purposes including: shopping, personal, and recreation trips by applying a fuzzy rule base enhanced by expert knowledge. They have shown that the fuzzy prediction model will be more accurate. [43]. Modal split (or mode choice in a micro level), is the third step of UTPS, which splits the distributed trips into the possible modes. Prokopowicz and Sotnikov presented a hybrid system combining fuzzy logic and expert systems to evaluate the impact of price and non-price factors on transportation modal split [39]. Tortum et al. described a new approach to mode choice of intercity freight transport modeling using artificial neural networks and adaptive neuro-fuzzy inference system models [49]. Traffic assignment or route choice, perhaps is the most popular field of study to which computational intelligence has been applied. For example, Kim et al. simulated the route choice behavior by a neural network model [27]. Arslan and Khisty proposed a hybrid model that uses fuzzy logic and analytical hierarchy process, in which a set of fuzzy ‘if-then’ rules was developed to represent a typical driver’s decision on route choice [2]. Hawas discussed the calibration of routes’ utility functions and then the simulation the route choice behavior of drivers by a ”rule-based” neuro-fuzzy logic model [16]. Ghatee and Hashemi in a macro view to the problem proposed a traffic assignment problem with fuzzy demand [12]. 4.6. Other Studies. There are many other areas of transportation studies to which different forms of soft computing have been applied. As an example, fuzzy logic has also been utilized in ramp-metering (the use of traffic signals at freeway on-ramps to manage the rate of vehicles entering the freeway) [9, 28, 32, 45]. 5. Fuzzy Expert System as an Alternative Tool to Predict Future Generated Trips It should be noted that the current study makes the use of fuzzy logic and experts system in two different ways: first, it handles data uncertainty or imprecision, and second, it utilizes the experts’ valuable judgments. In the field of transportation study, the first specification reduces the strong need for exact data in both modeling and predicting stages, and hence it is practically a cost-effective alternative solution to ordinary expensive survey-based methods. The second feature, points to the fact that there always is a more realistic picture of study’s situation beyond what is created by rigid models, according to either experts’ experiences and their overall intuitive judgments, or qualitative and ‘non-measurable’ information that affects the case, but cannot be efficiently included in a crisp model. The current study proposes an FES to predict future trips generated by each traffic zone. Instead of using a ‘crisp’ and unique equation relating the dependent variable (trip generation) to a set of independent explanatory variables (such as population, car ownership, etc.), a group of rules is introduced by which reasoning about the data is made. The reasoning scheme is a combination of ‘if-then’ sentences
134
A. A. Rassafi, R. Rezaei and M. Hajizamani
that reconstructs the people’s decisions about how trips are generated in urban traffic zones. The reasoning is based on fuzzy variables. Therefore, there is no need to have exact data for independent variables. For example, the following rule states how population influences on generated trips in a fuzzy manner: if population is low, then produced trips is low. and the following is another example showing the relation between produced trips and population and car ownership: if car ownership rate is medium and population is low, then produced trips is medium. In the next sections, first the conventional regression-based model is created, and then FES is introduced and analyzed. In order to apply the proposed idea to a real problem, Mashhad was chosen and the two, conventional and alternative methods, have been performed and have been compared. Table 1 summarizes the specifications of the two models which will be introduced in the next sections. As can be seen in the table, four variables have been chosen to be considered in further analysis. They are ‘number of work trips produced by each traffic zone’, as the dependent variable, and population, density, average household size, and car ownership of each traffic zone. Density is the number of people living in the unit of area. Average household size of a particular zone is the average number of family members in that zone. Car ownership is the per capita rate of ownership of private cars generally expressed in terms of cars per persons. 5.1. The Data. The data used in this study is a random sample obtained from ‘Mashad Comprehensive Transportation Study (MCTS)’[18]. An origin-destination home-interview survey was made for Mashad (Lon: 59.37 E, Lat: 36.19 N). Mashad, an important city of Iran, is located in the north east of the country with an area of 270 km2 and a population of about 2,400,000, according to the last countrywide census of population and housing in 2006. The study area included 141 internal and 22 external traffic analysis zones (TAZ’s). In addition to travel data, social and economic characteristics of different TAZ’s were gathered from the home-interview and the other relevant resources. Table 2 shows a brief overview of the data. Table 3 represents the correlation coefficients of the variables. Table 3 shows that population correlates significantly with the other variables, the correlations of car ownership with the other variables are not significant, and produced trips variable is highly correlated with the others (except car ownership). In ordinary situations, the correlation matrix can give some pieces of advice to select or not a particular variable, but to make the comparison possible all variables will be considered in the modeling stage. 5.2. The Multiple Leaner Regression Model. Firstly, MLR is used to model work trips produced by each traffic zone. Basically, to model work trips socioeconomical, land use, and sometimes spatial variables such as population, employed population, residential density, average income, car ownership rate (per capita cars owned), distance to CBD (Central Business District) etc..
Predicting Urban Trip Generation Using a Fuzzy Expert System
Dependent Explanatory Calibration Variable (or Variables (or technique THEN part) IF part)
ModelMethod
MLR
Multiple Linnumber of ear Regression work trips produced by each zone
population density household size car ownership
ordinary least squares (OLS)
trial and error (for rules), expert’s judgment (for membership functions)
Fuzzy Expert FES System
135
Strengths - interpretable coefficients, - known causal structure, - distinguished theoretical background for the model, - well-known approaches for different stages of the modeling. - ability to handle uncertain (vague or ambiguous) data, - capability of handling qualitative information, - incorporation of the expert’s valuable experience, - not requiring exact, detailed, and comprehensive data for calibration, - no need to the prediction of independent variables for future estimation of dependent valuable.
Table 1. The Specifications of Two Models
Variable
Symbol
number of work trips produced by each zone population household size car ownership
density
Standard deviation
Coefficient of Variation
39
1955
0.48
117 3.17 0.015 0.61
8157 0.64 0.030 94.59
0.56 0.13 0.50 0.73
Total
Average
Max
Min
TRP
565562
4069
16390
POP HHS OWN DNS
2027763 N.A. N.A. 18097.30
14588 5.02 0.07 130.20
70430 7.25 0.200 459.25
Table 2. A Brief Descriptive Statistics of the Data According to available data and information and analysis results, four variables, which had been introduced in the previous sections, were chosen as the model independent variables. After carrying out a careful analysis, the model will be as follows: y= 0.22P OP - 36.32HHS +8314.91OW N +2.36DN S (R2 = 0.91, F = 158) t →(21.56) (-0.67) (3.78) (2.85)
(2)
The numbers below the variables’ coefficients represent that these statistics. As can be seen all variables except the average household size are statistically
136
A. A. Rassafi, R. Rezaei and M. Hajizamani
TRP POP HHS OWN DNS
Pearson Correlation Sig. (2-tailed) Pearson Correlation Sig. (2-tailed) Pearson Correlation Sig. (2-tailed) Pearson Correlation Sig. (2-tailed) Pearson Correlation Sig. (2-tailed)
TRP 1 .893 .000 .269 .001 -.067 .432 .398 .000
POP .893 .000 1 .369 .000 -.183 .030 .332 .000
HHS .269 .001 .369 .000 1 .030 .723 .233 .005
OWN -.067 .432 -.183 .030 .030 .723 1 .055 .517
DNS .398 .000 .332 .000 .233 .005 .055 .517 1
Table 3. The Correlation Coefficients of the Variables important in a 95% of confidence. The household size can be omitted from the model, however, in order to make a comparison between two methods it remains in the final structure. The coefficient of determination (R2 ) equals 0.81 which is acceptable and its F statistics confirms that the whole model is reliable. 5.3. Proposed Fuzzy Expert System. With the aim of building the study’s FES, first it is needed to construct the knowledge base. In this knowledge base, fuzzy variables and their membership functions are defined and then fuzzy rules are introduced. In order to perform such an analysis, ‘fuzzy wxCLIPS’ software was chosen [46] and variables as well as the rules were defined in that environment. 5.3.1. Definition of Membership Function for Variables. To process the model, variables and their membership functions must be first defined. As mentioned earlier in order to be able to draw a proper comparison, the selected variables which affect trip generation are the same as the regression model. For all variables except two ones (population and work trips), three fuzzy sets (labeled as ‘low’, ‘medium’ and ‘high’) have been chosen. Further, due to the wide range of values, the fuzzy set ‘very high’ has been chosen in addition to the three above-mentioned sets for the two latter variables. The membership functions of the aforesaid fuzzy sets were defined according to prevailing judgment about them and based on knowledge and experience. The membership functions for the fuzzy sets of five variables (i.e. population, household size, car ownership, population density and produced work trips of each zone) have been formed by triangular and trapezoidal membership functions. Figure 2 shows the fuzzy variables used in the current study. The problem of constructing membership functions as well as the problem of determining meanings of associated operations on the linguistic terms belong to the general problem area of knowledge acquisition and ‘knowledge engineering’ [28]. There are several methods for constructing a membership function. These methods can be categorized as either being manual or automatic. The manual methods include direct and indirect one each with either one expert or multiple experts. The automatic methods use sample data to construct the membership function in different ways [8, 28]. Moreover, a membership function can be calibrated (or tuned)
Predicting Urban Trip Generation Using a Fuzzy Expert System
137
by different techniques such as genetic algorithm [7], trial and error [4], etc.. The current study has made the membership functions in a direct approach with one expert. Besides the expert’s experience and insight about the case, the statistical characteristics of five predefined variables (like their dispersions, ...) assisted with the formation of the linguistic variables. 5.3.2. Fuzzy Rules Definition. In order to perform reasoning, fuzzy rules should be defined. The rules reflect the influence of independent variables on the produced work trips. Fuzzy rules are based on an ‘if-then’ structure, in which, the ‘if’ parts include 4 independent variables and the ‘then’ parts include the dependent variable. For a careful fuzzy reasoning, kind of trial and error tuning was used. In order to improve the accuracy of the outputs, several combinations of rules were examined, and finally 112 rules defined for the current study. The trial and error procedure confirmed that population plays a key role in predicting produced trips. Therefore, among the 112 rules introduced to the rule base, 4 rules show relation between population and produced work trips. Other rules attempt to relate the combination of independent variables (in if part) to the dependent one (in then part). The ‘if’ parts of 12 rules include population and car ownership, and 12 rules include population and household size. In 36 rules three variables, population, household size and population density and in the other 36 rules three variables population, car ownership, and population density has been considered as the independent variable. 5.3.3. Preparing the Fuzzy Expert System. To construct the study’s FES, the Fuzzy wxCLIPS Software is used [46]. Firstly, variables and rules are defined according to the software format. Then, a GUI (Graphical User Interface) was designed to acquire the data, and represent the results. Figure 3, shows a screenshot of the GUI. 5.3.4. Running the Model. After preparing the EFS, it is now possible to run the model and predict produced work trips for each traffic zone. The values for each explanatory independent variable are entered to the model for each traffic zone. The values can be either fuzzy (such as very low, more a less high, etc.) or even crisp (ordinary numbers). One of the strengths of fuzzy logic is that you can create new fuzzy sets based on the initial ones using hedges or modifiers (expressions such as ‘very’, ‘slightly’, ‘more or less’, etc.). Therefore, the number of fuzzy sets for each variable is much more than its original three or four sets. The software outputs the number of trips produced in each traffic zone in terms of crisp values after defuzzification of predicted fuzzy values for produced trips gained by firing the rules in the knowledge base. As mentioned earlier there are several methods for defuzzification. In current paper the centroid method was chosen because of its wide usage in the literature. 5.4. Validation. Number of trips produced in each traffic zone found by the conventional MLR method is used to draw a comparison, and hence, to assess the validity of proposed model. Figure 4 shows the predicted values of produced trips versus observed ones, and Table 4 represents the goodness of fit as well as analysis
138
A. A. Rassafi, R. Rezaei and M. Hajizamani
Figure 2. The Definition of Fuzzy Variables of variance of the MLR model. The regression equation that quantitatively characterizes this relationship, has been given both in the figure and table. As can be seen either in figure or in equation, the regression model has an acceptable performance. The coefficient of determination (R2) is 0.81, and the F statistic equals 517.85, which implies a significant value for R2 and hence a good performance for the whole model. The mean square error (MSE) is 714701.2. Comparison of total values of observed produced trips with predicted ones shows that the model is slightly underestimating. Similarly, Figure 5 portrays the situation of FES predicted values of produced work trips versus observed ones and the inserted equation mathematically defines the representative line of this relationship. Table 5 also gives an insight about the overall performance of the FES model. The coefficient of determination (R2) equals 0.79, with an F statistics of 602.70, which means and overall acceptable performance of the FES model. The mean square error of the FES is 642763.9, which is less than that of MLR implying that the FES is better than the MLR
Predicting Urban Trip Generation Using a Fuzzy Expert System
Figure 3. A Screenshot of the FES’s GUI
Figure 4. Produced Trips of Zones Estimated by the MLR Method
139
140
A. A. Rassafi, R. Rezaei and M. Hajizamani
Regression Statistics Multiple R 0.90 R Square 0.81 Adjusted R 0.81 Square Standard 801.73 Error 140 Observations ANOVA df Regression Residual Total
Intercept Observed Trips
1 138 139
SS MS 3.7E+08 3.7E+08 98628767 714701.2 4.69E+08
Coeffic- Standard ients Error 592.37 154.60 0.84
0.03
Significance F 517.85 0.00 F
t Stat 3.83
P- Lower value 95% 0.00 286.69
24.55
0.00
0.78
Upper 95% 898.06 0.91
Table 4. The Statistical Measures for the Performance of MLR Method (from MSE view). Total values of zonal trips predicted by FES shows (to some extent) an overestimation of observed ones. Comparison of two methods confirms that the performance of proposed method is as good as that of MLR. 5.5. Discussion. Comparison of two methods shows that FES can be a good competitor for MLR method. The difference between total predicted trips by MLR and observed ones is about -0.89%, and the similar measure for FES method is about 4.71% which are acceptable. These values show that the MLR model is slightly underestimating, while total values of zonal trips predicted by FES are an overestimation of observed ones. The coefficients of determination (R2) of MLR and FES are 0.81, 0.79, respectively, and their F statistic confirm significant values for R2. Comparison of two values proves that the performance of proposed method is as good as that of MLR (0.02 difference in R2 values is negligible). In addition, the mean square errors (MSE) are 714701.2 and 642763.9, for MLR and FES, respectively, which indicates a slightly better performance of the proposed method. In general, it can be seen that the proposed method operates as good as that of MLR. It should be noted that the FES method has used inexact inputs to predict trips. This is a very important issue, because the proposed method obviates the need for gathering accurate and detailed data about population and other explanatory variables. This is an expensive stage in the process of urban transportation planning system. Furthermore, in order to be able to predict future trips, more attempts are needed to find (estimate) the values of independent variables in the desired future time for each zone. In other words, almost the same results have been achieved with a comparatively inexpensive method.
Predicting Urban Trip Generation Using a Fuzzy Expert System
141
Figure 5. Produced Trips of Zones Estimated by the FES Method Regression Statistics Multiple R 0.89 R Square 0.79 Adjusted R 0.79 Square Standard 845.40 Error 140 Observations ANOVA df Regression Residual Total
Intercept Observed Trips
1 138 139
Significance SS MS F F 3.87E+08 3.87E+08 602.70 0.00 88701422 642763.9 4.76E+08
Coeffic- Standard ients Error 893.95 163.02 0.83
0.04
t Stat 5.48
P- Lower value 95% 0.00 571.61
22.76
0.00
0.75
Upper 95% 1216.29 0.90
Table 5. The Statistical Measures for the Performance of FES Method
142
A. A. Rassafi, R. Rezaei and M. Hajizamani
Comparison of the predicted values shows that for the zones with lower population, the predicted values by FES are closer to the relevant observations as compared to the MLR. Tuning of the fuzzy rule base showed that population is the most important variable in trip production estimation. The regular models have already confirmed this conclusion. In brief, in MLR the coefficients (parameters) are interpretable, and the cause and effect structure of models can be found. In addition, theoretical background of MLR helps the researchers to analyze their case more carefully. Further, there are many well-known approaches, algorithms, and softwares for this method. On the other hand, FES has the ability to handle uncertain (vague or ambiguous) data, capability of handling qualitative information, and incorporation of the expert’s valuable experience. It does not require exact, detailed, and comprehensive data for calibration, as well as the prediction of independent variables for future estimation of dependent valuable. 6. Summary and Conclusion The current study is an endeavor to construct an alternative way for predicting generated trips. The conventional method, multiple linear regression, is still a strong tool in prediction, but it faces inherent limitations. The main issue, on which the current study has focused, is the dependence of MLR on relatively exact data. This method predicts the number of trips produced from, or attracted to each traffic zone according to the values of independent variables for that zone. One of the main limitations of this method is its huge dependence on the exact prediction of independent variables in the future (horizon of the plan). Therefore, in order to be able to do MLR, a thorough and detailed survey is needed to find the effective variables and the way they impact on the dependent variable. A systematic approach to predict the future values of the independent variables is also needed to complete the prediction process. Furthermore, the other limitation is its many assumptions, which raise challenging questions of its application. Comparison of the predicted values showed that for the zones with lower population, the predicted values by FES were closer to the relevant observations as compared to the MLR. Tuning of the fuzzy rule base showed that population is the most important variable in trip production estimation: The conclusion which the regular models have already confirmed. The values of total predicted trips showed that the MLR model was slightly underestimating, while total values of zonal trips predicted by FES were an overestimation of observed ones. The coefficients of determination of MLR and FES proved that the performance of proposed method was as good as that of MLR. In addition, the mean square errors (MSE) for MLR and FES indicated a slightly better performance of the proposed method. In general, it can be seen that the proposed method operates as good as that of MLR. In MLR the coefficients (parameters) are interpretable, and the cause and effect structure of models can be found. In addition, theoretical background of MLR helps the researchers to analyze their case more carefully. Further, there are many well-known approaches, algorithms, and softwares for this method. On the other
Predicting Urban Trip Generation Using a Fuzzy Expert System
143
hand, FES has the ability to handle uncertain (vague or ambiguous) data, capability of handling qualitative information, and incorporation of the expert’s valuable experience. It does not require exact, detailed, and comprehensive data for calibration, as well as the prediction of independent variables for future estimation of dependent valuable. In brief, the fuzzy expert system proposed in the current study uses inexact information for input variables to predict future trips, and thus it is an economical approach. Because the predicted future trips are generally use for planning purposes, loss of precision in FES does not considerably influence the final plan. Acknowledgements. The authors wish to thank the Institute for Transportation Studies and Research of the Sharif University of Technology for providing the sample data, and Imam Khomeini International University for partial funding of the study. References [1] A. R. Arabpour and M. Tata, Estimating the parameters of a fuzzy linear regression model, Iranian Journal of Fuzzy Systems, 5(2) (2008), 1-19. [2] T. Arslan and C. J. Khisty, A rational reasoning method from fuzzy perceptions in route choice, Fuzzy Sets and Systems, 150 (2005), 419-435. [3] L. Caggiani, M. Ottomanelli and D. Sassanelli, A fixed point approach to origin-destination matrices estimation using uncertain data and fuzzy programming on congested networks, Transportation Research Part C: Emerging Technologies, In Press, Corrected Proof, 2011. [4] P. Chakroborty and S. Kikuchi, Calibrating the membership functions of the fuzzy inference system: instantiated by car-following data, Transportation Research Part C: Emerging Technologies, 11(2) (2003), 91-119. [5] P. Chakroborty and S. Kikuchi, Evaluation of the general motors based car-following models and a proposed fuzzy inference model, Transportation Research Part C, 7 (1999), 209-235. [6] S. Chattefuee and A. S. Hadi, Regression analysis by example, Fourth Edition, In: W. A. Shewhart and S. S. Wilks, eds., Wiley Series in Probability and Statistics: John Wiley and Sons, Inc., 2006. [7] O. Cordon, F. Herrera, F. Hoffmann and L. Magdalena, Genetic fuzzy systems evolutionary tuning and learning of fuzzy knowledge bases, In: K. Hirota, et al., eds., Advances in Fuzzy Systems - Applications and Theory, Sinqgapore: World Scientific, 19 (2001). [8] I. Derbel, N. Hachani and H. Ounelli, Membership Functions Generation Based on Density Function, In: IEEE International Conference on Computational Intelligence and Security, IEEE, 2008. [9] L. Dimitriou, T. Tsekeris and A. Stathopoulos, Adaptive hybrid fuzzy rule-based system approach for modeling and predicting urban traffic flow, Transportation Research Part C: Emerging Technologies, 16(5) (2008), 554-573. [10] T. A. Domencich and D. Mcfadden, Urban travel demand: a behavioral analysis, In: D. W. Jorgenson and J. Waelbroeck, eds., Contributions to Economic Analysis, Amsterdam, Oxford: North-Holland Publishing Company, 1975. [11] L. R. Foulds, H. A. D. D. Nascimento, I. C. A. C. Calixto, B. R. Hall and H. Longo, A fuzzy set approach to estimating od matrices in congested brazilian traffic networks, In: XLIII Simp´ osio Brasileiro de Pesquisa Operacional, XLIIISBPO, 2011. [12] M. Ghatee and S. M. Hashemi, Traffic assignment model with fuzzy level of travel demand an efficient algorithm based on quasi-logit formulas, European Journal of Operational Research, 194 (2009), 432-451. [13] A. Golnarkar, A. A. Ale Sheykh and M. R. Malek, Solving best path problem on multimodal transportation networks with fuzzy costs, Iranian Journal Of Fuzzy Systems, 7(3) (2010), 1-13.
144
A. A. Rassafi, R. Rezaei and M. Hajizamani
[14] H. Hassanpour, H. R. Maleki and M. A. Yaghoobi, A note on evaluation of fuzzy linear regression models by comparing membership functions, Iranian Journal of Fuzzy Systems, 6(2) (2009), 1-6. [15] H. Hassanpour, H. R. Maleki and M. A. Yaghoobi, Fuzzy linear regression model with crisp coefficients: a goal programming approach, Iranian Journal of Fuzzy Systems, 7(2) (2010), 19-39. [16] Y. E. Hawas, Development and calibration of route choice utility models: neuro-fuzzy approach, ASCE Journal of Transportation Engineering, 130(2) (2004), 171-182. [17] R. L. Hurst, Qualitative variables in regression analysis, American Educational Research Journal, 7(4) (1970), 541-552. [18] Institute for Transportation Research and Studies, Mashad comprehensive transportation study, Sharif University of Technology: Tehran, Iran, 2000. [19] P. Jain, Automatic traffic signal controller for roads by exploiting fuzzy logic, In: V. V. Das, J. Stephen, and Y. Chaba, eds., Computer Networks and Information Technologies, Springer Berlin Heidelberg, (2011), 273-277. [20] M. Kaczmarek, Fuzzy group model of traffic flow in street networks, Transportation Research Part C: Emerging Technologies, 13(2) (2005), 93-105. [21] A. K. Kanafani, transportation demand analysis, Mcgraw-Hill Series in Transportation, New York: McGraw-Hill, 1983. [22] M. G. Karlaftis and E. I. Vlahogianni, Statistical methods versus neural networks in transportation research: differences, similarities and some insights, Transportation Research Part C: Emerging Technologies, 19(3) (2011), 387-399. [23] N. K. Kasabov, Foundations of neural networks, fuzzy systems, and knowledge engineering, Cambridge, Mass.: MIT Press, 1996. [24] S. Kikuchi, Fuzzy sets theory approach to transportation problems, artificial intelligence in transportation, Transportation Research Board: Washington DC, 2007. [25] S. Kikuchi and P. Chakroborty, Place of possibility theory in transportation analysis, Transportation Research Part B: Methodological, 40(8) (2006), 595-615. [26] S. Kikuchi and M. Pursula, Treatment of uncertainty in study of transportation: fuzzy set theory and evidence theory, ASCE Journal of Transportation Engineering, 124(1) (1998). [27] K. Kim, D. Kim and H. Seo, Neural network architecture for the estimation of drivers’ route choice, KSCE Journal of Civil Engineering, 6(3) (2002), 329-336. [28] G. J. Klir and B. Yuan, Fuzzy sets and fuzzy logic: theory and applications, New Delhi: Prentice-Hall, 2002. [29] I. Kosonen, Multi-agent fuzzy signal control based on real-time simulation, Transportation Research Part C, 11 (2003), 389-403. [30] C. T. Leondes, ed., Fuzzy logic and expert systems applications, Neural Network Systems: Techniques and Applications, Academic Press, 6 (1998). [31] K. K. Lim and S. Srinivasan, A comparative analysis of alternate econometric structures for trip-generation models, In: Transportation Research Board Annual Meeting, Washington DC, USA: Transportation Research Board, 2011. [32] M. D. Meyer and E. J. Miller, Urban transportation planning: a decision-oriented approach, 2nd edition, Mcgraw-Hill Series in Transportation, Boston: McGraw-Hill, 2001. [33] J. L. Mwakalonge and D. A. Badoe, Data collected in single and repeated cross-sectional surveys, In: Transportation Research Board Annual Meeting, Washington DC, USA: Transportation Research Board, 2011. [34] S. M. A. Nayeem and M. Pal, The p-center problem on fuzzy networks and reduction of cost, Iranian Journal of Fuzzy Systems, 5(1) (2008), 1-26. [35] J. Niittymaki and M. Pursula, Signal control using fuzzy logic, Fuzzy Sets and Systems, 22(2) (2000), 11-22. [36] I. Nosoohi and S. N. Shetab-Boushehri, A conceptual methodology for transportation projects selection, International Journal of Industrial Engineering and Production Research, 22(2) (2011), 83-90.
Predicting Urban Trip Generation Using a Fuzzy Expert System
145
[37] J. D. D. Ort´ uzar and L. G. Willumsen, Modelling transport, Fourth edition, Chichester, West Sussex, United Kingdom: John Wiley and Sons, 2011. [38] S. Pourahmad, S. M. T. Ayatollahi and S. M. Taheri, Fuzzy logistic regression: a new possibilistic model and its application in clinical vague status, Iranian Journal of Fuzzy Systems, 8(1) (2011), 1-17. [39] A. K. Prokopowicz and V. Sotnikov, An application of a hybrid fuzzy logic and expert system to transportation modal split evaluation, In: IEEE Intelligent Transportation Systems Conference Proceedings, Oakland (CA), USA: IEEE, 2001 [40] J. O. Rawlings, S. G. Pantula and D. A. Dickey, Applied regression analysis: a research tool, Springer, 1998. [41] Y. Shafahi and E. S. Abrishami, School trip attraction modeling using neural and fuzzyneural approaches, In: Proceedings of the 8th International IEEE Conference on Intelligent Transportation Systems, Vienna, Austria, 2005. [42] Y. Shafahi and R. Faturechi, A new fuzzy approach to estimate the o-d matrix from link volumes, Transportation Planning and Technology, 32(6) (2009), 499-526. [43] Y. Shafahi, S. M. Nourbakhsh and S. Seyedabrishami, Fuzzy trip distribution models for discretionary trips, In: Proceedings of the 11th International IEEE Conference on Intelligent Transportation Systems, Beijing, China: IEEE, 2008. [44] W. Siler and J. J. Buckley, Fuzzy expert systems and fuzzy reasoning, John Wiley and Sons, Inc., 2005. [45] S. N. Sivanandam, S. Sumathi and S. N. Deepa, Introduction to fuzzy logic using matlab, Berlin , New York, Springer, 2007. [46] J. Smart, Wxclips user manual, Artificial Intelligence Applications Institute, University of Edinburgh, 1995. [47] D. Teodorovic, Fuzzy sets theory applications in traffic and transportation, European Journal of Operational Research, 74 (1994), 379-390. [48] D. Teodorovic and K. Vukadinovic, Traffic control and transport planning: a fuzzy sets and neural networks approach, International Series in Intelligent Technologies, Boston: Kluwer Academic Publishers, 1998. [49] A. Tortum, N. Yayla and M. G¨ okdag, The modeling of mode choices of intercity freight transportation with the artificial neural networks and adaptive neuro-fuzzy inference system, Expert Systems with Applications, 36 (2009), 6199-6217. [50] G. H. Tzeng and J. Y. Teng, Transportation investment project selection with fuzzy multiobjectives, Transportation Planning and Technology, 17(2) (1993), 91-112. [51] S. P. Washington, M. G. Karlaftis and F. L. Mannering, Statistical and econometric methods for transportation data, CRC Press, 2003. [52] S. Weisberg, Applied linear regression, In: D. J. Balding, et al., eds., Wiley Series in Probability and Statistics, Hoboken, New Jersey: John Wiley and Sons, Inc., 2005. [53] G. Yaldi and M. a. P. Taylor, Examining the possibility of fuzzy set theory application in travel demand modelling, Journal of the Eastern Asia Society for Transportation Studies, 8 (2010). [54] H. Yin, S. C. Wong, J. Xu and C. K. Wong, Urban traffic flow prediction using a fuzzy-neural approach, Transportation Research Part C: Emerging Technologies, 10(2) (2002), 85-98. [55] F. Young, J. D. Leeuw and Y. Takane, Regression with qualitative and quantitative variables: an alternating least squares method with optimal scaling features, Psychometrika, 41(4) (1976), 505-529. [56] L. Zhang, H. Li and P. D. Prevedouros, Signal control for oversaturated intersections using fuzzy logic, In: Transportation Research Board Annual Meeting, Washington DC, USA, 2005. [57] H. J. Zimmermann, Fuzzy set theory and its applications, Third Edition: Kluwer Academic Publishers, 1996. Amir Abbas Rassafi∗ , Faculty of Engineering, Imam Khomeini International University, Qazvin, 34149, Iran E-mail address:
[email protected]
146
A. A. Rassafi, R. Rezaei and M. Hajizamani
Roohollah Rezaei, Faculty of Engineering, Imam Khomeini International University, Qazvin, 34149, Iran E-mail address: te
[email protected] Mehdi Hajizamani, MIT-Portugal Program, Instituto Superior Tcnico, Technical University of Lisbon, Lisbon, Portugal E-mail address:
[email protected] *Corresponding author