International Journal of Pharmaceutical Sciences and Nanotechnology Volume 2 • Issue 1 • April – June 2009
Research Paper
Preparation, Optimization and Characterization of Ketoprofen Proniosomes for Transdermal Delivery Ajay B Solanki1*, Jolly R Parikh1 and Rajesh H Parikh2 1
Department of Pharmaceutics and Pharmaceutical Technology, A. R. College of Pharmacy & G. H. Patel Institute of Pharmacy, P.O. Box 19, Vallabh Vidyanagar -388 120 Gujarat, India. 2
Ramanbhai Patel College of Pharmacy, Education campus, Changa 388 421 Gujarat, India.
ABSTRACT:
The aim of the present study was to prepare, optimize and characterize ketoprofen proniosomes. The niosomes were prepared using a slurry method followed by in vitro evaluation after embedding the proniosomes-derived niosomes into a carbopol matrix. A central, composite Box-Wilson design was used for the optimization with the total lipid concentration (X1), surfactant loading (X2) and amount of drug (X3) as the independent variables. Prepared proniosomes were characterized for percentage drug entrapment (PDE) and mean volume diameter (MVD). Multiple regression analysis and contour plots were used to relate the dependent and independent variables. Checkpoint batches were also prepared to prove the validity of the evolved mathematical model and contour plots. The optimization model predicted the levels of X1, X2 and X3 (-1, -0.3 and 0.92, respectively), for a maximized response of PDE with constraints of ≤ 5 μm on MVD. Optimized batch was used to prepare a niosomal gel, which showed significantly higher cumulative amount of drug permeated and steady state transdermal flux compared to plain gel. This work has demonstrated the use of the central composite BoxWilson design, regression analysis, and contour plots in optimizing ketoprofen proniosomes. Developed niosomal gel formulation has also demonstrated permeation enhancement of ketoprofen compared to plain gel.
KEYWORDS:
Proniosomes, Niosomes, Ketoprofen, Central composite Box-Wilson design, Optimization, In vitro
permeation.
Introduction Drug delivery systems using vesicular carriers such as liposomes and niosomes have distinct advantages over conventional dosage forms (Schreier et al., 1994). They may serve as a solubilization matrix, as local depot, as permeation enhancer or as a rate limiting membrane barrier for the modulation of systemic absorption of drugs via the skin (Fang et al., 2001a). Niosomes are non-ionic surfactant vesicles that can entrap solute in a manner analogous to liposomes. All the methods traditionally used for the preparation of niosomes are time consuming and many involve specialized equipment (Blazek-Welsh and Rhodes, 2001a). A proniosome formulation based on maltodextrin was recently developed that has potential applications in delivery of hydrophobic or amphiphilic drugs (BlazekWelsh and Rhodes, 2001b; Hu and Rhodes, 1999). Effect of different formulation variables on proniosomes characteristics can be studied using slurry method because of the ease of production. One of the different mechanisms * For correspondence: Ajay Solanki E-mail:
[email protected]
413
of drug permeation through skin from vesicles is direct transfer of drug from vesicles to skin that occurs only when the drug is intercalated within bilayers (Fang et al., 2001b). To achieve better permeation of drug through skin it is desired to prepare a proniosomes with maximum drug entrapment. Many formulation variables like lipid concentration, surfactant loading, and amount of drug may affect the characteristics of proniosome-derived niosomes. The proniosomes are thus of interest from a technical point of view and need to be optimized for desired response. Hence, in the present study total lipid concentration (X1), surfactant loading (X2) and amount of drug (X3) were selected as independent variables and optimized for the percentage drug entrapment (PDE) and mean volume diameter (MVD) using central composite Box-Wilson design. Vesicles are usually applied to the skin as liquids or gels (Alsarra et al., 2005). For transdermal application of vesicles in gel form, hydrophilic polymers are compatible and considered to be suitable thickening agents. Ketoprofen is a nonsteroidal anti-inflammatory drug with well-established analgesic and antipyretic properties. It is widely used in the treatment of rheumatoid arthritis,
414
International Journal of Pharmaceutical Sciences and Nanotechnology
osteoarthritis, and a variety of other acute and chronic musculoskeletal disorders (Kantor, 1986). Oral therapy of ketoprofen is very effective, but the clinical use is often limited because of the adverse effects such as irritation and ulceration of the gastro intestinal tract. Ketoprofen possesses lower molecular weight (254.29) and relatively short half-life (1-3 hours) in plasma, and has the potential to be delivered topically. The transdermal drug delivery has been considered to be ideal route for ketoprofen administration (Wu et al., 2001). Therefore, the present study was aimed at optimizing ketoprofen proniosomes for desired response followed by in vitro evaluation after embedding the proniosomederived niosomes in to a carbopol matrix with a view to improve the penetration of drug.
Materials and Methods Span 40 and cholesterol were purchased from S.D. Fine Chemicals. (Mumbai, India). Ketoprofen was received as a gift sample from Alembic chemicals. (Vadodara, India). Diethyl ether, disodium hydrogen phosphate, potassium dihydrogen phosphate and sodium chloride were procured from National Chemicals. (Vadodara, India). Dialysis tube (DM-70; Capacity: 2.41ml/cm, width: 29.31 mm, Avg. diameter 17.5 mm and molecular weight cut off: 12000 to 14000) was purchased from Himedia Laboratories. (Mumbai, India). All chemicals used in the study were of analytical grade and used without further purification. Rats (albino, wistar strains) were kindly provided by Cadila Pharmaceutical ltd. (Ahmedabad, India).
Experimental Design A central, composite Box-Wilson design consists of 8 full factorial design points, 6 axial points, and 6 center points (Li et al., 2001). Independent variables with their levels and the dependent variables selected are listed in the Table 1. The Polynomial equation generated by this experimental design using Microsoft Excel is described as equation 1:
Volume 2 • Issue 1 • April - June 2009
Where Yi is the dependent variable while b0 is the intercept; b1 to b33 are the regression coefficients; and X1, X2 and X3 are the independent variables (Box and Behnken, 1960) and levels of independent variables were selected from the preliminary experiments.
Preparation of proniosomes Proniosomes were prepared by the slurry method (BlazekWelsh and Rhodes, 2001a). 250 mmol stock solution of span 40 and cholesterol were prepared in the diethyl ether for the ease of preparation. All the batches were prepared according to experimental design given in Table 2. The required volume of span 40 and cholesterol stock solution per gram of carrier and drug dissolved in diethyl ether were taken in to 100 ml round bottom flask containing maltodextrin as a carrier. Additional diethyl ether was added to form slurry in case of lower surfactant loading. The flask was attached to rotary flash evaporator (EIE-R, India.) to evaporate diethyl ether at 60-70 rpm, under 200 mm of Hg vacuum until mass in the flask resulted in a dry free flowing product. These prepared proniosomes were used for niosomes preparation and surface characterization by scanning electron microscopy (SEM). Proniosomes were transformed to niosomes by hydrating with phosphate buffer saline (PBS) pH 7.4 at 80 0 C using vortex mixer for 2 minutes. The niosomes were sonicated twice for 30 seconds using a 250-W probe-type sonicator (MAGNA-PAK-250, Libra Ultrasonic, India). Niosomes were characterized for morphology, PDE and vesicle size in terms of MVD. Proniosome-derived niosomes (optimized batch) were used to prepare niosomal gel. For this purpose equivalent amount of niosomal suspension containing 0.5 g drug was centrifuged and the pellets obtained were mixed with 0.9% w/v carbopol dispersion and made it viscous using 5% w/v triethanolamine solution. This prepared niosomal gel was subjected to in vitro permeation study.
Yi = b0 + b1X1 + b2X2 + b3X3 + b12X1X2 + b13X1X3 + (1) b23X2X3 + b11X12 + b22X22 + b33X32 Table 1 Independent variables with their levels in Central Composite Box-Wilson design. Independent variables
Levels Low
Medium
High
10 mmol
15 mmol
20 mmol
X2 = Surfactant loading
1.5 X
3X
4.5 X
X3 = Amount of drug
4 mg
6 mg
8 mg
Transformed values
-1
0
1
X1 = Total lipid concentration
Y1 = Percentage drug entrapment Y2 = Mean Volume Diameter
Ajay Solanki B et al. : Preparation, Optimization and Characterization of Ketoprofen Proniosomes for Transdermal Delivery
415
Table 2 Central Composite, Box-Wilson design with measured responses. Batch Code
X1
X2
X3
PDE* ± SD
MVD (μm)
PK1
-1
-1
-1
71.64 ± 2.32
3.88
PK2
1
-1
-1
82.62 ± 1.8
5.85
PK3
-1
-1
1
56.81 ± 1.35
4.2
PK4
1
-1
1
73.69 ± 2.46
6.29
PK5
-1
1
-1
69.17 ± 1.42
4.74
PK6
1
1
-1
79.51 ± 1.93
5.87
PK7
-1
1
1
54.48 ± 2.54
6.9
PK8
1
1
1
74.54 ± 2.68
8.08
PK9
-1.68
0
0
59.5 ± 1.24
5.28
PK10
1.68
0
0
78.63 ± 1.75
7.16
PK11
0
0
-1.68
79.8 ± 1.12
5.81
PK12
0
0
1.68
61.22 ± 1.64
5.86
PK13
0
-1.68
0
71.7 ± 1.57
4.12
PK14
0
1.68
0
69.88 ± 1.46
7.13
PK15
0
0
0
69.26 ± 2.04
5.48
PK16
0
0
0
68.86 ± 1.3
5.42
PK17
0
0
0
71.54 ± 1.62
5.29
PK18
0
0
0
67.4 ± 1.78
5.37
PK19
0
0
0
70.3 ± 1.57
5.43
PK20
0
0
0
69.84 ± 1.2
6.1
*n = 3
Optical Microscopy The morphology of hydrated niosomes was observed using optical microscope (Medilux-207R (II), Kyowa-Getner, India). The niosome dispersion after suitable dilution was mounted on glass slide and viewed under a microscope with a magnification of 1200X.
Determination of PDE Ketoprofen within proniosome-derived niosomes was estimated after removing unentrapped drug by the method of dialysis (New, 1990). The dialysis was carried out by taking niosomal dispersion in dialysis tube (donor compartment), which was dipped in a beaker containing 400 ml of PBS pH 7.4 (receptor compartment). The beaker was kept on a magnetic stirrer, rotated at a speed of 80 120 rpm and run for 4 hours. After 4 hours, the solution of receptor compartment was estimated for unentrapped ketoprofen at 261 nm using an UV spectrophotometer (UV 1601, Shimadzu, Japan). The PDE in the niosomes was calculated from the ratio of the difference of the total amount of drug added and amount of unentrapped drug detected to the total amount of drug added.
Measurement of vesicle size The vesicle dispersion was diluted about 100 times in the same buffer, used for their preparation. Vesicles size was
measured as MVD on a particle size analyzer (Laser diffraction particle size analyzer, Sympatec, Germany). The apparatus consist of a He-Ne laser beam of 632.8 nm focused with a minimum power of 5 mW using a fourier lens [R-5] to a point at the center of multielement detector and a small volume sample holding cell (Su cell) The sample was stirred using a stirrer before determining the particle size.
In vitro skin permeation study (optimized batch) The abdominal hair of albino rats (wistar strain), weighing 200 ± 20 gm, was shaved using hand razor. After anesthetizing the rats with ether, the abdominal skin was surgically removed from the animal, and adhering subcutaneous fat was carefully cleaned. To remove extraneous debris and leachable enzymes, the dermal side of the skin was kept in contact with a physiological saline solution for 1 h before starting the permeation experiment. The in vitro rat skin permeation study was carried out as per the guidelines compiled by CPCSEA (Committee for the Purpose of Control and Supervision of Experiments on Animal, Ministry of Culture, Government of India) and all the study protocols were approved by the local institutional Animal Ethics Committee. The permeation of drug from niosomal gel formulations was determined by
416
International Journal of Pharmaceutical Sciences and Nanotechnology
using Franz diffusion cell. The excised rat skin was mounted on the receptor compartment with the stratum corneum side facing up-wards into the donor compartment. The donor compartment was filled with the niosomal gel formulation. A 15 ml of pH 7.4-phosphate buffer containing 10% PEG was used as receptor medium to maintain a sink condition. The available diffusion area of cell was 3.14 cm2. The receptor compartment was maintained at 37 ± 1 0C, with magnetic stirring at 600 rpm. The samples from the receptor compartment were withdrawn at predetermined time intervals and immediately replaced by an equal volume of fresh buffer solution. Initial experiments confirmed the maintenance of sink condition by this procedure. The samples withdrawn from the receptor compartment were then analyzed by using U V spectrophotometer.
Volume 2 • Issue 1 • April - June 2009
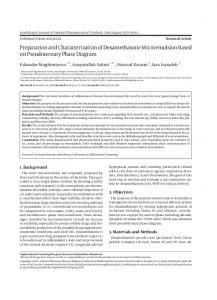
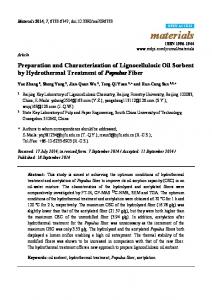
Results and Discussion Maltodextrin was used as a carrier for the preparation of proniosomes. SEM images (Figure 1) of uncoated maltodextrin and proniosomes powders showed differences in the surfaces. Comparison of the proniosomes images revealed that the surface of the carrier particles at medium level of surfactant loading (Batch PK15) appeared to be smoother, continuous and more uniform than the incomplete film coating at low surfactant loading (Batch PK2). This may be due to more amount of carrier present than required for coating of the surfactant mixture at low level of surfactant loading. Niosomes were observed mostly spherical in shape with few being slightly elongated in the optical micrograph (Figure 2).
Fig. 1 Scanning electron micrographs of various batches of ketoprofen proniosomes.
Fig. 2 Optical photomicrograph of proniosome-derived niosomes (Batch PK2)
Ajay Solanki B et al. : Preparation, Optimization and Characterization of Ketoprofen Proniosomes for Transdermal Delivery
term total lipid concentration (X1) for PDE represents a favourable effect. This may be due to more availability of the surfactant at high level of X1 resulting in A high value of PDE. A negative signs for the coefficient of the terms X2 and X3 indicate antagonistic effect of these variables on PDE of ketoprofen proniosomes. A positive signs for the coefficient for all three key variables indicate favorable effect on MVD.
A Central, composite Box Wilson experimental design using three independent variables at their three different levels was used to study their effects on the dependent variables. This design offers an advantage of fewer experimental runs (20 runs) as compared with that of 33 full factorial design, which requires 27 runs (Box and Behnken, 1960). All the batches of proniosomes were prepared as per the experimental design and then hydrated to form niosomes. Transformed values of all the batches along with their responses are shown in Table 2. PDE value of different formulations showed wide variation i.e. from minimum 54.48% to maximum 82.62%. This clearly indicates that the selected independent variables have a profound effect on the PDE within proniosome-derived niosomes. Formulations PK2, PK6, PK10 and PK11 exhibited high PDE value i.e. > 75%.
As illustrated in Table 4, a P value of ≤ 0.05 for independent variables and their interaction in analysis of variance (ANOVA) indicates significant effect of the corresponding factors on the PDE and MVD. The terms X1, X3 and X1X3 having a P < 0.05 (Table 4) indicate significant effect of these terms on PDE of ketoprofen proniosomes. Further, from the results of ANOVA, it is clear that the terms X1, X2, X3 and X2X3 having significant effect (P < 0.05) on the MVD (Table 4).
The fitted equations relating the responses PDE and MVD to the transformed factors are shown in Table 3. The polynomial equations can be used to draw conclusions after considering the mathematical sign and magnitude of coefficient. The value of the correlation coefficient (r2) for PDE and MVD was found to be 0.98 and 0.9 respectively, indicating good fit. A positive sign of the coefficient of the
As this design includes extra center points, we can estimate the pure error, and test for overall lack of it is fitness. As shown in Table 4, the test for lack of fit does not yield statistical significance (P > 0.05) for both PDE and MVD, and hence, we can be assured that the current model provides a satisfactory fit to the data.
Table 3 Summary of Results of Regression Analysis. Coefficient
b0
b1
b2
b3
b12
b13
b23
b11
b22
b33
PDE
69.53
6.63
-0.74
-5.46
0.32
1.95
0.51
-0.13
0.48
0.38
MVD
5.52
0.70
0.76
0.38
-0.22
0.02
0.45
0.21
-0.002
0.07
Table 4 Summary of Results of Analysis of Variance (ANOVA)*. Source
DF
PDE SS
MS
MVD F
P
SS
MS
F
P
X1
1
598.90
598.90
292.74
0.00
6.65
6.65
30.26
0.00
X2
1
7.50
7.50
3.67
0.08
7.97
7.97
36.24
0.00
X3
1
408.24
408.24
199.55
0.00
1.99
1.99
9.06
0.01
X1X2
1
0.81
0.81
0.39
0.54
0.38
0.38
1.74
0.22
X1X3
1
30.50
30.50
14.91
0.00
0.00
0.00
0.02
0.90
X2X3
1
2.10
2.10
1.03
0.33
1.63
1.63
7.41
0.02
X1
2
1
0.26
0.26
0.13
0.73
0.63
0.63
2.86
0.12
X2
2
1
3.27
3.27
1.60
0.24
0.00
0.00
0.00
0.99
X3
2
1
2.05
2.05
1.00
0.34
0.08
0.08
0.35
0.57
Lack of Fit
5
10.67
2.13
1.09
0.46
1.77
0.35
4.10
0.07
Pure Error
5
9.79
1.96
0.43
0.09
19
1074.00
Total SS
417
21.51
*SS indicates: sum of squares; DF, degree of freedom; MS, mean of squares; F, Fisher’s ratio.
418
International Journal of Pharmaceutical Sciences and Nanotechnology
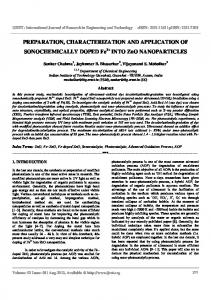
Contour plots Two-dimensional contour plots were established using coefficient of the various terms (Table 3). Values of independent variables were computed at prefixed values of PDE and MVD and two contour plots were constructed at fixed medium level of X2 (Figure 3) and at low level of X1 (Figure 4). It is evident from the Figure 3, all the contours for PDE (above 63% value) and MVD were found to be
Volume 2 • Issue 1 • April - June 2009
nonlinear indicating nonlinear relationship between X1 and X3 variables. From the Figure 4 the following observations can be made. All the contour plots are found to be curvilinear signifying non-linear relationship between X2 and X3. Low value of MVD could be obtained for different combination of X2 with less than 0.5 level and X3 with entire range and high value of PDE can be obtained with low levels of both independent variables.
Fig. 3 Combined contour plot for PDE and MVD of proniosome-derived niosomes at medium level of X2.
Fig. 4 Combined contour plot for PDE and MVD of proniosome-derived niosomes at low level of X1.
Ajay Solanki B et al. : Preparation, Optimization and Characterization of Ketoprofen Proniosomes for Transdermal Delivery
Checkpoint analysis Three checkpoint batches were prepared and evaluated for PDE and MVD as shown in Table 5. Results indicate that the measured PDE and MVD values were as expected. When obtained responses were compared with the predicted PDE and MVD value from coefficients and
419
contour plots, using student’s t-test, the differences were found to be insignificant (P> 0.05). Thus, we can conclude that the obtained coefficients and plotted contour plots are valid in predicting the levels of independent variables for desired response.
Table 5: Checkpoint Batches of ketoprofen proniosomes with their Measured and Predicted value of PDE and MVD. Batch code
X1
PKC1 PKC2 PKC3
PDE
MVD
X2
X3
-0.5
0
-0.5
67.81 ± 1.62
69.495
5.18
5.05
-1
-0.5
0.5
60.75 ± 0.84
59.6825
4.79
4.62
-1
-0.5
0
60.34 ± 2.14
62.8242
4.82
4.98
Measured*
Predicted
Measured
Predicted
*n = 3
Optimum formula
In vitro permeation study
After studying the effect of the independent variables on the responses, the levels of these variables, which give the optimum response, were determined. It is evident from results of ANOVA (Table 4) that the term surfactant loading (X2) having least contributing effect in predicting the PDE of ketoprofen proniosomes. Also, Figure 3 shows that the high value of PDE could be obtained with a low level of term X1 and X3. The optimum formulation is one that gives a high value of PDE and constraints on MVD (≤ 5 μm) along with a high total amount of drug entrapped and a low amount of carrier in the resultant niosomes. To achieve this, it is necessary to find out the optimum level of terms X2 and X3, which should be as high as possible at any level of X1 (Table 3 and Figure 3, 4). Low level of X1 was selected as an optimum as at this level less than 5 μm MVD value can be obtain up to a 0.05 level of X2 and high level of X3. Using a computer optimization process and the contour plot shown in Figure 4, the levels selected for X1, X2 and X3 were –1, –0.3 and 0.92 respectively, which gives the theoretical value of 56.51% and 4.99 μm for PDE and MVD respectively. Below the selected (optimum) level of X2 and X3 a high value of PDE could be obtained, but total amount of drug entrapped would significantly decreases. Proniosomes were prepared at the optimum levels (-1 level of X1, -0.3 level of X2 and 0.92 level of X3) of the independent variables and the resultant proniosomes transformed to niosomes and evaluated for the responses. The observed value of PDE and MVD were found to be 54.82% and 4.92 μm respectively, which were in close agreement with the theoretical value. This optimum batch (PKO) was subjected to further evaluation.
In vitro permeation study was performed to predict how a delivery system might work in an actual situation as well as give some indications of its in vivo performance since drug permeate dictates the amount of drug available for absorption (Gupta et al., 2007). In order to evaluate the effect of niosomal gel on the ketoprofen permeation rate, the permeation of ketoprofen from plain gel (ketoprofen dispersed in carbopol dispersion) was also estimated. Cumulative amount of drug permeated through skin was obtained 403.65 μg/cm2 and 346.48 μg/cm2 for niosomal gel and plain gel respectively. The steady state transdermal flux from the Fick’s law equation for the gel formulations across the rat skin was calculated from the slope of the linear portion of the cumulative drug permeated verses time plot (2-6 h). The permeability coefficient (Kp) was calculated from the steady state transdermal flux and the applied concentration in the donor compartment (Cdonor) as per equation 4. Kp = J/ Cdonor
(2)
Steady state transdermal flux and Kp from niosomal gel were found to be significantly (P