Diezmann, Carmel M. and Lowrie, Tom and Sugars, Lindy (2010). Primary .... Year 3 number line item (Queensland School Curriculum Council (QSCC), 2000a).
QUT Digital Repository: http://eprints.qut.edu.au/
This is the accepted version of this journal article: Diezmann, Carmel M. and Lowrie, Tom and Sugars, Lindy (2010) Primary students' success on the structured number line. Australian Primary Mathematics Classroom, 15(4). pp. 24‐28.
© Copyright 2010 Please consult the authors.
Primary Students’ Success on the Structured Number Line Carmel M. Diezmann1, Tom Lowrie2 & Lindy A. Sugars1 1
Queensland University of Technology, 2Charles Sturt University
Number lines are part of our everyday life (e.g., thermometers, kitchen scales) and are frequently used in primary mathematics as instructional aids, in texts and for assessment purposes on mathematics tests. There are two major types of number lines; structured number lines, which are the focus of this paper, and empty number lines. Structured number lines represent mathematical information by the placement of marks on a horizontal or vertical line which has been marked into proportional segments (Figure 1). Empty number lines are blank lines which students can use for calculations (Figure 2) and are not discussed further here (see van den Heuvel-Panhuizen, 2008, on the role of empty number lines). In this article, we will focus on how students’ knowledge of the structured number line develops and how they become successful users of this mathematical tool.
Figure 1. A structured number line with missing values (Washington Office of the Superintendent of Public Instruction, 2002)
Figure 2. Use of an empty number line for addition (Bobis, Mulligan, & Lowrie, 2009)
The Structured Number Line The structured number line is used to support students’ understanding of various mathematical concepts and processes, such as number sequencing activities (e.g., Wiegel, 1998), as a concrete method of showing mathematical operations (e.g., Davis & Simmt,
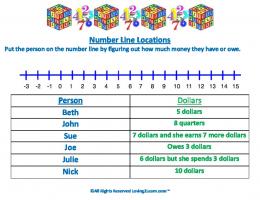
2003), and as an aid in visualising the continuity of rational numbers (Dienes, 1964). Although the structured number line can assist students’ understanding of mathematics, our research indicates that some primary students experience difficulty with the number line (Diezmann & Lowrie, 2006; Lowrie & Diezmann, 2005). Underpinning the effective use of structured number lines are two key understandings that students need to develop: 1. The number line is a graphic: Number lines use a single position to encode information by the placement of a mark on a horizontal or vertical axis (McKinlay, 1999). Students need to understand the conventions used to interpret and create structured number lines. 2. The number line is a measurement model: Structured number lines have marked line segments and the numbers on the line are representations of length rather than simply labelled points (Fuson, 1984). Students need to consider the distance between segments when identifying missing numbers. In our research, we have found that it is the combination of these two key understandings that separates successful from unsuccessful users of number lines. Research on the Structured Number Line Over a 3-year period, we interviewed 67 students (aged 10-12 years) annually on a total of six number line items drawn from the Graphical Languages in Mathematics (GLIM) test. The GLIM items were selected from published multiple choice items which were in numeracy tests suitable for similarly aged students. Three of these items are presented shortly in Figures 3, 4 and 5 with the options from which students chose removed. (See Diezmann & Lowrie, (2009) for a discussion of the test and further example items). During interviews, students were asked to solve the number line items and then explained how they reached their answers. Analysis of students’ answers has provided us with some insight into the characteristics of successful and unsuccessful users of the structured number line. Successful Students’ Use of the Number Line Successful students employed strategies relating to the measurement aspect of the number line, specifically distance, proximity of numbers or reference points. For example, in response to Figure 3, successful students highlighted the measurement aspect of the number line when explaining their answers. They looked at the distance between 0 and 20 and
reasoned that because D was closest to 20, it was 17 as indicated in Charlotte’s explanation: “Well, I thought D because it was close … ‘cause 17 was close to 20 and D was the closest letter to 20.” Distance was also considered when students used a less efficient approach. For example, some students estimated the position of other numbers before identifying D as the solution. Conrad used this strategy: “I reckon that C would be about 10 and D, because C is 10, and D is further on along the line so I reckon that one (D) would be 17.” Hence, successful students understand that the structured number line is a measurement model and the conventions of interpreting it require attention to the distance between the marks.
Estimate where you think 17 should go on this number line. Figure 3. Year 3 number line item (Queensland School Curriculum Council (QSCC), 2000a)
Unsuccessful Students’ Use of the Number Line At least 10% of the 67 students interviewed in our study were unsuccessful on the structured number line items. These students made errors during the solution process (solution errors), or during their explanations of the solution (explanation errors), or guessed the answers. Solution errors Solution errors were common. They comprised of difficulties with distance, position, counting or misreading the diagram. For example, for the item shown in Figure 3, a common response from unsuccessful students was to employ only counting to identify the unknown value. For example, India showed no awareness of the importance of the distance between the marks being counted. She said, “I did it because, sort of, going 20, 18, and then C should be 17…”. The use of a simple counting strategy is inappropriate because it incorrectly assumes that (a) the marked line segments are evenly spaced, and (b) the distance between each segment represents one unit. The spacing between markings of line segments can be variable on structured number lines with only some of the line segments marked. This means that the distance between the segments can represent any number of units. Consequently, students who solely use a counting strategy are likely to be unsuccessful.
Other students made a solution error when they misread the diagram. For example, when Danika read the question shown in Figure 4 aloud, she read 1.3 but then proceeded to focus on the letters between 0 and 1. She explained her choice as follows: “I said A because it’s kind of half way in between the zero and the 1 and the B is a bit more like 4 so I just said A cos (sic) it’s about half way.” In her explanation, Danika indicates that A is “about half way” and represents (decimal) 3 (.3) and that B represents (decimal) 4 (.4). Her explanation suggests that she is unsure of what decimal value represents a half and how this is represented on a number line. However, her response to the item shown in Figure 3 indicates that she understands the concept of a half when dealing with whole numbers: In this case she said, “(I chose) D … because it’s the closest to 20 and C is around half way which is a 10 so D is closest to 20 (and) 17 is closer to 20 than to 10.” Danika’s responses illustrate the difficulty that some students have in transferring their knowledge of decimal fractions to number lines. The subsequent misreading of the diagram leads to solution errors.
Estimate where you think 1.3 should go on this number line. Figure 4. Year 7 number line item (QSCC, 2000b)
Explanation errors Explanation can help students refine their thinking. During the interviews, it was noted that many students realized they had made errors after they read the question aloud to the interviewer. Reading aloud seemed to help the students comprehend all the information in the question. For example, for the item shown in Figure 5, students needed to identify positions on the line and then do a calculation. Many students misread this question, choosing 45 km as their answer. When asked to read the question aloud and explain their answer, they often realised their error and changed their answer to the correct choice of 105 km.
Bay City
Exton
Yardville
On the road shown above, the distance from Bay City to Exton is 60 kilometres. What is the distance from Bay City to Yardville? Figure 5. National Center for Educational Statistics – US Dept of Education (2003)
Students’ ability to self correct through explanation provides an important avenue for improving performance as can be seen from the following exchange between Jarod and the interviewer. Jarod:
I made a mistake (emphasis added)
Interviewer:
Would you like to change your answer?
Jarod:
Yes. My first answer was 45 but then… ‘cause (sic) I was looking from Exton to Yardville, but the question is from Bay City to Yardville.
Interviewer:
What would you like to change your answer to? …Now you’ve chosen 105.
Jarod:
I chose that (105) because before I was going from Exton to Yardville which was 45km but I had to go from Bay City to Yardville, so I figured it out by, if it was from Bay City to Exton was 60km and then I figured it out that Exton to Yardville was 45, I just added 60 and 45 together and made 105. So that’s how I made my (second) answer.
Jarod’s ability to recover from his error highlights the value in students explaining their solution. However, a strategy to be discouraged is guessing. Conclusion and Teaching Implications The results of our study revealed differences in strategy use between successful and unsuccessful users of the number line. Successful students focused on the number line as a measurement model and employed strategies relating to distance, proximity of numbers or reference points. In contrast, unsuccessful students used strategies that focused on counting, misread the question, or guessed. There are, therefore, some students who need support to develop their knowledge of number lines.
Recommendations for the classroom We recommend the following five classroom practices to support students’ understanding of the structured number line. 1. Ensure students can discriminate between the structured number line and the empty number line to avoid the conventions of the structured number line being overlooked. 2. Provide explicit teaching about the structured number line, particularly in regard to it being a measurement rather than a counting model. 3. Use number lines when discussing decimal fractions so students become familiar with this type of representation. 4. Ask students experiencing difficulty to read the task aloud. This strategy has particular benefit for some students and can improve understanding of number line (and other mathematical tasks). 5. Challenge students to explain their thinking. Explaining provides students with opportunities to review and, if necessary, refine their mathematical thinking. During an explanation, some students experience an ‘aha’ moment, recognizing that they have made an error and are able to self-correct and continue to a successful solution. Acknowledgements: The research for this paper was funded by the Australian Research Council (#DP0453366). Special thanks to Janelle Trenorden, Tracy Logan and the other research assistants who contributed to this project. References Bobis, J. Mulligan, J. & Lowrie, T. (2009). Mathematics for children: Challenging children to think mathematically (3rd ed.). Sydney: Pearson Education. Carpenter, T. P., Fennema, E., & Franke, M. L. (1996). Cognitively guided instruction: A knowledge base for reform in primary mathematics instruction. The Elementary School Journal, 97(1), 3-20. Davis, B., & Simmt, E. (2003). Understanding learning systems: Mathematics education and complexity science. Journal for Research in Mathematics Education, 34(2), 137–167. Dienes, Z. P. (1964). Building up mathematics (2nd ed.). London: Hutchison Educational.
Diezmann, C. M., & Lowrie, T. (2006). Primary students’ knowledge of and errors on number lines. In P. Grootenboer, R. Zevenbergen, & M. Chinnappan (Eds.), Identities, cultures, and learning spaces (Proceedings of the 29th annual conference of the Mathematics Education Research Group of Australasia, Canberra). Sydney: MERGA. Diezmann, C. M., & Lowrie, T. J., (2009). An instrument for assessing primary students’ knowledge of graphics in mathematics. Assessment in Education: Principles, Policy & Practice, 16(2), 131-147. Fuson, K. (1984). More complexities in subtraction. Journal for Research in Mathematics Education, 15(3), 214-225. Lowrie, R., & Diezmann, C. M. (2005). Fourth-grade students’ performance on graphical languages in mathematics. In H. L. Chick & J. L. Vincent (Eds.), Proceedings of the 30th Annual Conference of the International Group for the Psychology of Mathematics Education (Vol 3, pp. 265-272). Melbourne: PME. Mackinlay, J. (1999). Automating the design of graphical presentations of relational information. In S. K. Card, J. D. Mackinlay, & B. Schneiderman (Eds.), Readings in information visualization: Using vision to think (pp. 66-81). San Francisco, CA: Morgan Kaufmann. National Center for Educational Statistics, National Assessment of Educational Progress (NAEP), 2003, Year 4 Mathematics. [retrieved September 9 2004 from http://nces.ed.gov/nationsreportcard/ITMRLS/search.asp?picksubj=Mathematics] Queensland School Curriculum Council (2000a). 2000 Queensland Year 3 Test: Aspects of Numeracy. Brisbane: Author. Queensland School Curriculum Council (2000b). 2000 Queensland Year 7 Test: Aspects of Numeracy. Brisbane: Author. van den Heuvel-Panhuizen, M. (2008). Learning from "Didactikids": An Impetus for Revisiting the Empty Number Line. Mathematics Education Research Journal, 20(3), 631. http://www.merga.net.au/documents/MERJ_20_3_van_den_Heuvel-Panhuizen.pdf Washington Office of the Superintendent of Public Instruction (2002).Washington assessment of student learning: A component of the Washington State Assessment Program.
[Accessed 24 May 2008 from http://www.K12.wa.us/Assessment/WASL/testquestion/2002/Gr4Math.pdf] Wiegel, H. G. (1998). Kindergarten students' organization of counting in joint counting tasks and the emergence of cooperation. Journal for Research in Mathematics Education, 29(2) 202-224.