Hindawi Publishing Corporation Journal of Electrical and Computer Engineering Volume 2015, Article ID 347350, 10 pages http://dx.doi.org/10.1155/2015/347350
Research Article Priority Control Strategy of VSC-MTDC System for Integrating Wind Power Wen-ning Yan,1 Ke-jun Li,1 Zhuo-di Wang,1 Xin-han Meng,1 and Jianguo Zhao2 1
School of Electrical Engineering, Shandong University, Jinan 250061, China State Grid of China Technology College, Jinan 250002, China
2
Correspondence should be addressed to Ke-jun Li;
[email protected] Received 1 April 2015; Accepted 23 June 2015 Academic Editor: Alfredo Vaccaro Copyright © 2015 Wen-ning Yan et al. This is an open access article distributed under the Creative Commons Attribution License, which permits unrestricted use, distribution, and reproduction in any medium, provided the original work is properly cited. For the obvious advantages in integrating wind power, multiterminal HVDC transmission system (VSC-MTDC) is widely used. The priority control strategy is proposed in this paper considering the penetration rate of wind power for the AC grid. The strategy aims to solve the problems of power allocation and DC voltage control of the DC system. The main advantage of this strategy is that the demands for wind power of different areas can be satisfied and a power reference for the wind power trade can also be provided when wind farms transmit active power to several AC grids through the DC network. The objective is that power is well distributed according to the output power of wind farm with the demand of AC system and satisfactory control performance of DC voltage is obtained.
1. Introduction Since wind resources especially offshore wind resources are rich in China, large scale integration of wind power transmission technology has drawn a lot of attention in recent years [1, 2]. Compared to the disadvantages of traditional AC transmission, such as the limitation of transmission power due to the charging current, the voltage stability problems for long distance, and the need for a large amount of reactive power compensation equipment, flexible DC transmission technology, especially high voltage direct current based on voltage source converter (VSC-HVDC), has increasingly become the preferred way for remote wind power transmission with the advantages of lower harmonic content, the stability of AC bus voltage, large transmission capacity, and so on [3–5]. Two-terminal VSC-HVDC can realize power transmission from point to point with the active and reactive power being controlled independently. The application of fully controlled devices makes the system have the ability to work in passive inverting mode to supply isolated system. Moreover, it can also play the role of STATCOM for reactive power compensation under some special conditions [6].
Unfortunately, two-terminal system still has some deficiencies, especially worse stability and reliability under some fault conditions. Compared with the two-terminal system, multiterminal HVDC flexible technology (VSC-MTDC) has multiple converter stations to realize the flexibility of power dispatch control and better economical efficiency. Therefore, it can be used in the integration of multiple wind farms in different regions [7, 8]. In recent years, many scholars have done extensive researches on multiterminal HVDC system control strategies for integration of wind farms. The widely used doubly fed induction generator (DFIG) in offshore wind farms has been analyzed in the literature [9, 10], and the variable speed constant frequency maximum power tracking control is achieved. The DC voltage control strategy suitable for wind farm connected with VSC-MTDC is proposed in [11] to ensure the stable operation of VSC-MTDC for wind power integration. The voltage margin control as an improved constant DC voltage control is proposed in [12] and the DC voltage is controlled at a new value by reserved converter station once the power limitation is exceeded. The widely accepted voltage drop control for VSC-MTDC is proposed in the literature [13], in which different converter
2
Journal of Electrical and Computer Engineering Wind farm 1
AC system 3 WFVSC1
GSVSC3 DC cable
Wind farm 2 WFVSC2
GSVSC4 AC system 4
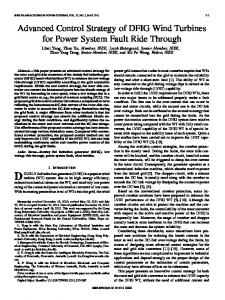
Figure 1: Four-terminal VSC-MTDC system connecting wind farms.
stations cooperate to achieve the control of DC voltage and the dispatch of active power at the same time. In [14], the voltage droop control is improved and the droop constants are adapted in relation with the AC system stability. Literature [15] presents control strategy for multiterminal system based on the improved active power characteristics; the problems of active power imbalance and DC voltage instability during the dominant station overload periods are effectively solved; the measures for active power balance are analyzed during the grid system faults in [16] and DC voltage control strategy based on the regulation characteristics of DC voltage and current of VSC-MTDC transmission systems for offshore wind farm is proposed. In [17], a coordinated control strategy of VSC-MTDC named master-auxiliary is proposed by combining the advantages of the voltage margin and voltage droop control; the reliability and stability of the DC network are ensured by master and auxiliary converter stations in normal state or by the APC in abnormal conditions. The researches above ensure the stability and reliability of the DC system under normal and fault conditions. But the different ratio of wind power penetration on the total load of AC system is not included properly, while in practice the ratio should be controlled in a proper range so that the stability of AC system can be achieved. The amount of transmitting active power of station is related to their DC voltage level; however, DC voltage level is determined once the control strategy is selected; then the transmitting power cannot be adjusted according to different demand of AC system connected to station. Based on the analysis above, a priority control strategy is proposed in this paper. In this strategy, the VSC stations connected to AC systems which have strong demands of wind power have the highest priority over other stations, so it will receive all the output power of wind farms when the output amount is less than the set value of the connected AC system. While in the high output stage of wind farms, the wind power beyond the set value will be delivered to each AC system in accordance with an adjustable power transmission ratio, and the ratio is in relation to the dependence of each AC system. Section 2 of this paper gives a brief introduction of the VSC-MTDC system. In Section 3, the characteristic curve of active power and DC voltage for the grid side converters
(GSVSCs) is improved and the priority control strategy is introduced in detail. The controller combining voltage droop and PI control is designed. Finally, the simulation results under uncertain wind output condition and different demand of AC grid are presented to validate the effectiveness of the proposed control strategy.
2. Transmission System Structure of VSC-MTDC Four-terminal wind power transmission system is established as shown in Figure 1 containing two rectifying converter stations and the two inverting converter stations. Two wind farms working as typical distributed power are connected to system by the wind farm side converter stations (WFVSCs), and the WFVSCs collect the output power of wind farms in different places to the DC system and then through the remote transmission with DC cable; finally the total wind power of the system is delivered into the AC systems in different places by the two grid side converter stations (GSVSCs). Nowadays the technology of variable speed constant frequency is widely used in wind power generation; wind turbine (in the case of DFIG) with variable speed constant frequency can realize the decoupling of the rotational speed of the generator and the power grid frequency and reduce the mutual influence between the wind power generation and power grid. The control of DFIG will no longer be described in detail considering many existing mature researches. The primary task of wind farm side converters (WFVSCs) is working as a slack node to transfer the power of wind farms out instantaneously and ensure the stability of bus voltage amplitude and phase in public node of wind farms; hence the control strategy with constant AC voltage and active power control will be applied to WFVSCs. The grid side converters (GSVSCs) using priority control strategy proposed in this paper aim to maintain a stable DC voltage and in the meantime the allocation of the active power into the grid according to the output power of wind farms and requirements of different AC system is achieved. The converter stations in Figure 1 have the same structure and the topology of their structure when connected to AC system is as shown in Figure 2.
Journal of Electrical and Computer Engineering
T1
T3
3 Udc
T5
L
Ud4max
C
Udc Ud4st
T4
Filter
T6
Ud3ref
T2
The mathematical model for VSC in two-phase rotating 𝑑-𝑞 coordinate system is shown as follows: 𝐿 𝐿 𝐶
𝑑𝑖𝑑 = 𝑢𝑠𝑑 − 𝑆𝑑 𝑈dc − 𝑅𝑖𝑑 + 𝜔𝐿𝑖𝑞 , 𝑑𝑡 𝑑𝑖𝑞 𝑑𝑡
= 𝑢𝑠𝑞 − 𝑆𝑞 𝑈dc − 𝑅𝑖𝑞 + 𝜔𝐿𝑖𝑑 ,
(1)
𝑑𝑈dc 3 = (𝑆𝑑 𝑖𝑑 + 𝑆𝑞 𝑖𝑞 ) − 𝑖𝐿 , 𝑑𝑡 2
where 𝜔 is the angular velocity of rotation; 𝑆𝑑 and 𝑆𝑞 are switching function in synchronous rotating 𝑑-𝑞 coordinate system; 𝑢𝑠𝑑 , 𝑢𝑠𝑞 are 𝑞- and 𝑑-axis component of the grid voltage, respectively; 𝑖𝑑 and 𝑖𝑞 are 𝑑- and 𝑞-axis component of the grid current, respectively; 𝑖𝐿 is the DC line current; 𝑈dc represents the DC voltage; 𝐿 is the equivalent inductance; 𝑅 stand for the equivalent loss; 𝐶 is capacitor in DC side of converter.
3. Priority Control Strategy As an important index to measure the AC grid which accepts wind power, wind power penetration level refers to the ratio that the wind power capacity accounts for the total capacity of the network load and it shows the dependence of grid on the wind power. The output power of wind farms is unpredictable due to its nature of intermittence and uncertainty. All the generated wind power needs to be transmitted to the AC system (high wind power penetration level) which has priority over others through GSVSC to meet its demand during the period when the total power output is less than the required minimum wind power injection volume (set by the system). With the increase of the power output of wind farms, the system switches to the mode that two grid side converter stations deliver the extra output power beyond the set value to AC systems by adjustable power transmission ratio. 3.1. Improved Characteristic Curve of Active Power and DC Voltage. In order to maintain the normal operation of AC system with high dependence on wind power under uncertain output power of wind farms, the characteristic curve
Pd3add Pd3lim
Figure 2: Topology diagram of VSC.
Pd4max
Pd3max
P
0
Figure 3: Improved characteristic curve of active power and direct voltage.
of active power and DC voltage for the grid side converter (GSVSCs) is improved as shown in Figure 3 where 𝑈dc3ref represents the set DC voltage value of the 3rd GSVSC under constant DC voltage control mode; 𝑈dc4set represents the trigger voltage for the 4th GSVSC in droop control mode; 𝑃d3max and 𝑃d4max are maximum transmission power of two GSVSCs, respectively; 𝑈dc4max represents the maximum DC voltage of the 4th GSVSC during normal operation; 𝑃d3lim represents the set value of transmission power of the 3rd GSVSC under the constant DC voltage mode. The improved curve is based on the original characteristics [15, 18] and the slope is enhanced in the part of DC voltage curve; thus the working state of GSVSCs is divided into two stages. By the time when the total output power of wind farms reaches the required minimum limitation of AC system with high dependence on wind power (the 3rd AC system), the 3rd GSVSC works in DC voltage mode and all the output power of wind farms is transported to the 3rd AC system through it; meanwhile the transmission power of the 4th GSVSC is zero; the 3rd GSVSC enters the current limiting mode as soon as the total output power of wind farms exceeds the set value 𝑃dc3lim (𝐼dc3lim ) and DC voltage increases accordingly; once the increasing DC voltage reaches the trigger voltage of the 4th GSVSC, the 3rd and 4th GSVSCs start to work in coordination to dispatch the extra wind power exceeding the set value into AC grids by an adjustable power transmission ratio 𝑛. 3.2. Analysis of DC Network. The equivalent circuit of DC grid in steady state of four-terminal VSC-MTDC transmission system is shown in Figure 4. In this figure, 𝑅𝑖 (𝑖 = 1, 2, 3, 4, 5) represent the equivalent resistance of DC cables, respectively; 𝑈dc𝑖 (𝑖 = 1, 2, 3, 4) represents the DC voltage of converter stations, respectively; 𝑈dca and 𝑈dcb represent the DC voltage of collection point and branch point of DC network, respectively; DC power flows from the wind farms side of converter stations WFVSC1 and WFVSC2 through DC cables to the grid side converter stations GSVSC3 and GSVSC4.
4
Journal of Electrical and Computer Engineering
Udc1
R1
R3
Udc3
R5 Udca Udc2
Udcb
R4
R2
Udc4
Figure 4: DC equivalent circuit of four-terminal MTDC system.
The variables 𝑃, 𝑈, and 𝑃ref of the DC network in the vector form are defined as follows: 𝑃 = [𝑃d1 ⋅ ⋅ ⋅ 𝑃d𝑖 ⋅ ⋅ ⋅ 𝑃d𝑛 ]
𝑇 𝑇
by wind power penetration level, and the two stage working conditions are as follows. Stage One. The active power output of wind farms is less than the power required by the 3rd AC system with high dependence on wind farms in this stage. The 3rd GSVSC works in a constant DC voltage mode and all the output power of wind farms is transmitted to the 3rd AC system; thus the DC voltage is kept in the setting value of 𝑈dc3ref while the transmitted active power of the 4th GSVSC is zero; that is, 𝐼dc4 = 0. In the meantime, the 4th GSVSC can operate in STATCOM mode to provide reactive power support to AC system if needed. The DC voltage of each converter station in this stage can be expressed as
(2)
𝑈dc1 ] [ [𝑈dc2 ] ] [ [𝑈 ] [ dc3 ]
The injected active power from DC nodes into DC network can be expressed as
[𝑈dc4 ]
𝑈 = [𝑈dc1 ⋅ ⋅ ⋅ 𝑈dc𝑖 ⋅ ⋅ ⋅ 𝑈dc𝑛 ]
𝑇
𝑃ref = [𝑃d1ref ⋅ ⋅ ⋅ 𝑃d𝑖ref ⋅ ⋅ ⋅ 𝑃d𝑛ref ] .
𝑃 = 𝑈 ⊗ (𝑌𝑈) ,
(3)
[ [ =[ [ [
𝑅1 + 𝑅3 + 𝑅5 𝑅3 + 𝑅5
𝑅3 + 𝑅5
1 𝑃d1 ][ 𝑈 ] 𝑅2 + 𝑅3 + 𝑅5 1] [ dc1 ] ] [ 𝑃d1 ] , ] [ 0 1] ][ 𝑈 ] dc1 𝑅3 1] [𝑈dc3ref ]
(7)
where the multiplication symbol represents the calculation that the element of the matrix multiplies bit by bit in accordance with the dimensions; 𝑌 represents the admittance matrix of DC network. The Jacobian matrix is calculated by the partial differential of active power to the DC voltage of each node similar to the definition in AC system as follows:
where 𝑈d1 , 𝑈d2 , and 𝑈d4 are unknown while 𝑃d1 , 𝑃d2 , and 𝑈d3ref are known quantity.
𝜕𝑃d1 𝜕𝑃d1 ⋅⋅⋅ 𝜕𝑈dc1 𝜕𝑈dc𝑛 .. 𝜕𝑃 ( ). = 𝐽 (𝑘) = . 𝜕𝑈 𝜕𝑃d𝑛 𝜕𝑃d𝑛 ⋅⋅⋅ 𝜕𝑈dc𝑛 ) ( 𝜕𝑈dc1
Stage Two. The 3rd GSVSC will enter into the current limiting mode when the wind power output is greater than the required minimum active power limit of the GSVSC number 3, furthermore causing the DC voltage to rise rapidly to reach the trigger voltage of the 4th GSVSC; then the working conditions of the two GSVSCs enter stage two and the voltage is given as
(4)
[
0 𝑅3
In the above equation, the partial differential is given as −𝑌 𝑈 { { 𝑖𝑘 dc𝑖 𝜕𝑃d𝑖 = {−∑𝑌 𝑈 − 2𝑌 𝑈 𝜕𝑈dc𝑘 { 𝑖𝑗 dc𝑗 𝑖𝑖 dc𝑖 { 𝑗=𝑖̸
𝑈dc4 = 𝑅3
(𝑘 ≠ 𝑖) (𝑘 = 𝑖) .
(5)
The relationship between the change of DC voltage quantity Δ𝑈 and the variation of active power Δ𝑃 of each node in the network can be expressed as Δ𝑃 = 𝐽 (𝑘) Δ𝑈.
(6)
3.3. Analysis of Working State of GSVSC. As is dispatched in Figure 3, due to the nature of intermittence and uncertainty in wind power output, the working state of two grid side converter stations with priority control strategy can be divided by the boundary point given by the minimum active power limitation of AC system into two stages. The minimum active power limitation 𝑃d3lim of AC system is determined
𝑃dc3lim + 𝑈dc3ref . Udc3ref
(8)
The trigger voltage 𝑈dc4st of the 4th GSVSC should be slightly higher than the 𝑈dc4 given above considering the system margin and control response. And in the actual calculation the voltage rising volume and the transmission power exceeding the limit part are small before the operation curve enters into the slope control part; hence it can be approximately considered in Figure 3 that 𝑃dc3lim ≈ 𝑃dc3add . Suppose that the slope of active power-DC voltage curve of the two converter stations working in stage two is 𝑘𝑖 (𝑖 = 3, 4); the slope can be expressed as Δ𝑃d𝑖 1 = . 𝑘𝑖 Δ𝑈dc𝑖
(9)
Journal of Electrical and Computer Engineering
5
The relationships of the transmission power between the two GSVSCs with droop control are as follows: 1 1 𝑃d3 = 𝑃d3lim + Δ𝑈dc3 = 𝑃d3lim + (𝑈dc3 − 𝑈dc4st ) , 𝑘3 𝑘3 1 1 (𝑈 − 𝑈dc4st ) . 𝑃d4 = Δ𝑈dc4 = 𝑘4 𝑘4 dc4
𝑅 𝑅3 𝑃 ) + d3lim 3 𝑈dc3 𝑈dc3
𝑃d3 − 𝑃d3lim 𝑘4 ≈ . 𝑃d4 𝑘3
(12)
(13)
According to the formula above, the transmission power ratio and the slope of characteristic curve are inversely proportional, and thus the change of power transmission ratio can be achieved by adjusting the slope of the droop curve, respectively. If the relationship between slope of the droop control curve and the dependence on wind power of corresponding AC system can be established, then the demand that AC systems with different dependence on wind power have different required transmission power can be achieved. The DC voltage of each station working in stage two derived from DC network analysis in Section 3.2 and formulas (10) and (12) can be expressed as 𝑈dc1 [ ] 𝑈 [ dc2 ] [ ] [𝑈 ] [ dc3 ] [𝑈dc4 ] 1 𝑛 𝑅eq (𝑅3 − ) [ 𝑅1 + 𝑅eq 𝑛+1 𝑘3 [ [ 1 𝑛 [ 𝑅 +𝑅 𝑅eq (𝑅3 − ) eq [ 2 𝑛 + 1 𝑘 3 =[ [ 𝑛 −1 𝑛 𝑛 [ [ (𝑛 + 1) 𝑘 (𝑛 + 1) 𝑘 𝑛 + 1 𝑘3 3 3 [ [ 𝑛 −1 𝑛 + 1) 𝑘 + 1) 𝑘 + 1) 𝑘4 (𝑛 (𝑛 (𝑛 4 4 [
P
P
+
+
id3ref
P4 Udc4
K/(1 + sT)
Udc
id4ref
P
Figure 5: Design of the priority controller.
The relationship between the transmission power and DC voltage of the 4th GSVSC is given as 𝑃d4
As the resistance is small relative to the DC voltage, thus the smaller ones in the formula can be neglected. The simplified power transmission 𝑛 for distribution of the extra wind power output which exceeds the set limitation between the two GSVSCs can be approximately given as follows: 𝑛=
K/(1 + sT) Udc3ref +
(11)
The equation below can be derived by the combination of the above two formulas:
𝑅 = 𝑃d4 (𝑘4 + 4 ) . 𝑈dc4
Udc
I
𝑃d4 𝑃 = 𝑈dc3 + 𝑅3 d3 . 𝑈dc4 𝑈dc3
(𝑃d3 − 𝑃d3lim ) (𝑘3 +
Udc3
(10)
As can be seen in Figure 4, the DC voltage of power branch point can be expressed by the 3rd and 4th GSVSCs as 𝑈dcb = 𝑈dc4 + 𝑅4
P3
𝑃d1 1] (14) ][ 𝑈 ] ] [ dc1 ] ] [ 1] ] [ 𝑃d1 ] ][ 𝑈 ]. ] [ dc1 ] ] [𝑃 1] ] [ d3lim ] ] ] [𝑈 dc3ref ] 1 [ 𝑈dc4st ] ]
=
(15) 𝑈dc4 − 𝑈dc4st 𝑃d4max (𝑈dc4st ≤ 𝑈dc4 < 𝑈dc4max ) . 𝑈dc4max − 𝑈dc4st
The DC voltage of each converter station is calculated by formulas (6) and (14) and (15) can provide the reference for determining the DC voltage operation range and the parameters of the controller. 3.4. Design of the Controller. Figure 5 shows the structure diagram of the outer loop controller with priority control strategy. DC voltage is controlled by the 3rd GSVSC with feed forward PI control strategy when the wind power output is less than the minimum power set value; with the wind power output increasing, when the system DC voltage reaches the starting voltage of the 4th GSVSC, two GSVSCs enter into the voltage droop control mode to deliver wind power to AC system in accordance with the adjustable power transmission ratio, where 𝑖d3ref and 𝑖d4ref are the output signal of the outer loop controller, respectively, which provides the reference values for the inner current control. The measured DC voltage of GSVSCs passes through a first-order low-pass filter which is introduced to prevent the harmonic impact on the control accuracy of the system. The outer loop DC voltage PI controller in priority controller is of the same structure with the double closedloop control widely used in many literatures such as [17, 19]. The structure diagram of voltage droop controller for power allocation shown in Figure 6 is analyzed where the parameter 𝑒 represents the error signal of the controller; 𝑘𝑝1 and 𝑘𝑝2 represent the slope of droop curves, respectively; 𝐼dref represents the command signal of inner current loop controller; 𝑃ref is the transmission power before the curve enters the droop control, which is provided as the reference value for droop control. In Figure 6, the priority controller works as the droop controller for active power when the slope 𝑘𝑝1 is set as the constant 1, while it works as droop controller for DC voltage when the slope 𝑘𝑝2 is the constant 1. The following analysis of the working principle of active power controller is employed
6
Journal of Electrical and Computer Engineering
4. Simulation Analysis
P Pref
+
−
kp1
e
+ +
idref
PI
1/kp2
Uref
+
−
U
Figure 6: Block diagram of DC voltage droop control.
to illustrate the droop control and the influence of active power reference change on the distribution of power between GSVSCs. The input deviation of PI circuit in the voltage droop controller during steady state is expressed as 𝑒 = (𝑈ref − 𝑈) + 𝑘𝑝 (𝑃ref − 𝑃) = 0.
(16)
According to the above formula, the relationship between the active power and DC voltage of station using this controller is as follows: 𝑃 = 𝑃ref +
𝑈ref − 𝑈 . 𝑘𝑝
(17)
The relationship between the variation of active power and DC voltage corresponding can be expressed similarly as Δ𝑃 = Δ𝑃ref +
Δ𝑈ref − Δ𝑈 . 𝑘𝑝
(18)
In order to study the influence of active power reference change on the power allocation of each node in this paper, the change quantity of DC voltage reference value is set to zero. The above formula can be rewritten as Δ𝑃 = Δ𝑃ref −
Δ𝑈 . 𝑘𝑝
(19)
The relationship given in the above formula can be modified combining formula (5) in chapter 2.2.1 as −1
𝐽 (𝑘)−1 ] Δ𝑃ref . Δ𝑃 = [𝐼 + 𝑘𝑝
(20)
Matrix 𝐼 is unit diagonal matrix with the same dimension of Jacobian matrix 𝐽(𝑘). As can be seen from the above analysis, Jacobian matrix cannot be changed with a determined DC network. The only way to change the distribution of active power between GSVSCs when the power reference value changes (fluctuation of the wind power output) is to change the slope of droop curve, respectively, which coincides with the analysis in formula (12).
In order to prove the effect of the proposed control strategy, a simulation system of four-terminal VSC-MTDC grid for wind power transmission is modeled in the electromagnetic transient simulation software PSCAD/EMTDC as shown in Figure 1. The AC systems at the receiving terminals are simulated with ideal AC sources and IEEE standard system with three generators and nine nodes, respectively. Except the above difference, all the parameters of the two simulation models and simulation conditions are the same. Among them, the rated capacity of wind farms which connect WFVSCs is 300 MW, and the rated capacity of GSVSC is 400 MW; reference value for DC voltage of the 3rd GSVSC is 400 kV, the voltage of AC system is 420 kV, and the transformer parameters are 420/230 kV. The calculated trigger voltage of the 4th GSVSC by formula (7) is 403 kV. 4.1. Simulation in Changing the Output of Wind Farms. Assuming that the AC system which is connected to the 3rd GSVSC has stronger dependence on wind power, the minimum input power required is 150 MW. The total wind power output is 130 MW at the initial time and increases to 330 MW at the time of 0.5 seconds; the corresponding change quantity of active power reference value in formula (17) is Δ𝑃ref = [100, 100, 0, 0]; then the wind power output continues to increase to 580 MW at the time of 1 second with an active power reference value change quantity 𝑃ref = [100, 150, 0, 0], while at the time of 1.5 seconds the wind power output is reduced to 480; similarly the corresponding active power reference value change quantity 𝑃ref = [−50, −50, 0, 0]; the power transmission ratio between the 3rd and 4th GSVSCs is 3 : 2 and remains unchanged. Figure 7 presents the simulation results of active power and DC voltage of each station. As can be seen from Figure 7(a), when the total power output of the wind farms is less than the minimum active power limit 𝑃dc3 of AC system before 0.5 seconds, the 3rd GSVSC delivers all the total wind farm output active 127 MW which is less than the set value due to the loss of station and cable to meet its needs, while the transmission power of the 4th GSVSC is zero, and in the meantime the DC voltage is maintained around its reference value. When the total power output of wind farms rises to 330 MW, which is beyond the required limitation set in advance, the 3rd GSVSC enters the current limit mode, which causes the DC voltage to rise rapidly to reach the trigger voltage of the 4th GSVSC. The 3rd and 4th GSVSC start to allocate the extra wind power exceeding the set limitation from 0.5 seconds to 1 second with the transmission power of 118 MW and 76 MW, respectively, which match approximately with the transmission ratio considering the losses as shown in the figure, and the DC voltage is jointly maintained by the two GSVSCs according to droop curve. The transmission power reaches to 396 MW and 178 MW, respectively, when the wind power output increases at 1 second and then decreases at 1.5 seconds when the wind farm output power drops to 338 MW and 139 MW; the above two changes both match the transmission according to the simulation result shown in the figure.
Journal of Electrical and Computer Engineering
7
400 300
415
410
100
Udc (kV)
P (MW)
200
0 −100
405
−200 400
−300 −400
0.5
1
1.5
0.5
2
1
1.5
2
t (s)
t (s) P1 P2
Udc3 Udc4
Udc1 Udc2
P3 P4
(a) The active power and DC voltage of each VSC/MW in ideal receiving systems
420
400
410 200 Udc (kV)
P (MW)
400 0
390 380
−200 370 −400
0.5
1
1.5
2
360
0.5
P4 P3
1
1.5
2
t (s)
t (s) P1 P2
Udc1 Udc2
Udc3 Udc4
(b) The active power and DC voltage of each VSC/MW in standard receiving systems
Figure 7: Simulation of variation of power of wind farm with standard receiving systems.
The results of IEEE standard systems shown in Figure 7(b) are almost the same with Figure 7(a), except for little fluctuation due to the different characteristic between ideal systems with standard systems. And similarly, the active power of the DC system is balanced and the DC voltages are kept in the reasonable range. The above analysis shows that the control strategy can be applied to both ideal receiving sources and IEEE standard systems according to the similar response to the change of output power of the wind farms, and in the process of changes in the output power from the wind farms, the transmission power of GSVSCs meets the power transmission ratio in allowable range considering the system loss and with smooth transaction. The DC voltage is within the range of normal operation after the transition indicating that the system has good dynamic response.
4.2. Simulation in Changing the Transmission Ratio. The initial output power of wind farms is equal to 130 MW and increases to 430 MW from 0.5 seconds to 1 second with the active power reference value change value Δ𝑃ref = [150, 150, 0, 0]. Based on the foregoing analysis, the change of transmission power ratio can be achieved by adjusting the slope of the droop curve. The power transmission ratio between the two GSVSCs changes from the initial setting value 3 : 2 to 1 : 1 at 1 second and then back to the 3 : 2 at 1.5 seconds. The simulation results of active power and DC voltage of each station are as shown in Figure 8. As shown in Figure 8(a), the wind farms power output is less than the minimum set limitation of AC system before 0.5 seconds at the initial moment; therefore, the transmission power transferred by the 3rd GSVSC to the AC power system is 126 MW accounting for the loss. As the total wind farm
8
Journal of Electrical and Computer Engineering 400 300
415
410
100
Udc (kV)
P (MW)
200
0 −100
405
−200 400
−300 −400
0.5
1
1.5
2
0.5
1
t (s) P3 P4
P1 P2
1.5
2
t (s) Udc1 Udc2
Udc3 Udc4
(a) The active power and DC voltage of each VSC/MW in ideal receiving systems
400
420
300
415 410
100
Udc (kV)
P (MW)
200
0 −100
405 400
−200 395
−300 −400
0.5
1
1.5
2
390
0.5
P4 P3
1
1.5
2
t (s)
t (s) P1 P2
Udc3 Udc4
Udc1 Udc2
(b) The active power and DC voltage of each VSC/MW in standard receiving systems
Figure 8: Simulation of variation of transmission power ratio of GSVSCs.
power output increases to 430 MW during 0.5–1.0 second, the transmission power of the two GSVSCs is 320 MW and 107 MW, respectively, which meets the initial transmission ratio of 3 : 2. The transmission power of the two GSVSCs is 275 MW and 147 MW when the power transmission ratio is adjusted to 1 : 1 during 1.0–1.5 seconds in line with the power transfer ratio, and the DC voltage is jointly maintained at about 410 kV; the power transmission ratio returns to 3 : 2 at 1.5 seconds and the system approximately has the same value of the transmission power and the DC voltage with the aforementioned period of 0.5–1.0 sec. Simulation results show that, within the allowable error range, the actual converter station power distribution ratio consistent with the set transmission power ratio and the DC voltage is maintained within the system reasonable operating range based on droop characteristic curve.
Although the results with IEEE standard system in Figure 8(b) show little fluctuation both in active power and in DC voltage, the normal operation of the system will not be affected for the fact that the little fluctuation can be neglected against the rated power capacity and voltage level, and the working principle of the proposed control strategy is also proved to be effective according to the system response to the change of working states. 4.3. Simulation of Faults in AC System. The initial power output of wind farms is 130 MW before 0.5 seconds while the total output rises to 430 MW with the corresponding change in active power reference value Δ𝑃ref = [150, 150, 0, 0]. The initial transmission power ratio is 3 : 2 and remains unchanged. A three-phase short circuit fault is applied to AC system which is connected to the 3rd GSVSC at 1 second
Journal of Electrical and Computer Engineering
9 440
400 300
430
100
Udc (kV)
P (MW)
200
0 −100
420
410
−200 −300 −400
400 0.5
1
1.5
2
0.5
1
t (s) P1 P2
P3 P4
1.5
2
t (s) Udc3 Udc4
Udc1 Udc2
(a) Active power of each VSC/MW
(b) DC voltage of each VSC/kV
Figure 9: Simulation of three-phase faults of AC system.
with duration of 0.15 seconds. Figure 9 shows the simulation results of transmission power and DC voltage. The simulation results of AC system with a serious threephase short circuit are shown in Figure 9. Before the failure, due to the minimum initial power required, the wind power which is delivered into the AC system by the 3rd GSVSC is 126 MW considering the system loss. When the wind power output increases to 500 MW at 0.5 seconds, the transmission power delivered to AC system is in coordination with the transmission ratio, namely, 305 MW and 118 MW. When the three-phase short circuit is applied at 1 second, the transmission power of the 3rd GSVSC decreases quickly to zero due to the rapid drop of voltage in its AC bus; consequently all the wind power output needs to be transmitted through the 4th GSVSC into the AC system, which is beyond the rated capacity of the station. Thus the 4th GSVSC operates in extreme state with the transmission power of rated 400 MW, the excessive power pushes the DC voltage out of control which is up to about 435 kV, and the abnormal high voltage in actual operation may cause the outage of the system due to equipment limitations or trigger voltage of protection devices. The situation in which DC voltage is out of control similar to the above can occur when the transmission lines for delivering the wind power out are blocked. In order to avoid this problem caused by the excessive wind power blocked in DC networks, damping resistance can be equipped in the DC side of GSVSC which works in bypass mode during normal operation and consumes excessive power to balance the system when faults occur as shown in [20]. From the point of view of energy conservation, energy storage devices can also be applied in the DC side of WFVSCs such as superconducting magnetic energy storage (SMES) and supercapacitor energy storage devices in [21, 22]. The excessive wind power when the faults occur in DC transmission lines or AC system will be stored in these storage devices and released back to
AC system when faults are cleared. The method mentioned above can also reduce the influence of excessive active power on system and improves the FRT ability of the system.
5. Conclusions In this paper, the priority control strategy for GSVSC is proposed considering the uncertain output power of wind farms and the different penetration rate of wind power for the AC grid to realize a rational power allocation and smooth DC voltage control. This strategy can provide reference for the wind power trade when wind farms are interconnected with other grids for power supply. A DC network with four terminals for incorporating wind farms is established. The relationship between the active power and DC voltage of the DC network is analyzed according to the operation condition of the priority controller combined with voltage droop control and PI control. The proposed control strategy under different operating conditions is simulated in PSCAD/EMTDC, and the simulation results show the effectiveness of the system on power distribution and DC voltage control.
Conflict of Interests The authors declare that there is no conflict of interests regarding the republication of this paper.
References [1] J. Chen, “Development of offshore wind power in China,” Renewable and Sustainable Energy Reviews, vol. 15, no. 9, pp. 5013–5020, 2011. [2] L. Hong and B. M¨oller, “Offshore wind energy potential in China: under technical, spatial and economic constraints,” Energy, vol. 36, no. 7, pp. 4482–4491, 2011.
10 [3] N. B. Negra, J. Todorovic, and T. Ackermann, “Loss evaluation of HVAC and HVDC transmission solutions for large offshore wind farms,” Electric Power Systems Research, vol. 76, no. 11, pp. 916–927, 2006. [4] G. Ramtharan, A. Arulampalam, J. B. Ekanayake, F. M. Hughes, and N. Jenkins, “Fault ride through of fully rated converter wind turbines with AC and DC transmission systems,” IET Renewable Power Generation, vol. 3, no. 4, pp. 426–438, 2009. [5] T. Lobos, J. Rezmer, T. Sikorski, and Z. Waclawek, “Power distortion issues in wind turbine power systems under transient states,” Turkish Journal of Electrical Engineering & Computer Sciences, vol. 16, no. 3, pp. 229–238, 2008. [6] M. S. Carmeli, F. Castelli-Dezza, D. Rosati, G. Marchegiani, and M. Mauri, “MVDC connection of offshore wind farms to the transmission system,” in Proceedings of the International Symposium on Power Electronics, Electrical Drives, Automation and Motion (SPEEDAM ’10), pp. 1201–1206, June 2010. [7] R. T. Pinto, P. Bauer, S. F. Rodrigues, E. J. Wiggelinkhuizen, J. Pierik, and B. Ferreira, “A novel distributed direct-voltage control strategy for grid integration of offshore wind energy systems through MTDC network,” IEEE Transactions on Industrial Electronics, vol. 60, no. 6, pp. 2429–2441, 2013. [8] N. R. Chaudhuri and B. Chaudhuri, “Adaptive droop control for effective power sharing in multi-terminal DC (MTDC) grids,” IEEE Transactions on Power Systems, vol. 28, no. 1, pp. 21–29, 2013. [9] L. Xu and P. Cartwright, “Direct active and reactive power control of DFIG for wind energy generation,” IEEE Transactions on Energy Conversion, vol. 21, no. 3, pp. 750–758, 2006. [10] A. D. Hansen and G. Michalke, “Fault ride-through capability of DFIG wind turbines,” Renewable Energy, vol. 32, no. 9, pp. 1594–1610, 2007. [11] Y. Xi, A. Qian, H. Jiantao, and A. Yiran, “Application of multipoint DC voltage control in VSC-MTDC system,” Journal of Electrical and Computer Engineering, vol. 2013, Article ID 257387, 7 pages, 2013. [12] W. Lu and B.-T. Ooi, “Optimal acquisition and aggregation of offshore wind power by multiterminal voltage-source HVDC,” IEEE Transactions on Power Delivery, vol. 18, no. 1, pp. 201–206, 2003. [13] T. Nakajima and S. Irokawa, “A control system for HVDC transmission by voltage sourced converters,” in Proceedings of the IEEE Power Engineering Society Summer Meeting, vol. 2, pp. 1113–1119, IEEE, Edmonton, Canada, June 1999. [14] R. L. Hendriks, G. C. Paap, and W. L. Kling, “Control of a multiterminal VSC transmission scheme for connecting offshore wind farms,” in Proceedings of the European Wind Energy Conference and Exhibition (EWEC ’07), pp. 565–572, Milan, Italy, May 2007. [15] J. Ren, K. Li, H. Liu, Y. Sun, and J. Zhao, “Coordinated control strategy of VSC-MTDC system based on improved DC voltage-active power characteristic,” Automation of Electric Power Systems, vol. 37, no. 15, pp. 133–139, 2013. [16] L. Xu and L. Yao, “DC voltage control and power dispatch of a multi-terminal HVDC system for integrating large offshore wind farms,” IET Renewable Power Generation, vol. 5, no. 3, pp. 223–233, 2011. [17] J. Ren, K. Li, J. Zhao, X. Dong, and X. Zhang, “A multi-point DC voltage control strategy of VSCMTDC transmission system for integrating large scale offshore wind power,” in Proceedings of the IEEE Innovative Smart Grid Technologies—Asia (ISGT Asia ’12), IEEE, May 2012.
Journal of Electrical and Computer Engineering [18] R. Eriksson, J. Beerten, M. Ghandhari, and R. Belmans, “Optimizing DC voltage droop settings for AC/DC system interactions,” IEEE Transactions on Power Delivery, vol. 29, no. 1, pp. 362–369, 2014. [19] W. Wang and M. Barnes, “Power flow algorithms for multiterminal VSC-HVDC with droop control,” IEEE Transactions on Power Systems, vol. 29, no. 4, pp. 1721–1730, 2014. [20] G. P. Adam, K. H. Ahmed, S. J. Finney, and B. W. Williams, “AC fault ride-through capability of a VSC-HVDC transmission systems,” in Proceedings of the 2nd IEEE Energy Conversion Congress and Exposition (ECCE ’10), pp. 3739–3745, Atlanta, Ga, USA, September 2010. [21] C. Rao, H. Wang, W. Wang et al., “Enhancement of the stable operation ability of large scale wind power system based on the VSC-HVDC embedded in energy storage apparatus,” Power System Protection and Control, vol. 4, pp. 1–7, 2014. [22] J. Wang, T. Liu, and X. Li, “Influence of connecting wind farms and energy storage devices to power grid on reliability of power generation and transmission system,” Power System Technology, vol. 5, pp. 165–170, 2011.
International Journal of
Rotating Machinery
Engineering Journal of
Hindawi Publishing Corporation http://www.hindawi.com
Volume 2014
The Scientific World Journal Hindawi Publishing Corporation http://www.hindawi.com
Volume 2014
International Journal of
Distributed Sensor Networks
Journal of
Sensors Hindawi Publishing Corporation http://www.hindawi.com
Volume 2014
Hindawi Publishing Corporation http://www.hindawi.com
Volume 2014
Hindawi Publishing Corporation http://www.hindawi.com
Volume 2014
Journal of
Control Science and Engineering
Advances in
Civil Engineering Hindawi Publishing Corporation http://www.hindawi.com
Hindawi Publishing Corporation http://www.hindawi.com
Volume 2014
Volume 2014
Submit your manuscripts at http://www.hindawi.com Journal of
Journal of
Electrical and Computer Engineering
Robotics Hindawi Publishing Corporation http://www.hindawi.com
Hindawi Publishing Corporation http://www.hindawi.com
Volume 2014
Volume 2014
VLSI Design Advances in OptoElectronics
International Journal of
Navigation and Observation Hindawi Publishing Corporation http://www.hindawi.com
Volume 2014
Hindawi Publishing Corporation http://www.hindawi.com
Hindawi Publishing Corporation http://www.hindawi.com
Chemical Engineering Hindawi Publishing Corporation http://www.hindawi.com
Volume 2014
Volume 2014
Active and Passive Electronic Components
Antennas and Propagation Hindawi Publishing Corporation http://www.hindawi.com
Aerospace Engineering
Hindawi Publishing Corporation http://www.hindawi.com
Volume 2014
Hindawi Publishing Corporation http://www.hindawi.com
Volume 2014
Volume 2014
International Journal of
International Journal of
International Journal of
Modelling & Simulation in Engineering
Volume 2014
Hindawi Publishing Corporation http://www.hindawi.com
Volume 2014
Shock and Vibration Hindawi Publishing Corporation http://www.hindawi.com
Volume 2014
Advances in
Acoustics and Vibration Hindawi Publishing Corporation http://www.hindawi.com
Volume 2014