36
JOURNAL OF APPLIED METEOROLOGY AND CLIMATOLOGY
VOLUME 49
Probabilistic Parameterizations of Visibility Using Observations of Rain Precipitation Rate, Relative Humidity, and Visibility I. GULTEPE Cloud Physics and Severe Weather Research Section, Science and Technology Branch, Meteorological Research Division, Environment Canada, Toronto, Ontario, Canada
J. A. MILBRANDT Numerical Weather Prediction Research Section, Meteorological Research Division, Environment Canada, Dorval, Quebec, Canada (Manuscript received 6 December 2007, in final form 17 June 2009) ABSTRACT This study analyzes the occurrence of the visibility (Vis) versus precipitation rates (PR) for rain and versus relative humidity (RH) from surface observations that were collected during the Fog Remote Sensing and Modeling (FRAM) field project, which was conducted near Toronto, Ontario, Canada, during the winter of 2005/06 and in Lunenburg, Nova Scotia, during the summers of 2006 and 2007. The main observations used in the analysis were PR and Vis for rain episodes from the Vaisala, Inc., FD12P present-weather sensor and RH and temperature from the Campbell Scientific Instruments, Inc., HMP45 sensor. The PR is compared with those from a total precipitation sensor to check the accuracy of the FD12P measurements. Vis parameterizations related to precipitation type have been previously studied by many other researchers and showed large variability in Vis (up to 1 order of magnitude) for a fixed PR. The results from the work presented here suggest that 1) significant differences exist among the various parameterizations of Vis (deterministic approach) and 2) statistical relationships obtained using fits applied to percentiles (probabilistic approach) can be a feasible alternative for model applications. Comparisons of previous parameterizations with the new Vis relationships suggest that simulated Vis values based on probabilistic approaches could be used in extremeweather applications.
1. Introduction Visibility (Vis) parameterizations as a function of relative humidity with respect to water (RHw) and precipitation rates (PR) are important for many weather forecast– related applications, including aviation, transportation, and search and rescue operations (Gultepe et al. 2007; Tardif 2007). In past applications, Vis parameterizations have been used in various models that include numerical weather prediction (NWP) models (Stoelinga and Warner 1999) and fog models (Roquelaure and Bergot 2007). These parameterizations were usually derived using few comprehensive measurements.
Corresponding author address: Ismail Gultepe, Cloud Physics and Severe Weather Research Section, Science and Technology Branch, MRD, Environment Canada, Toronto, ON M3H 5T4, Canada. E-mail:
[email protected] DOI: 10.1175/2009JAMC1927.1
The RHw predicted from NWP models has been used for Vis parameterizations (Smirnova et al. 2000). However, changes to the parameterizations have continuously been made because of the uncertainty in the accuracy of RHw measurements. The earlier work indicates that significant differences exist among the various parameterizations of Vis (Gultepe and Isaac 2006); therefore, their application to NWP models includes large uncertainties. Gultepe and Isaac (2006) suggested a relationship between Vis and RHw based on the measurements from the Vaisala, Inc., FD12P present-weather sensor and the Campbell Scientific Instruments, Inc., HMP45 instrument in which their Vis values were found to be significantly higher than those obtained from the relationships used in the Rapid Update Cycle (RUC; Benjamin et al. 2004) model-based Vis. Using conventional surface observations, other Vis–RHw relationships were also proposed by Doran et al. (1999) and Knapp (1998), but their relationships were not used extensively. Most NWP and
JANUARY 2010
GULTEPE AND MILBRANDT
fog models use the translation algorithm that transforms hydrometeor water content to extinction coefficient to parameterize Vis (Stoelinga and Warner 1999; Bergot et al. 2005). The Vis–PR relationships for rain (hereinafter PRR) were sometimes obtained using extinction coefficients versus liquid water content (LWC), where the latter is inferred from radar reflectivity. Details of these types of relationship were given in Stallabrass (1985), Stoelinga and Warner (1999), and Seagraves (1984). When the measured PRR rates are converted to the condensed water content (e.g., LWC), Vis values are obtained using empirical relationships. It is clear that, because of the variable nature of the particle size distributions, the Vis–PRR parameterizations, in reality, result in large variability that depends on environmental thermodynamic conditions. The objectives of this study are 1) to develop a new parameterization for Vis as a function of RHw from observations and to compare it with those obtained from the RUC model (VisRUC) and 2) to develop bulk parameterizations of Vis as a function of PRR for extremeweather conditions based on probabilistic approaches. The article is organized as follows. Section 2 provides a summary of the observations collected during the Fog Remote Sensing and Modeling (FRAM) project. In section 3, analysis of Vis measurements and the concept behind the use of probability curves are described. The results are presented in section 4, followed by a discussion in section 5. Concluding remarks are given in section 6.
2. Observations Surface observations were collected during the FRAM field projects, which were conducted at the Center for Atmospheric Research Experiment site near Toronto, Ontario, Canada, during the winter of 2005/06 (FRAM-C) and in Lunenburg, Nova Scotia, during the summers of 2006 (FRAM-L1) and 2007 (FRAM-L2). The main observations used in the analysis were Vis and PRR from the Vaisala FD12P present-weather instrument. The PRR from the total precipitation sensor (TPS) of Yankee Environmental Systems, Inc., (YES) and the Ott Messtechnik, GmbH, laser-based particle size and velocity (Parsivel) optical distrometer, and RHw together with temperature T from the Campbell Scientific HMP45 instrument were also used in the analysis. Details on some of these instruments can be found in Gultepe et al. (2006, 2009), and others are discussed below. The FD12P present-weather sensor is a multivariable sensor for automatic weather stations and airport weatherobserving systems (Vaisala, Inc., 2002). The sensor measures Vis, accumulated precipitation amount (PA), and instantaneous PR for both liquid and solid precipitations,
37
but PR for snow measurements is not used in this analysis because of unknown particle shape or density. The structural basis of the FD12P is the pole mast supporting the transducer cross arm (FDC115), which contains the optical units of the FDT12B transmitter, FDR12 receiver, and DRD12 precipitation sensor. The FD12P also contains the DTS14 temperature sensor. The FDT12B transmitter emits near-IR light, tilted 16.58 downward, and the FDR12 receiver measures the forward-scattered light from the FDT12B light beam at 16.58 downward; therefore, the receiver measures light scattered at an angle of 338. The measured radiance is then converted to Vis value (meteorological optical range; MOR) and optical density, which is related to the volume of the particles. Based on the manufacturer’s specifications, the FD12P measurements for Vis are accurate to approximately 4%, and PRR sensitivity is approximately 0.05 mm h21 for both rain and snow. However, because snow PR is smaller relative to PRR and its particle shape is usually unknown, its accuracy decreases rapidly when PR , 1–2 mm h21; therefore, it is not used in the analysis. Haij (2007) provided FD12P PRR accuracy on precipitation measurements up to 35%. Details on the YES TPS-3100 can be found in Rasmussen et al. (2002). The TPS measures instantaneous total wet deposition, which includes liquid and frozen precipitation during a precipitation event. The sensor head consists of two hot plates (HP), approximately 5 in. (;13 cm) in diameter that are warmed by electrical heaters. During precipitation events, it measures the rate of rain or snow by how much power is needed to evaporate precipitation on the upper plate while maintaining a constant surface temperature. The second, lower plate, positioned directly under the evaporating plate, is heated to the same temperature and is used to factor out cooling caused by the wind. The PR is then derived from the power difference between the two plates, corrected for ambient temperature and wind speed. The TPS-3100 measurement accuracy of the real-time PR exceeds other rain gauges because of its unique compact design, the lack of fluids to change, and its capability to measure correctly the wind speed variations without the use of wind shielding (Rasmussen et al. 2002). The TPS-3100 provides PR measurements instantaneously within 1 min after rainfall begins. If the rainfall rate exceeds approximately 25 mm h21, the TPS-3100 may not keep up with evaporating all of the rain, which may result in significant differences when compared with other instruments. Its measurement range is between 0 and 25 mm h21, with a time constant of 1 min and a resolution of 0.1 mm h21. The TPS-3100 algorithm to calculate precipitation rate uses both 1- and 5-min running averages. The onset of
38
JOURNAL OF APPLIED METEOROLOGY AND CLIMATOLOGY
VOLUME 49
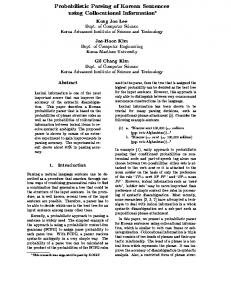
FIG. 1. Scatterplot of HP (TPS) PRR vs FD12P PRR for liquid precipitation from FRAM-L collected during June 2007 in Lunenburg. The red solid line is the 1:1 line.
precipitation is based on the 5-min average of instantaneous precipitation. This is done to prevent random variations in precipitation measurements caused by turbulence effects. The Ott Parsivel is designed to operate under all weather conditions (Lo¨ffler-Mang and Joss 2000; Lo¨fflerMang and Blahak 2001). For rain measurements, this instrument can provide accurate information on present weather, rain amount and rate, particle spectrum, visibility, and radar reflectivity. It has a built-in heating device to reduce the effects of freezing and frozen precipitation that may accrete on the critical surfaces of the instrument. Particle size is classified into the 32 classes of sizes and velocities. The basic measuring ranges for velocity and size are from 0 to 20 m s21 and 0.2 to 25 mm, respectively. According to the manufacturer, the rainrate accuracy is approximately 5%. In this study, the Ott Parsivel is used to point out variability in the measurements of particle spectra as presented in section 5.
3. Analysis In this section, Vis and PRR values obtained from the various instruments described in section 2 are discussed. The FD12P measurements together with RHw data are then presented along with the application of the probabilistic curves. For the Vis–PRR relationships, the data points are removed from the analysis when RHw . 95%
and PR . 0.1 mm h21. This step means that reduction of visibility is due entirely to the precipitation. The 95% RHw threshold value is used to reduce the effects of haze and moisture on Vis calculations, because the goal was to obtain only Vis–PR relationships. Note that uncertainty in RHw that is observed during measurements can be as high as 5%. For fog conditions, relationships for Vis versus LWC and droplet number concentration Nd that are given by Gultepe et al. (2006) are used in an application given later in this paper.
a. Vis calculations from FD12P The instantaneous measurements (15-s sampling rate) of the extinction parameters bext, using Koschmieder’s law and assuming a brightness contrast threshold « of 0.05, were converted to Vis (Vaisala, Inc., 2002) as follows: Vis 5
ln(0.05)bext1 .
(1)
The instantaneous Vis values obtained from the FD12P were then used to obtain 1- and 10-min average values that were plotted against RHw and PRR. The light scattering from a precipitation particle is proportional to the particle cross section, which is related to Vis values. This proportionality is stable for rain because droplets are quasi-spherical. Then, in addition to optical intensity, the DRD12 capacitance sensor data were used to estimate the precipitation intensity (Haij 2007; Vaisala manual
JANUARY 2010
GULTEPE AND MILBRANDT
available online at http://www.vaisala.com). The intensity ratio (optical signal/DRD12 signal) being larger than a threshold parameter (e.g., 5), DRD12 signal for liquid water equivalent amount and T were used to classify the particle type as snow, drizzle, or rain. In this work, the precipitation type is assumed to be snow for T , 218C; these values were discarded from the analysis. The FD12P can measure drops from drizzle size range up to the maximum size of a raindrop. Drizzle size range for FD12P covers diameters from 100 to 500 mm. However, drops that are not counted as drizzle may be present and could cause very low Vis values. During field projects, it is observed that drizzle size is usually greater than 100 mm. It is clear that extinction of visible light is related to whatever exists in the air: for example, moisture, aerosols, rain drops, and fog droplets. The Vis obtained using RH therefore represents moisture amount in the air, which in turn is related to aerosols and their wetness. The Vis found by FD12P is directly measured by extinction of visible light and does not depend on measured quantities of hydrometeors by the sensor. The accuracy of the Vis–PRR relationship strongly depends on uncertainties related to PRR. Figure 1 shows the entire set of observations collected during the FRAM-L project, representing rain and drizzle values. When PRR is less than 0.5 mm h21 (for drizzle conditions), uncertainty in PRR is more than 75%. However, this can be true for any instrument being used for PRR analysis during a lightprecipitation event, and there is no single instrument that measures PRR accurately for drizzle-size particles. This suggests that Vis–PRR relationships for drizzle conditions should be used carefully. The manufacturing uncertainty given for FD12P Vis is about 4%.
b. Precipitation-rate comparisons Measurements of PRR obtained from the YES TPS sensor were used in the validation of FD12P measurements (Fig. 1). Drizzle values are obtained using FD12P measurements in which droplets smaller than 500 mm in diameter are considered to be drizzle. Drizzle PR is usually less than approximately 2–3 mm h21. The mean absolute difference between two measurements obtained from both instruments is found to be approximately 0.11 mm h21 for rain conditions, suggesting that the FD12P measurement accuracy was within acceptable levels. However, the accuracy decreases significantly when PRR , 0.5 mm h21 (Fig. 1).
c. Probabilistic versus deterministic approach for parameterizations The parameterization of Vis is obtained using two approaches based on 1) fits applied to the values averaged over the specified bins because of irregular data
39
FIG. 2. (a) The black lines represent percentiles applied to observations (red dots) for FRAM-L. (b) Vis vs RHw for AIRS2 measurements (black dots) and a fit to observations (solid blue line). The black solid line in (b) is a fit to the hourly observations obtained from the Pearson Airport site during FRAM-C. The red lines in (b) are taken from (a). The green line represents the RUC model parameterization (Smirnova et al. 2000).
distribution over the entire data range (the deterministic approach) and 2) fits to percentile values (the probabilistic approach). Deterministic approaches are used more often relative to probabilistic approaches because of the simplicity in interpretation. In deterministic approaches, a curve fit applied to mean values is used to obtain Vis as a function of PRR. However, the scatter of data points around the mean complicates the situation because statistical meaning for a best fit relies on lower residuals and higher correlation coefficients (e.g., lower variability). If this does not work, then probabilistic approaches should be applied for the cases in which extremeweather conditions (i.e., low Vis) are considered. In the probabilistic approach, the curve fits are obtained for 5%, 50% (median), and 95% probabilities of Vis as
40
JOURNAL OF APPLIED METEOROLOGY AND CLIMATOLOGY
VOLUME 49
TABLE 1. Parameterizations of Vis (km) vs RHw (%) obtained from this analysis and from earlier work. Eq. no.
Relationship
Conditions
Reference
(T1) (T2) (T3) (T4) (T5) (T6)
VisRUC 5 60 exp[22.5(RHw 2 15)/80] VisFRAM-C 5 241.5 ln(RHw) 1 192.30 VisAIRS 5 20.0177RHw2 1 1.46RHw 1 30.80 VisFRAM-L(5%) 5 20.000 114RH2w.70 1 27.45 VisFRAM-L(50%) 5 25.19 3 10210RH5w.44 1 40.10 VisFRAM-L(95%) 5 29.68 3 10214RH7w.19 1 52.20
Set to 5 km at RHw 5 95% For RHw . 30% For RHw . 30% For RHw . 30% For RHw . 30% For RHw . 30%
RUC model Gultepe et al. (2006) Gultepe et al. (2006) FRAM (this work) FRAM (this work) FRAM (this work)
a function of PRR (or RHw). If the 5% curve is intended to be used, it implies that 95% of the data points will have a higher Vis than on the 5% curve. For example, for a situation in which it would be dangerous for an aircraft to land (Vis below a certain value), it can be more useful to know a possible lowest Vis value occurring rather than to know a most-likely Vis value. Thus, for a given RHw and PRR, the 5% probability curve can be used to indicate a 5%-or-greater chance of occurring. Note that uncertainty in PRR measurements is not better than 5%–10%; therefore, a threshold of 5% is chosen for the calculations.
4. Results Sections 4a and 4b, using the approaches explained above, summarize the results related to the Vis–RHw and Vis–PRR relationships that use deterministic and probabilistic approaches.
a. Visibility versus RHw Before comparisons with earlier work, the Vis–RHw scatterplot (Fig. 2a) for the FRAM-L project (T . 08C) is obtained using the entire dataset. Use of a mean curve fit to data cannot be used directly to predict Vis because, for a given RHw, Vis values range up to one order of magnitude.
The relationships for comparison purposes, based on observations collected as part of the FRAM-C, FRAM-L, and aircraft icing research study (AIRS2; Gultepe and Isaac 2006) data, are given in Table 1 and are shown in Fig. 2b. Figure 2b also shows the Vis–RHw relationships that are used in the RUC model (Smirnova et al. 2000). Using the Vis and RHw surface observations regularly collected at the Toronto Pearson International Airport during FRAM-C, the Vis–RHw relationship obtained for hourly data is also shown in Fig. 2b (black solid line). Observations from the AIRS2 Mirabel site are then overlaid on the plot assuming PR , 0.1 mm h21. This eliminated the data points for precipitation cases. The RHw in Fig. 2b has limits of 30% and 100%, and the results can be extrapolated to beyond the lower limit if necessary. Differences among the fits given above for this work and those from the RUC model are found to be very pronounced; therefore, additional observations are needed for further validation. In general, VisRUC near 100% RHw is found to be significantly larger than VIS values obtained from the other datasets. On the other hand, for RHw , 95%, VisRUC is significantly lower than those of this work (Fig. 2b). Using the curve fit for the 50% RHw values [Eq. (T5) in Table 1], a comparison between the observed and estimated Vis is shown in Fig. 3. Estimated RHw (green
FIG. 3. Vis, RHw, T, and PRR time series from observations for 27 Jun 2006 and the results for the proposed parameterization (Vis–RHw) given in Table 2. The green line is from the parameterization.
JANUARY 2010
GULTEPE AND MILBRANDT
41
line) follows the trend of the Vis1min and Vis10min data points when there is no precipitation. Before 0900 UTC, there was no precipitation and Vis was approximately a few hundred meters during the fog event. Between 0900 and 1800 UTC, both the estimated and observed Vis were high (.20 km). These results suggest that the Vis–RHw empirical relationship followed the observations coherently for this case. One should not forget that an empirical fit to mean values (;50%) represents only the data points along the fit line (deterministic approach), with scatter around the means representing variability (low correlation coefficient). For this reason, the fits for percentiles (5% and 95%; the probabilistic approach) are also given in Table 1 to represent extreme conditions. This means that, depending on the objectives of the application, such as for very low Vis values (500 m) or very high Vis values (20 km), one of the percentile-based fits can be applied in numerical simulations.
b. Visibility versus PR for rain In the RUC and other NWP models, the parameterizations of fog Vis and rain Vis, as given by Kunkel (1984) and Stallabrass (1985), have been used extensively. Observations of Vis versus PRR and versus drizzle PR (represented as PRD) are shown in Fig. 4a and Fig. 4b, respectively. Drizzle here is defined based on a size criterion of 100–500 mm that roughly corresponds to a condition of PR less than ;2 mm h21. Data points are obtained using FD12P measurements. The fit to the observations obtained from FD12P (1-min averages) together with bars representing the standard deviation and fits for 5%, 50%, and 95% are also overlaid on the observations. It is found that the scattering of data points was very large and that changes in Vis for a given PR for both rain and drizzle were high. This suggests that Vis–PR relationships are not unique and that additional parameters (particle number concentration, density, etc.) should be considered to derive deterministic relationships. As stated by Ulbrich and Atlas (1985), the experimental rainfall rates found from the optical extinction using an empirical relation were generally within approximately 25% of those determined from rain gauges. They also showed that the scatter in experimental results and the differences between theoretical and experimental results can be explained in terms of variations in the form or shape of rain drop size distributions (DSD). Based on their work, other characteristics of a particle size distribution, such as the total particle number concentration and particle size, need to be considered in the microphysical parameterizations. The wide spread in the Vis values in Fig. 4a illustrates the importance of using the appropriate probability curve to estimate Vis from PR depending on a specific
FIG. 4. (a) Vis vs PRR from all observations (red dots) obtained during FRAM-L; the fits for percentiles (left inset) and mean values (right inset) are also shown. (b) Black filled circles are for rain, and green filled circles are for drizzle events for the 10–11 Jun 2007 case. The fit equations and fits to the 1-min data points are also shown. Drizzle size range is 100–500 mm. Black circles for rain when Vis , 1 km are likely due to droplets with sizes close to drizzle sizes.
application. For example, at PRR of 10 mm h21 (Fig. 4a) Vis can range from 1.5 (at 5%) to 5 (at 95%) km. If a given application requires the prediction of the most likely Vis value, then either the 50% probability curve or the best-fit curve can be used. On the other hand, if an application requires extreme caution with regard to visibility, as in the example of the landing of an aircraft, then the 5% probability curve can be used. The effect of drizzle on Vis can be more than the effect of rain (Fig. 4b). Figure 4 shows that VisD can be at least a factor of 2 smaller than that of PRR.
42
JOURNAL OF APPLIED METEOROLOGY AND CLIMATOLOGY
VOLUME 49
FIG. 5. Vis, RHw, T, and PRR time series from observations for 15 Jun 2006 (rain case), and the results for the proposed parameterization (Vis–PRR) given in Table 2. The green line denotes the parameterization.
Figure 5 shows time series of the PRR, Vis, RHw, T, and Vis–PRR fit result over ;24-h time period on 15 June 2007. When PRR increases, the Vis obtained from both deterministic parameterization and observations becomes lower. In general, Vis from both observations and parameterization agrees well with each other for certain conditions; as shown in Fig. 4a, the scatter of data points is usually very large. This means that the deterministic fits are not applicable for all types of rain conditions. This type of result was also emphasized by Ulbrich and Atlas (1985), who suggested that the details of the DSD can be important for Vis calculations. For practical applications, a probabilistic approach given above for Vis prediction based on forecast model outputs is considered in the following section.
conditions) likely result in lower Vis when compared with other studies. The drizzle effect on Vis values was very significant and was observed at least 30% of the time during the FRAM-L project; in some cases, it resulted in fog dissipation at the end of a fog event. As shown in Fig. 4b, Vis values during drizzle events were significantly smaller than those during cases of rain. Differences between the Vis–PRR relationships from this work and others suggest that drizzle effects on Vis calculations should be considered for future work.
5. Discussion Parameterizations of Vis versus RHw and Vis versus PRR are summarized in Tables 1 and 2 (described below), which show the fits to both mean values (the deterministic approach) and percentiles (the probabilistic approach). The relationships in these tables are obtained from the data shown in Figs. 2 and 4. Figure 6 shows the results from this work for rain and drizzle in comparison with others. Vis from previous work is obtained using Eq. (2), given by Stallabrass (1985) as bST 5 2.24LWC0.75 ,
(2)
where LWC is estimated using either LWCSS 5 0.052PR0.94 or LWCMP 5 0.072PR0.88, where the subscripts MP and SS represent the Marshall and Palmer (1948) and Sekhon and Srivastava (1971) work, respectively. For this work, Vis decreases gradually with increasing PRR and PRD (Fig. 6) and, excluding PRR , 2 mm h21, Vis becomes much smaller relative to those of earlier work. This suggests that low PRR values (e.g., in drizzle
FIG. 6. Vis-vs-PR relationships for rain and drizzle, shown with red solid lines and red dashed lines, respectively, overlaid on all data points (red dots). For previous studies, Eq. (2) is used to show Vis–PR relationships (blue solid lines). The Vis and PRR are obtained from FD12P measurements.
JANUARY 2010
GULTEPE AND MILBRANDT
43
FIG. 7. Vis vs (a) RHw and (b) PRR for the 2 and 10 Jun 2007 cases. The 5%, 50%, and 95% probability curves are overlaid on 1-min-averaged observations.
For extreme Vis conditions (e.g., very low Vis), Vis versus RHw and PRR observations collected during the two FRAM-L2 cases (2 and 10 June) are shown in Figs. 7a and 7b, respectively. If the parameterizations based on mean values (or 50%) are used, a large number of data points in Fig. 7a are seen below or above the 50% line. For this reason, the probability curves should be considered for aviation/nowcasting applications when heavy precipitation is considered to be a hazardous condition. Figure 7b shows that a single fit for Vis versus PRR cannot be applicable when the physics of the air mass changes significantly. This result is also shown with a DSD obtained from the Ott Parsivel instrument. Figure 8 shows
FIG. 8. The relationships among Vispar, PRpar, and Ndt (total number concentration; m23) parameters obtained from the Ott Parsivel measurements: (a) Vis vs PRpar, (b) Ndt vs Vispar, and (c) Vispar vs PRpar/Ndt are shown for a light-rain case. The solid line in (a) and (c) is a fit to averaged observations. The red and yellow circles in (a) are for the instrument’s Vis and calculated Vis, respectively. Raindrop number density Nd vs Vispar for various size bins is shown in (b).
44
JOURNAL OF APPLIED METEOROLOGY AND CLIMATOLOGY
VOLUME 49
TABLE 2. Parameterizations of Vis (km) vs PR (mm h21) for rain and drizzle from the current work. Eq. no.
Precipitation type
(T7)
Rain (mean)
(4)
Rain (50%)
(3) (5)
Rain (5%) Rain (95%)
(T8)
Drizzle (mean)
Vis-vs-PRR relationship
droplet spectra for Vis versus PRR (Fig. 8a), droplet spectra density versus Vis (Fig. 8b), and a parameterization of Vis as a function of PR/Ndt (Fig. 8c) for a light rain case, where Ndt is for the total numbers of rain drops. Vis for rain cases is related to particle number concentration (Gultepe et al. 2006); therefore, Vis parameterizations should also take into account the value of Nd (and not only PR), which can be a prognostic variable in an NWP model. These types of parameterizations can be used to predict Vis when both Nd and PR (or LWC) are available from the models. The results pertaining to percentile fits applied to Vis– PRR observations are given in Table 2. Depending on a precipitation type, an equation from Table 2 can be used to obtain Vis. Using the rain-rate classification (heavy rainfall: PRR . 7.6 mm h21, moderate rainfall: 2.6 , PRR , 7.5 mm h21, and light rainfall: PRR , 2.6 mm h21; Glickman 2000), the 5% curve may be used for Vis calculation when heavy rain precipitation occurs. As an example, equations for the percentiles given below as a function of PRR, depending on rain type, can be used in model simulations as Vis5% R 5
0.45PR0R.394 1 2.28 for heavy rainfall,
where PRR . 7.6 mm h 1 , Vis50% R 5
Vis95% R 5
(3)
2.65PR0R.256 1 7.65 for moderate rainfall,
where 2.6 , PRR , 7.6 mm h 1 ,
and
(4)
863.26PR0R.003 1 874.19 for light rainfall,
where PRR , 2.6 mm h 1 .
Conditions
VisR 5 24.12PR0R.176 1 9.01 VisR 5 22.65PR0R.256 1 7.65 VisR 5 20.45PR0R.394 1 2.28 VisR 5 2863.26PR0R.003 1 874.19 VisD 5 22.66PRR 0.526 1 6.54
(5)
For example, when heavy rain occurs, the 95% fit equation can be used to estimate Vis. The 95% curve in Eq. (5) can be used for Vis calculation under the light precipitation conditions. Then, equations given for Vis– PRR in Table 2 together with Vis–RHw parameterizations given in Table 1 can be used to obtain integrated Vis values. In the case of both fog and precipitation occurring together, the calculated Vis values are converted to extinction coefficients using Eq. (1) for RHw,
Using mean values Using 50% occurrences Using 95% occurrences Using 5% occurrences Using mean values
fog LWC (Gultepe et al. 2006), and PRR; then, an integrated extinction coefficient is obtained as bint 5 bRH 1 bLWC 1 bR .
(6)
w
The final value of Vis is then calculated using Eq. (1), which utilizes bint from Eq. (6). Note that the conditions set for probability curves need to be tested for various geographical regions because of varying characteristics of cloud condensation nuclei related to their composition and hygroscopicity. For a fog event that occurred on 11 February 2009 (Figs. 9a,b), Vis obtained from the probabilistic parameterizations (e.g., 5%, 50%, and 95% curves), an RUC model forecast run, and an integrated fog parameterization (Gultepe et al. 2006) are shown in Fig. 9c, and the results are found to compare well to observed FD12P Vis. Integrated Vis values (black circles filled with yellow) are found to be comparable to the observed Vis (green line) between 1400 and 1830 UTC and to RUC Vis (blue line with triangles) after 1500 UTC. In this plot, the RHw, PRR, and LWC based on the Canadian Global Environmental Multiscale (GEM) NWP model (Coˆte´ et al. 1998) are used to obtain predicted Vis. In GEM simulations, LWC within the lowest model layer (,50 m) is assumed to be the same as total water content at warm temperatures. Note that gridpoint values of Vis obtained from the NWP models do not necessarily correspond directly to given point measurements because of issues regarding model grid spacing, spatial averaging, and natural variability. In this respect, the model- based results should consider subgrid-scale variability of Vis, PRR, RHw, and condensed water content if the final goal is to obtain an accurate Vis.
6. Conclusions In this work, the relationships between Vis and a related physical parameter (RHw or PRR) obtained from ground-based instrumentation were determined and were compared with previous studies. In addition, the forecasting-model outputs were used to obtain probabilistic Vis prediction and were compared with observations for a case study. Based on the results, the following five conclusions can be drawn:
JANUARY 2010
GULTEPE AND MILBRANDT
45
FIG. 9. (a) A picture taken during a heavy-fog event at 0957 LST 11 Feb 2009. (b) A picture taken at 1648 LST 11 Feb 2009 after a heavyrain occurrence (T 5 98C) in Richmond Hill, Ontario, Canada. There was ;20 cm of snow on the ground on this day. (c) Time series of Vis from the RUC model; probability curves with no fog contribution; and Vis with integrated contributions from fog LWC, PRR, and RHw for 50% percentiles.
1) The use of the previous relationships in the NWP models, especially for RHw, can result in an overestimation of Vis at conditions close to saturation with respect to water, whereas Vis at subsaturation is significantly underestimated. 2) The parameterizations of Vis based on PRR (or RHw) should be improved, considering the large variability in Vis related to PRR and RHw. 3) The new Vis parameterizations based on the percentiles (the probabilistic approach) can be used to replace the previous relationships used in the NWP
models, depending on application, such as heavy-rain conditions or aviation applications. 4) Significant differences in Vis–PRR relationships given by earlier studies are seen when PRR is less than 2–3 mm h21. The drizzle component of the Vis–PRR relationship is also very important to obtain accurate Vis values and needs to be further validated. 5) Forecasting-model applications suggest that, when fog and rain occur together, integrated Vis strongly depends on how accurate the simulated fog LWC, RHw, and PR values are.
46
JOURNAL OF APPLIED METEOROLOGY AND CLIMATOLOGY
In the future, additional observations from field programs that represent cold atmospheric conditions together with detailed microphysical measurements of drizzle and snow (e.g., snow density and shape) can be used to define limitations for the suggested relationships. These conclusions suggest that the new Vis parameterizations can significantly improve estimates of Vis in extreme conditions and for aviation applications. Acknowledgments. Funding for this work was provided by the Canadian National Search and Rescue Secretariat and by Environment Canada. Some additional funding was also provided by the European COST-722 fog initiative project office. Technical support for the data collection was provided by the Cloud Physics and Severe Weather Research Section of the Science and Technology Branch, Environment Canada, Toronto, Ontario. The authors are also thankful to M. Wasey and R. Reed of Environment Canada for technical support during the FRAM project. REFERENCES Benjamin, S. G., and Coauthors, 2004: An hourly assimilation– forecast cycle: The RUC. Mon. Wea. Rev., 132, 495–518. Bergot, T., D. Carrer, J. Noilhan, and P. Bougeault, 2005: Improved site-specific numerical prediction of fog and low clouds: A feasibility study. Wea. Forecasting, 20, 627–646. Coˆte´, J., S. Gravel, A. Methot, A. Patoine, M. Roach, and A. Staniforth, 1998: The operational CMC-MRB Global Environmental Multiscale (GEM) model. Part I: Design considerations and formulation. Mon. Wea. Rev., 126, 1373– 1395. Doran, J. A., P. J. Roohr, D. J. Beberwyk, G. R. Brooks, G. A. Gayno, R. T. Williams, J. M. Lewis, and R. J. Lefevre, 1999: The MM5 at the AF Weather Agency: New products to support military operations. Preprints, Eighth Conf. on Aviation, Range, and Aerospace Meteorology, Dallas, TX, Amer. Meteor. Soc., 115–119. Glickman, T. S., Ed., 2000: AMS Glossary of Meteorology. 2nd ed. Amer. Meteor. Soc., 855 pp. Gultepe, I., and G. A. Isaac, 2006: Visibility versus precipitation rate and relative humidity. Preprints, 12th Cloud Physics Conf., Madison, WI, Amer. Meteor. Soc. P2.55. [Available online at http://ams.confex.com/ams/Madison2006/techprogram/ paper_113177.htm.] ——, M. D. Mu¨ller, and Z. Boybeyi, 2006: A new visibility parameterization for warm fog applications in numerical weather prediction models. J. Appl. Meteor. Climatol., 45, 1469–1480.
VOLUME 49
——, and Coauthors, 2007: Fog research: A review of past achievements and future perspectives. J. Pure Appl. Geophys., 164, 1121–1159. ——, and Coauthors, 2009: The Fog Remote Sensing and Modeling (FRAM) field project. Bull. Amer. Meteor. Soc., 90, 341–359. Haij, M. D., 2007: Automated discrimination of precipitation type using the FD12P present weather sensor: Evaluation and opportunities. KNMI Tech. Note 297, 73 pp. Knapp, D., 1998: An advanced algorithm to diagnose atmospheric turbulence using numerical model output. Preprints, 16th Conf. on Weather Analysis and Forecasting. Phoenix, AZ, Amer. Meteor. Soc., 79–81. Kunkel, B. A., 1984: Parameterization of droplet terminal velocity and extinction coefficient in fog models. J. Climate Appl. Meteor., 23, 34–41. Lo¨ffler-Mang, M., and J. Joss, 2000: An optical disdrometer for measuring size and velocity of hydrometeors. J. Atmos. Oceanic Technol., 17, 130–139. ——, and U. Blahak, 2001: Estimation of the equivalent radar reflectivity factor from measured snow size spectra. J. Appl. Meteor., 40, 843–849. Marshall, J. S., and W. McK. Palmer, 1948: The distribution of raindrops with size. J. Meteor., 17, 1054–1061. Rasmussen, R. M., J. Hallett, R. Purcell, J. Cole, and M. Tryhane, 2002: The hot plate snow gauge. Preprints, 11th Conf. on Cloud Physics, Ogden, UT, Amer. Meteor. Soc., P1.6. [Available online at http://ams.confex.com/ams/11AR11CP/ techprogram/paper_42751.htm.] Roquelaure, S., and T. Bergot, 2007: Seasonal sensitivity on COBEL-ISBA local forecast system for fog and low clouds. J. Pure Appl. Geophys., 164, 1283–1303. Seagraves, M. A., 1984: Precipitation rate and extinction in falling snow. J. Atmos. Sci., 41, 1827–1835. Sekhon, R. S., and R. C. Srivastava, 1971: Doppler radar observations of drop-size distributions in a thunderstorm. J. Atmos. Sci., 28, 983–994. Smirnova, T. G., S. G. Benjamin, and J. M. Brown, 2000: Case study verification of RUC/MAPS fog and visibility forecasts. Preprints, Ninth Conf. on Aviation, Range, and Aerospace Meteorology, Orlando, FL, Amer. Meteor. Soc., 2.3. Stallabrass, J. R., 1985: Measurements of the concentration of falling snow. Proc. Snow Property Measurements Workshop (Tech. Memo. 140). Lake Louise, AB, Canada, National Research Council Canada, 389–410. Stoelinga, M. T., and T. T. Warner, 1999: Nonhydrostatic, mesobetascale model simulations of cloud ceiling and visibility for an East Coast winter precipitation event. J. Appl. Meteor., 38, 385–404. Tardif, R., 2007: The impact of vertical resolution in the explicit numerical forecasting of radiation fog: A case study. J. Pure Appl. Geophys., 164, 1221–1241. Ulbrich, C. W., and D. Atlas, 1985: Extinction of visible and infrared radiation in rain: Comparison of theory and experiment. J. Atmos. Oceanic Technol., 2, 331–339. Vaisala, Inc., 2002: Weather sensor FD12P user’s guide. Vaisala, Inc., 65 pp.